
This page applies to business users. This page describes what actions are available during an active investigation.
OverviewCopy link to clipboard
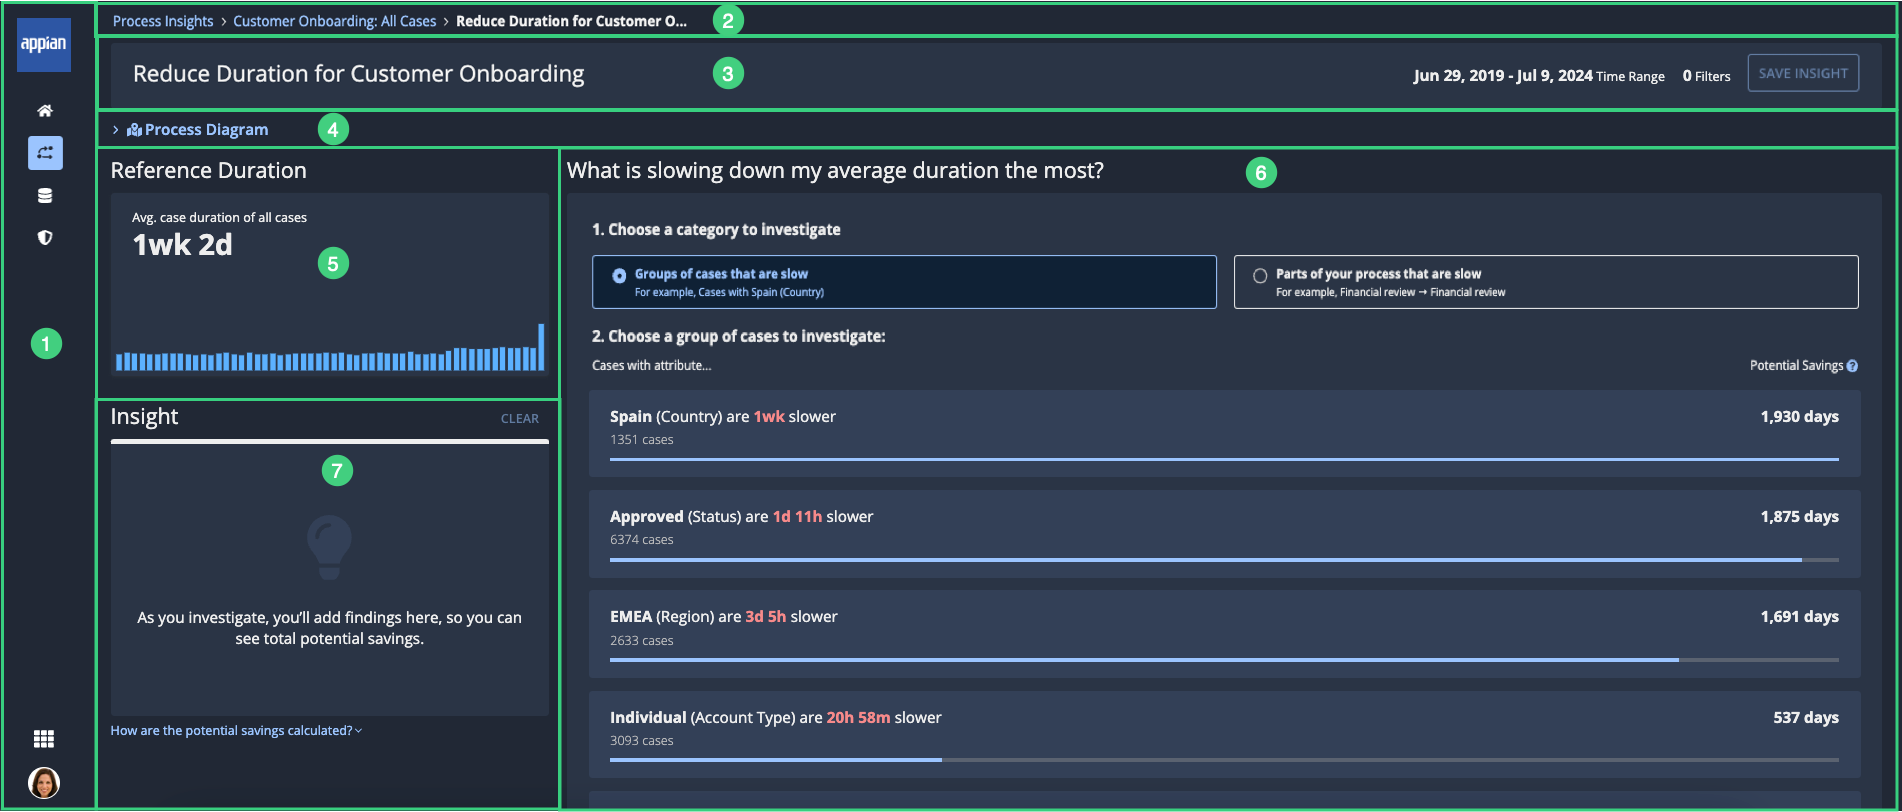
In Process HQ, the active investigation page lets you take a closer look into specific patterns and issues in your process, so you can uncover insights that lead to improvements. To access this page, start an investigation or continue a saved investigation.
ElementsCopy link to clipboard
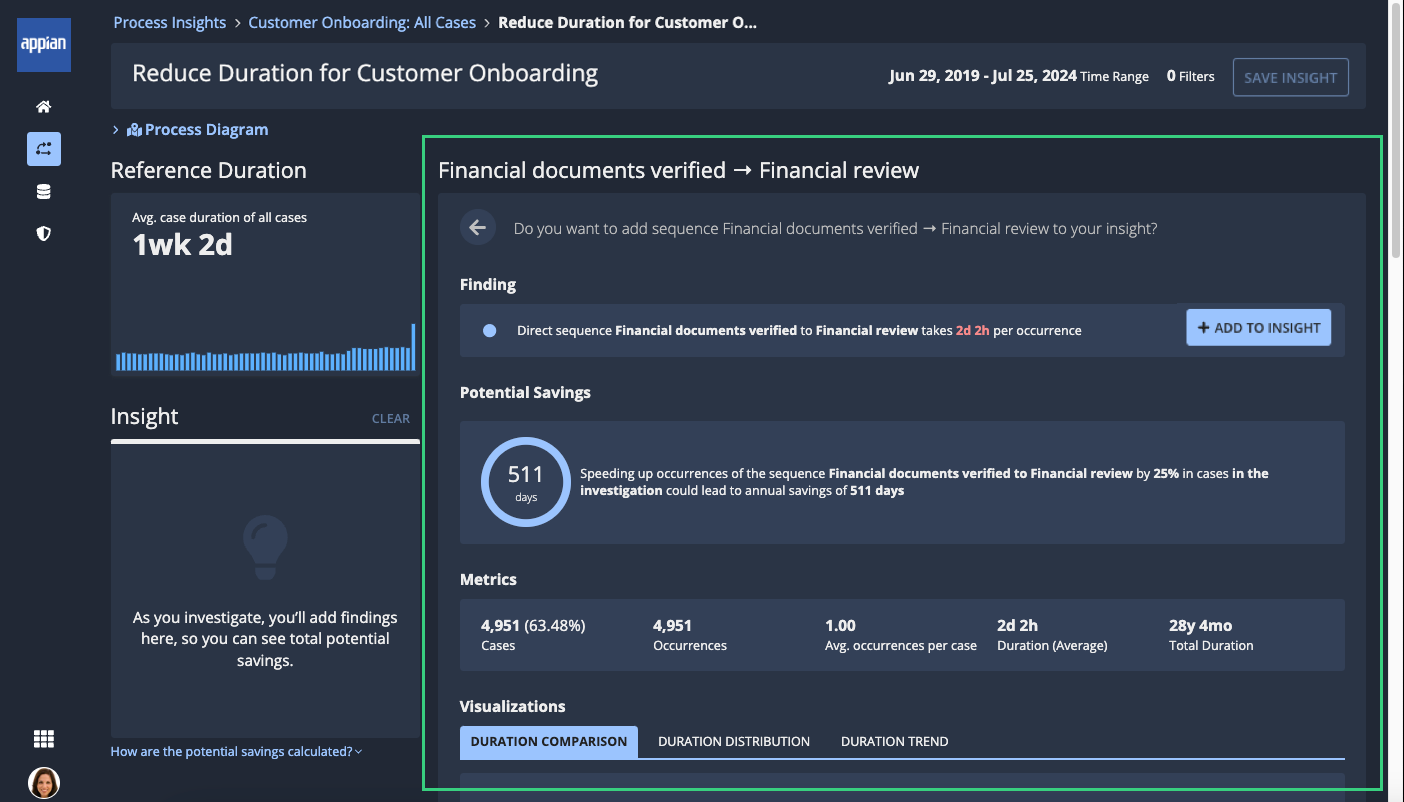
The following image highlights the elements of the active investigation page:

# |
Element |
Actions Available |
|---|---|---|
1 |
Navigation bar |
|
2 |
Breadcrumbs |
Navigate to the Process Insights page or the process view page associated with the investigation. |
3 |
Investigation header |
|
4 |
Process diagram |
Review a process diagram constructed only from cases in the investigation. The elements of this process diagram update to reflect the choices you make while building an insight. |
5 |
Reference duration |
Review a key performance indicator (KPI) focused on the average duration of cases in this process view. Process insights calculates potential savings by comparing the duration of the cases you're investigating against this average duration. The KPI also includes a trend chart representing changes in the average duration over the date range of the investigation. You can hover over the chart to see more details for each data point. Note: This value will update with each finding you add to the insight. |
6 |
Investigation pane |
Review and interact with process data. As you conduct an investigation, this pane allows you to:
|
7 |
Insight pane |
Track important findings in a tree format and view the cumulative effect of those findings on your potential savings. See the description for a full list of actions. |
Understanding the investigation displayCopy link to clipboard
During an active investigation, adding a finding to an insight is the equivalent of applying a filter to the cases you're investigating. The focus of the investigation will narrow to the context of cases affected by the finding you add. Learn more.
In addition, the type of finding included in the insight affects the unit of analysis that displays in the investigation. The following sections describe how these units of analysis are used:
Unit of analysis: casesCopy link to clipboard
If you add findings related to attribute values only, the investigation displays the analysis in terms of affected cases. For example, the attribute value details will show you the number of cases affected by the attribute value.
Cases in the attribute values list
Cases in the attribute value details
Unit of analysis: occurrencesCopy link to clipboard
If you add a finding related to a process part, the investigation displays the analysis in terms of occurrences of the process part. For example, the process part details will show you how many times a sequence occurs in cases in the investigation.
Occurrences in the process parts list

Occurrences in the process part details
Once you've added a finding related to a process part, any additional findings you review or add to the insight will display in terms of occurrences.
Occurrences in the attribute values list

Occurrences in the attribute value details
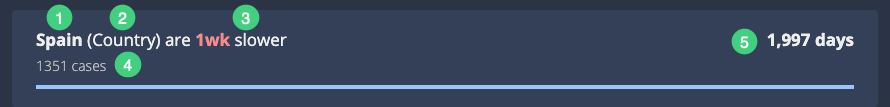
Attribute values listCopy link to clipboard
When you're investigating an attribute, you'll see a list of attribute values associated with either longer case durations or longer occurrence durations depending on the findings included in the insight.
Attribute values that have the highest potential savings are listed at the top of the list.
Each item in this list includes the following elements:
# |
Element |
Description |
|---|---|---|
1 |
Attribute Value |
The attribute value. For example, for an attribute named Country, this value would be the name of an individual country, like Spain. |
2 |
Attribute Name |
The attribute name. For example, Country. |
3 |
Difference |
How much slower the average duration of cases or occurrences with this attribute value is than the average duration of cases or occurrences without this attribute value. |
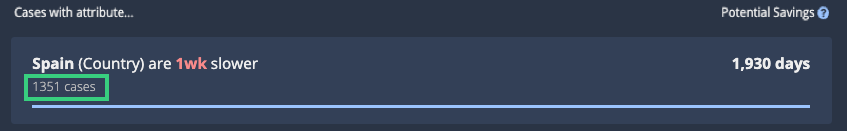
4 |
Case/occurrence count |
The number of cases or occurrences with this attribute value in this investigation. |
5 |
Potential savings |
The potential annual savings that Process HQ has calculated for cases or occurrences with this attribute value. This number represents the time you could recover each year if you could make the average duration of cases or occurrences with this attribute value match the average duration of cases or occurrences without the attribute value. |
6 |
Bar graph |
The bar graph shows how the potential savings for this attribute value compares to the potential savings for other values of this attribute. The longer the bar, the more significant the savings in comparison to other values. |
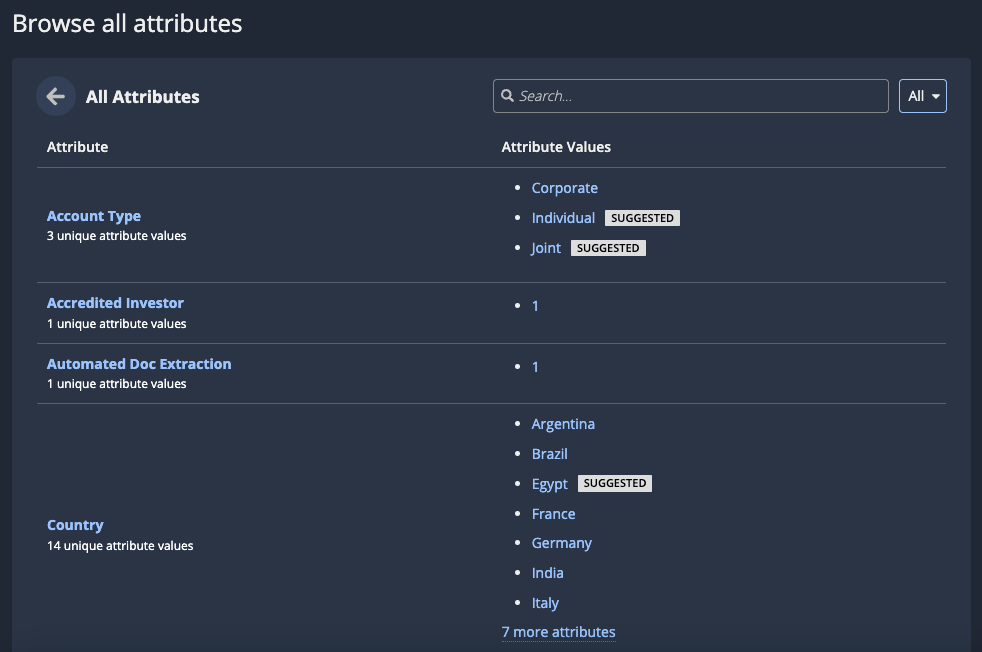
All Attributes listCopy link to clipboard
When you're investigating attributes, you'll see the attribute value list by default, which displays only those attributes that are associated with the longest case or occurrence durations.
You can switch to a list of all attributes, however. This list of all attributes can be useful if you already have an idea of an attribute you need to look into.
To view a list of all attributes of the process, click Browse All at the end of the list. The All Attributes list displays.
For example:
This table includes the following columns:
Column |
Description |
|---|---|
Attribute |
The name of the attribute, and a count of the unique values for that attribute. Click an attribute to view the Duration Comparison for the attribute's values. |
Attribute Values |
A list of values for that attribute in the cases in the investigation. The SUGGESTED tag displays next to attribute values associated with the longest case or occurrence durations. Click an attribute value to view the attribute value details. |
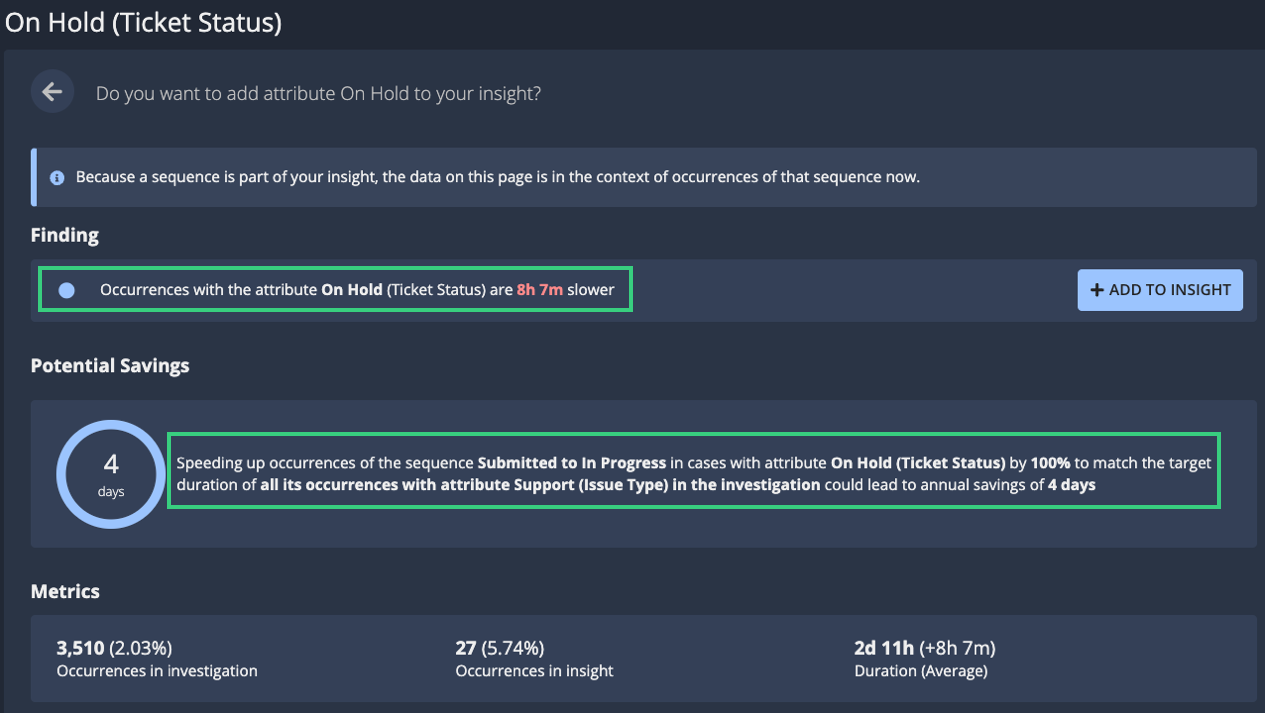
Attribute value detailsCopy link to clipboard
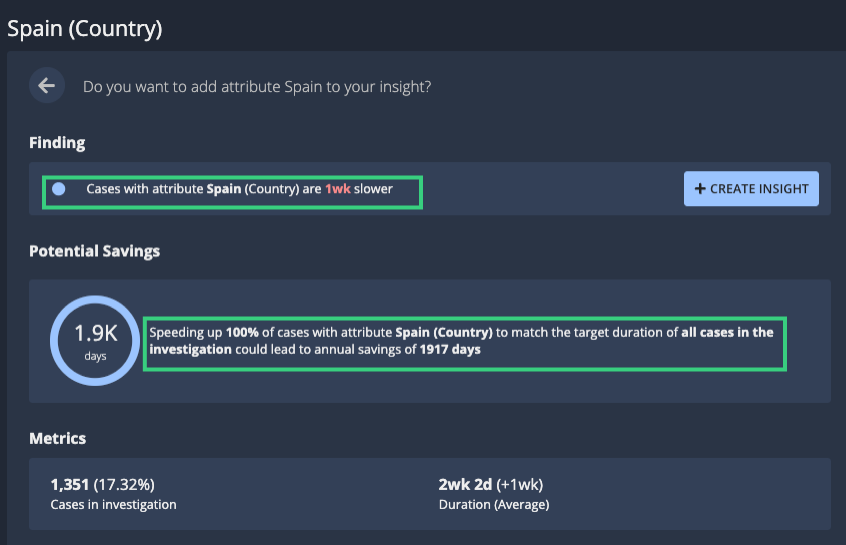
When you click on an attribute value in the attribute value list or all attributes list, the investigation displays a detailed analysis of that attribute value.
For example:
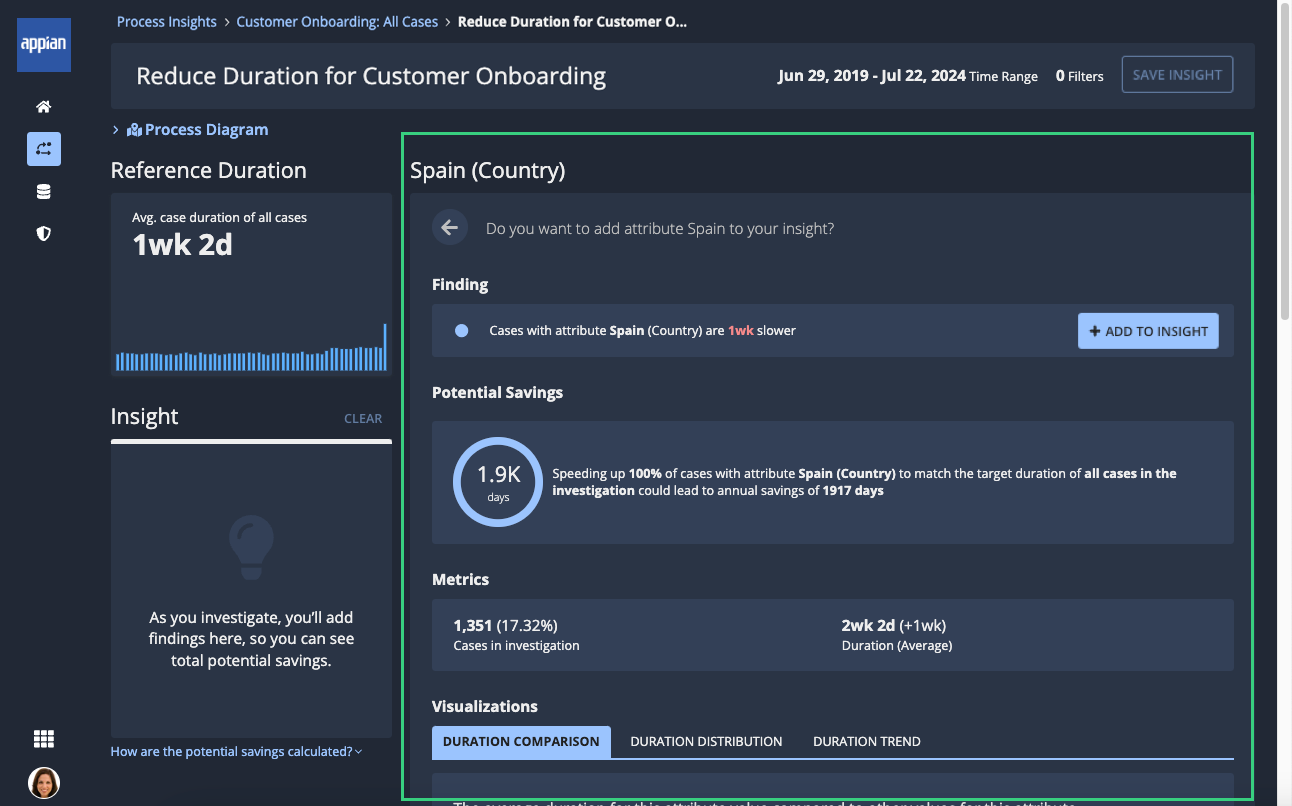
Attribute value details include the following elements:
- Finding: A sentence describing how much slower cases or occurrences with the attribute value are than cases or occurrences without the attribute value. To share this finding with others, click ADD TO INSIGHT.
- Potential Savings: The number of days you could save per year if you reduce the duration of all cases or occurrences with this attribute value to the average duration of cases or occurrences in this investigation.
-
Metrics: Relevant statistics for this attribute value:
Metric
Description
Cases/Occurrences in investigation
A two-part value specifying (1) the total number of cases or occurrences with this attribute value in the investigation, and (2) what percent of total cases or occurrences in the investigation is represented by cases or occurrences with this attribute.
Cases/Occurrences in insight
A two-part value specifying (1) the total number of cases or occurrences with this attribute value in the insight, and (2) what percent of total cases or occurrences in the insight is represented by cases or occurrences with this attribute.
Duration (Average)
The average duration of cases or occurrences with this attribute value in this investigation.
- Visualizations: Charts displaying relevant statistics in relation to each other:
- Cases: A list of cases with this attribute value in this investigation.
Process parts listCopy link to clipboard
When you switch to investigating parts of a process, you'll be presented with a list of the sequences, repetitions, and activities that occur in the cases you're investigating. Those parts of the process that are associated with the longest durations appear at the top of the list.
Each item in the list includes the following elements:

# |
Element |
Description |
|---|---|---|
1 |
Name |
The name of this part of the process. For activities, this element displays as a single name. For sequences and repetitions, this element displays in the following format: <start activity> <end activity>. |
2 |
Duration |
How long (on average) this part of the process takes when it occurs in the cases you're investigating. |
3 |
Potential savings |
The potential annual savings that Process HQ has calculated for occurrences of this part of the process. This number represents the time you could recover each year if you improve the average duration of this part of the process. Learn more about the potential savings calculation. |
4 |
Occurrence count |
A count of how often this part of the process occurs in cases in the investigation. |
5 |
Part |
A tag identifying the part of the process. Values include: |
6 |
Potential savings comparison |
A bar graph showing how the potential savings for this process part compares to the potential savings for other parts of this process. The longer the bar, the more significant the savings in comparison to other parts of the process. |
Process part detailsCopy link to clipboard
To view the details of Process HQ's analysis of each part of a process, click that process part in the following locations:
Location |
Sequence |
Repetition |
Activity |
|---|---|---|---|
In the process diagram on the Summary tab of a process view |
|||
In the process parts list of an active investigation |
For example:
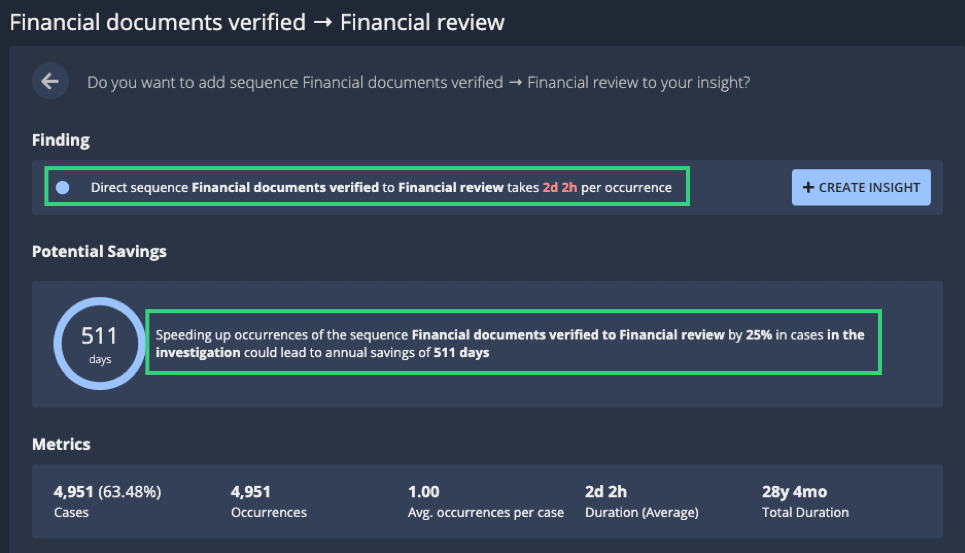
Process part details include the following elements:
- Finding: A sentence describing how much slower cases that include the process part are than cases without that process part. To see additional analysis about cases that include this process part, click ADD TO INSIGHT.
- Potential Savings: The number of days you could save per year if you reduce the duration of this part of the process.
-
Metrics: Relevant statistics for this part of the process:
Metric
Description
Cases
The total number of cases that include this part, along with the percentage of cases in this investigation that those cases represent.
Occurrences
The total number of times the part occurs in the cases you're investigating.
Avg. Occurrences
The average number of times the part occurs in each case you're investigating.
Duration (Average)
The average duration of this part when it occurs in the cases you're investigating.
Total Duration
The total duration of all occurrences of this part in the cases you're investigating.
- Visualizations: Charts displaying relevant statistics in relation to each other:
- Cases: A list of cases in this investigation that include this process part.
VisualizationsCopy link to clipboard
The following sections describe the visualizations included in attribute value details and process part details.
Duration ComparisonCopy link to clipboard
The elements in this visualization vary depending on whether your insight includes a finding related to an attribute value, a finding related to a process part, or a combination of the two.
Attribute valueCopy link to clipboard
This chart compares the selected attribute value to other values of the attribute in the current investigation. The chart compares either cases or occurrences with this attribute depending on the findings you've added to the insight.
For example:
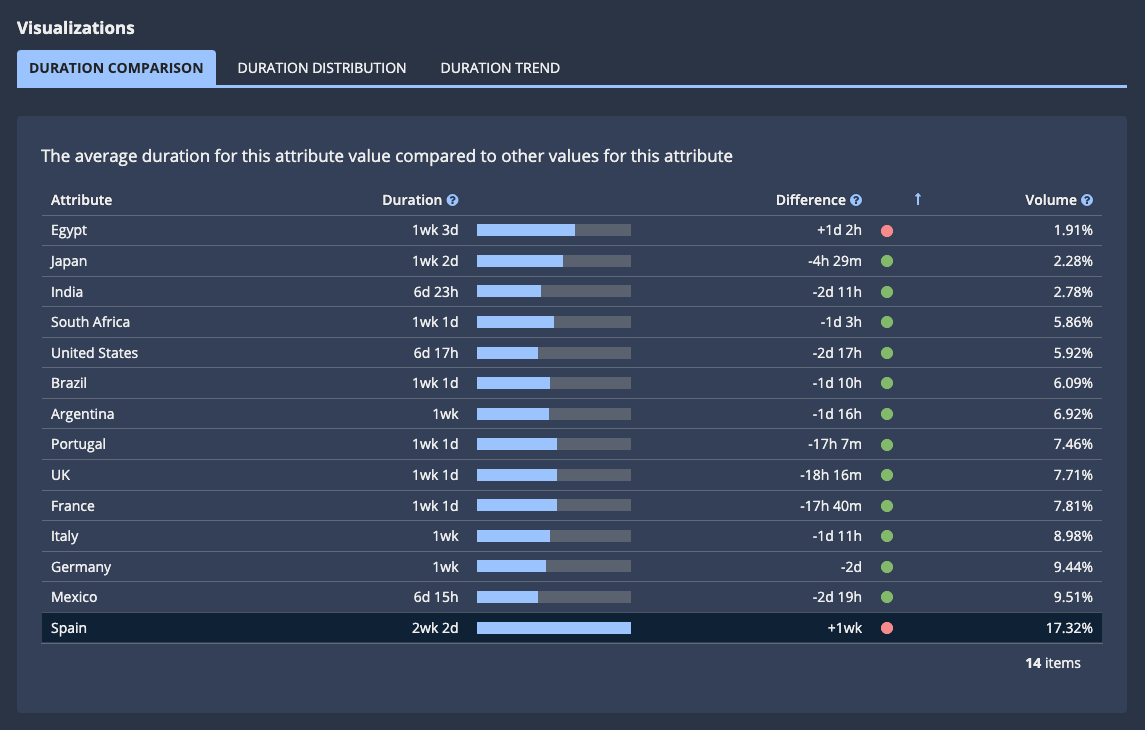
This table contains the following columns:
Column |
Description |
|---|---|
Attribute |
An attribute value. |
Duration |
The average duration of cases or occurrences with this attribute value in this insight. |
Difference |
The difference between the average duration of cases or occurrences with this attribute value and the average duration of cases or occurrences with all other values of this attribute. |
Volume |
The percentage of total cases or occurrences in the investigation that have this attribute value. Hover to see case or occurrence counts. |
Process partCopy link to clipboard
If you're investigating a sequence or repetition, this chart compares the sequence or repetition to other sequences in the current investigation. If you're investigating an activity, this chart compares the activity to other activities in the current investigation.
If your insight includes a finding related to an attribute value, this chart narrow down to show only those process parts that have that attribute value. For example, the chart will compare a sequence with the selected attribute value to other sequences with that attribute value.
For example:
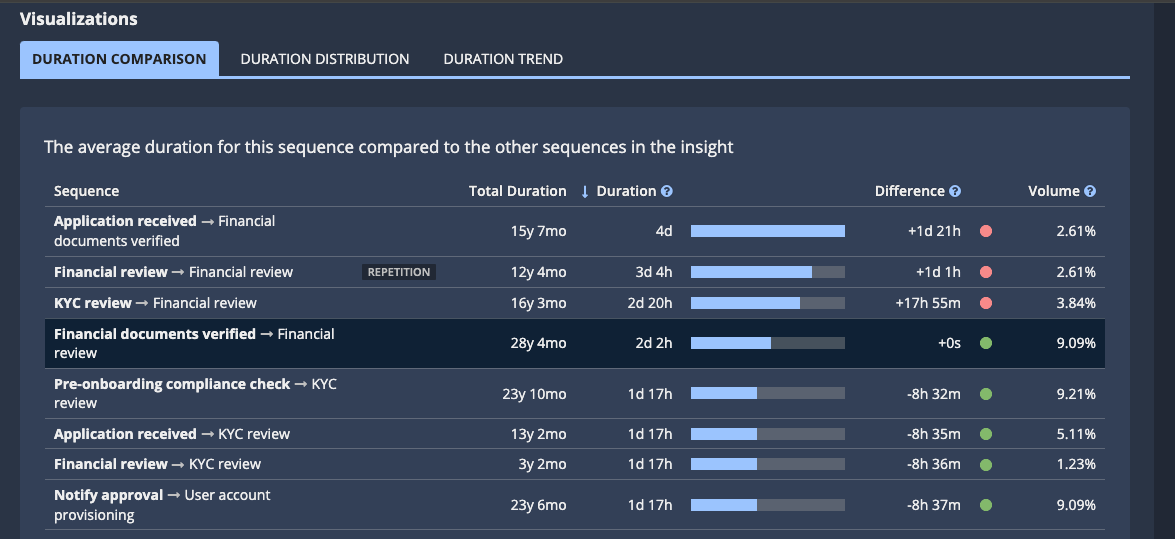
This table contains the following columns:
Column |
Description |
|---|---|
|
Sequence |
The name of this part of the process. For activities, this appears as a single name. For sequences and repetitions, this appears in the following format: <start activity> <end activity>. |
|
Total Duration |
The total duration of all occurrences of this sequence or repetition in cases in this investigation. This column is not present for activities. |
Duration |
The average duration of the process part in the cases you're investigating. |
Difference |
The difference between the average duration of this process part and the average duration of other process parts in the current investigation. |
Volume |
The percentage of occurrences of the process part in this insight. Hover to see the occurrence counts. |
Duration DistributionCopy link to clipboard
The elements in this visualization vary depending on whether your insight includes a finding related to an attribute value, a finding related to a process part, or a combination of the two.
Attribute valueCopy link to clipboard
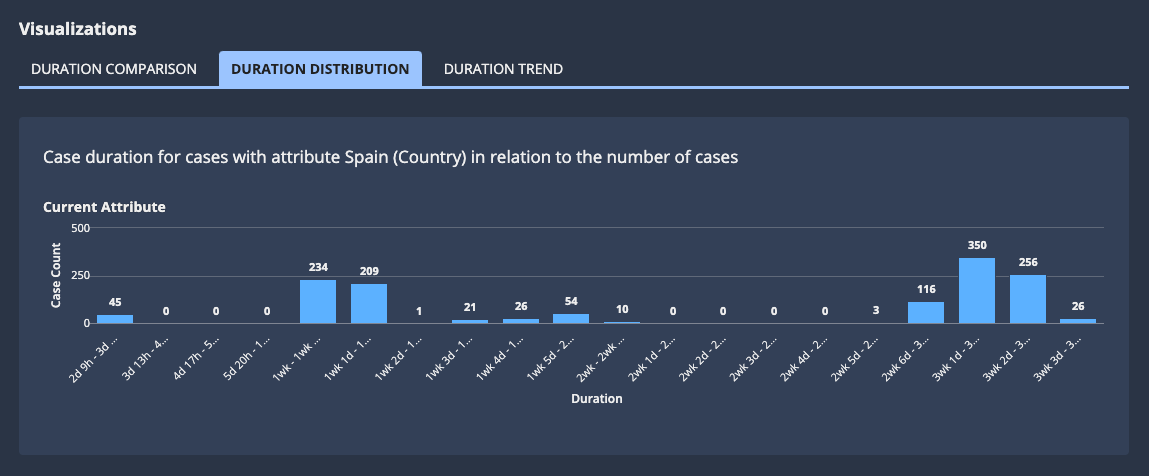
This chart displays how long cases or occurrences with this attribute take on average (Duration) in relation to the number of cases or occurrences with the attribute value (Case Count).
If your insight includes a finding related to a process part, this chart reflects that context. For example, the chart displays how long occurrences of a selected sequence with this attribute value take on average in relation to all other sequence occurrences with that attribute value.
You can use this chart to identify the duration with the highest number of cases or occurrences, so you can investigate further.
For example:
Process partCopy link to clipboard
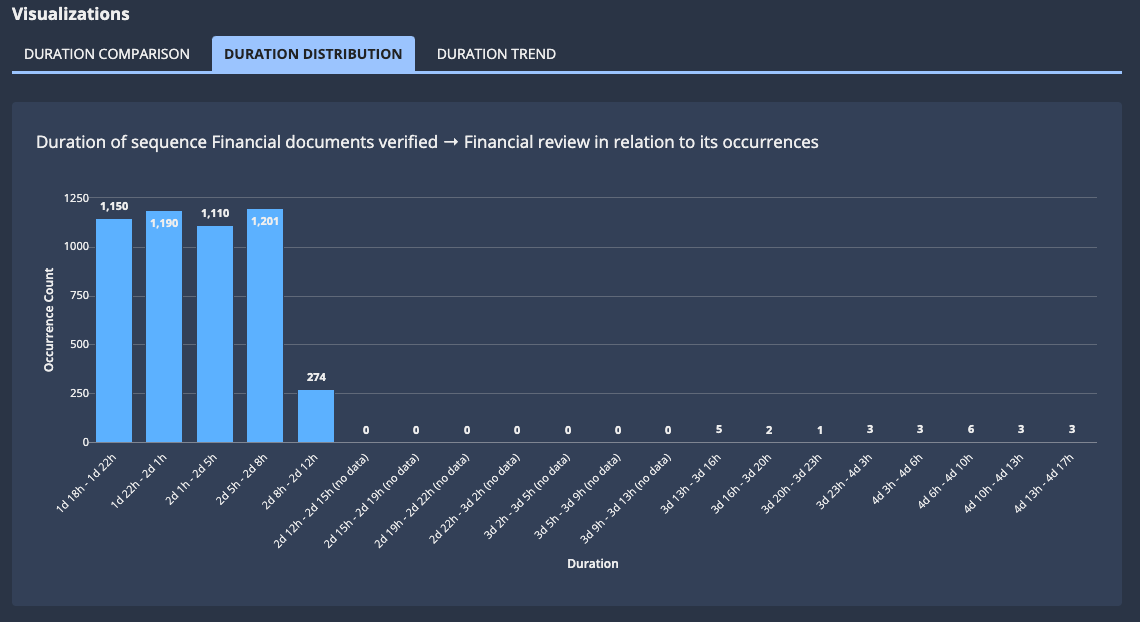
This chart displays how long occurrences of the process part take on average (Duration) in relation to how many times the process part occurs (Occurrence Count).
If your insight includes a finding related to an attribute value, this chart narrow down to show only those process parts that have that attribute value. For example, the chart displays how long occurrences of a selected sequence with this attribute value take on average in relation to all other sequence occurrences with that attribute value.
You can use this chart to identify the duration with the highest number of occurrences, so you can investigate further.
For example:
Duration TrendCopy link to clipboard
The elements in this visualization vary depending on whether your insight includes a finding related to an attribute value, a finding related to a process part, or a combination of the two.
Attribute valueCopy link to clipboard
This chart displays how long cases or occurrences with the attribute value have taken over time (Duration) in relation to the number of cases or occurrences with the attribute value (Volume).
You can use this chart to identify increases in duration over time, so you can further investigate other attributes associated with those specific dates.
For example:
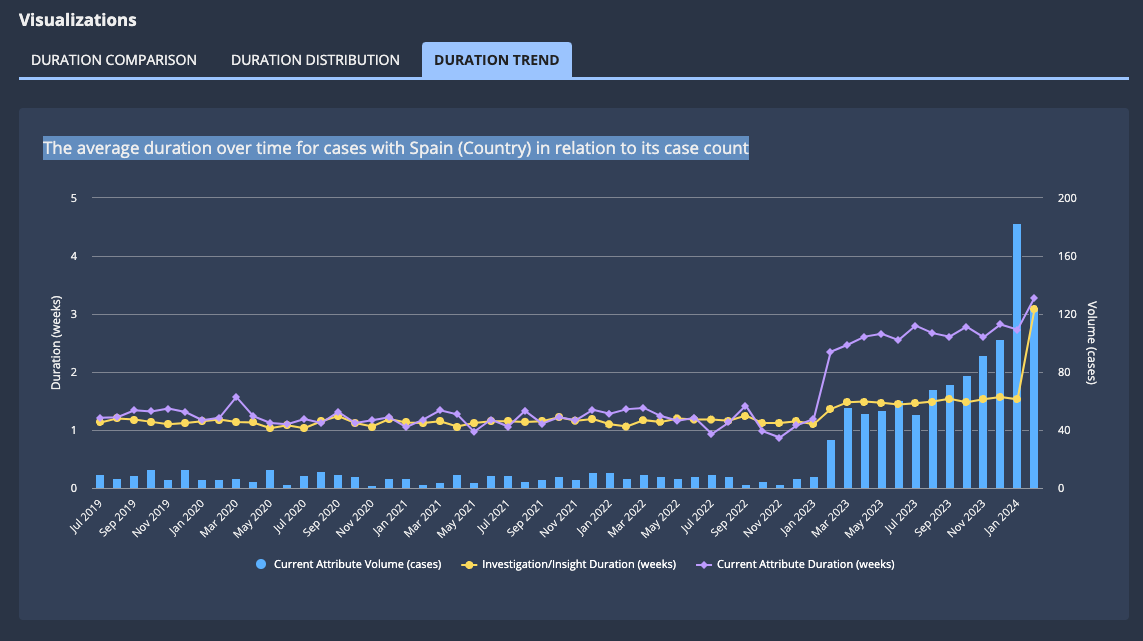
When evaluating this chart, keep in mind the following:
- An increase in average duration at the same time as an increase in case or occurrence counts might indicate that the team handling the work needs additional resources.
- An increase in average duration without an increase in case or occurrence counts might indicate that the process itself needs refinement.
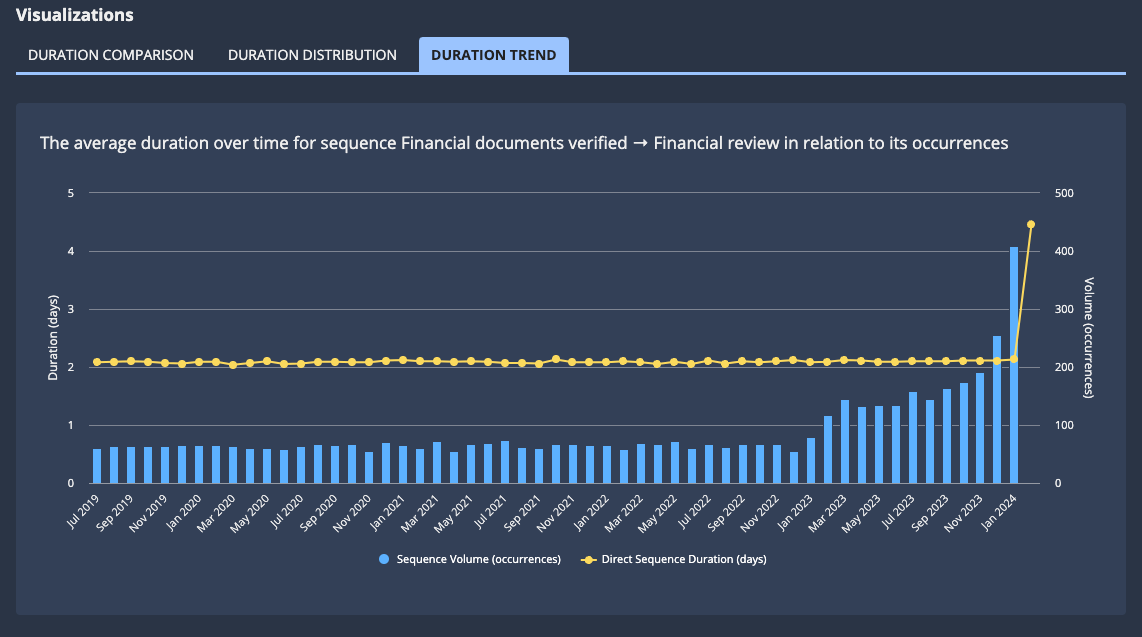
Process partCopy link to clipboard
This chart displays how long occurrences of the process part have taken over time (Duration) in relation to how many times the process part occurs (Volume (occurrences)).
If your insight includes a finding related to an attribute value, this chart narrow down to show only those process parts that have that attribute value. For example, the chart displays how long occurrences of a selected sequence with the attribute value have taken over time in relation to how many times the selected sequence with the attribute value has occurred.
You can use this chart to identify increases in durations over time, so you can further investigate other attributes associated with those specific dates.
For example:
CasesCopy link to clipboard
This list displays all cases with the selected attribute value or process part.
For example:
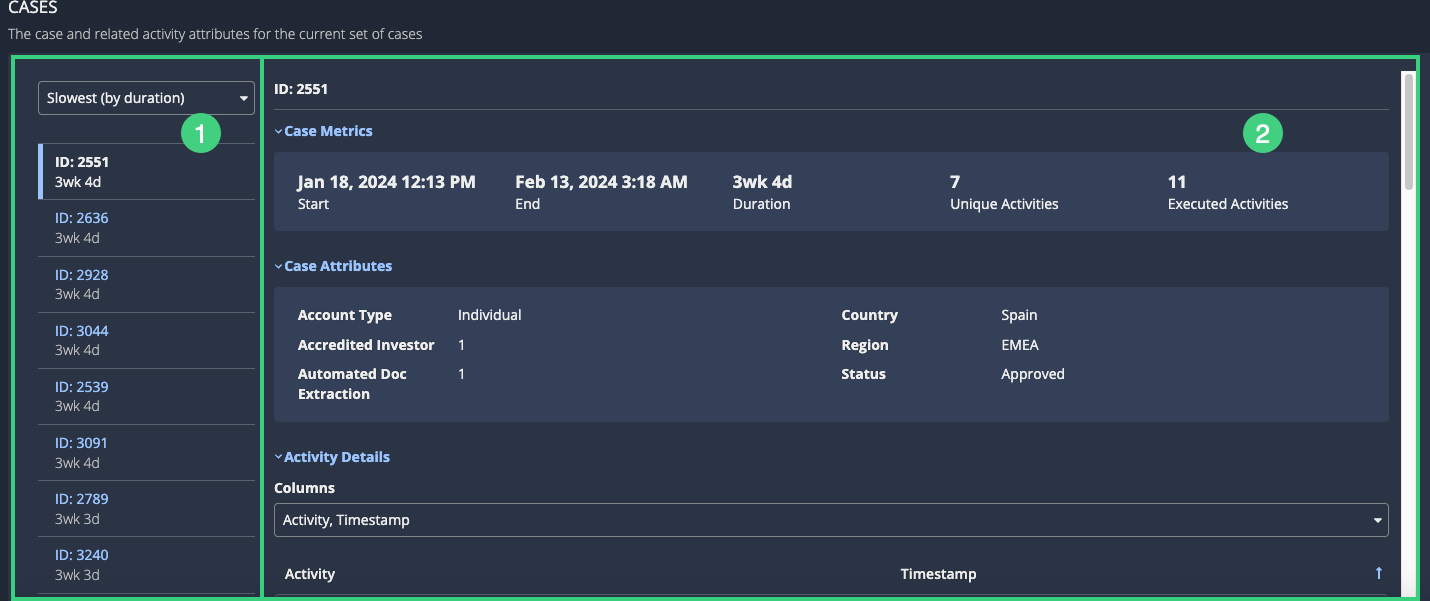
This section contains the following elements:
# |
Element |
Actions Available |
|---|---|---|
1 |
Case list |
|
2 |
Case details pane |
Review details about the selected case:
|
Next StepsCopy link to clipboard
As you add findings to your insight, you can use the steps below to continue your investigation:
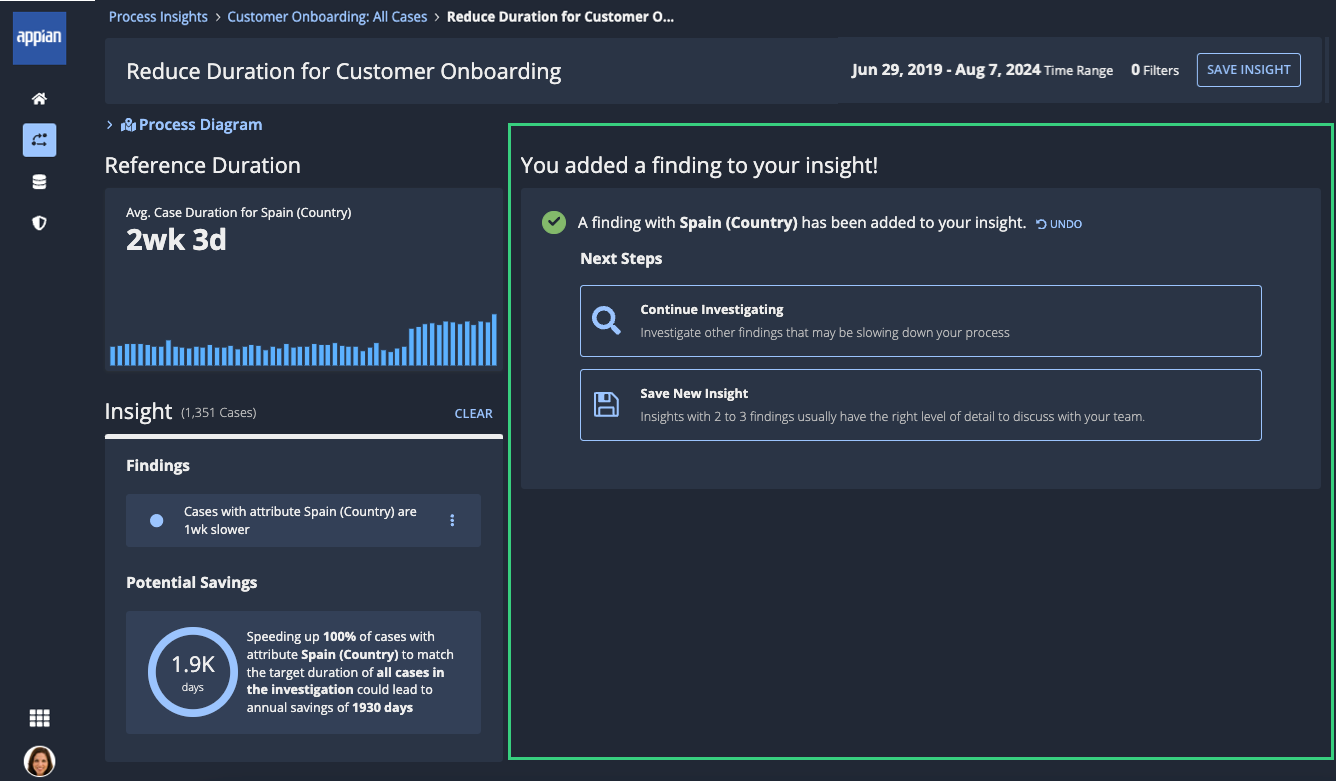
Step |
Description |
|---|---|
Continue Investigating |
Click this step to review additional findings that may be slowing down the cases in your insight. |
Save New Insight |
Click this step to save the current findings as a new insight. Insights with 2 to 3 findings usually have the right level of detail to discuss with your team. |
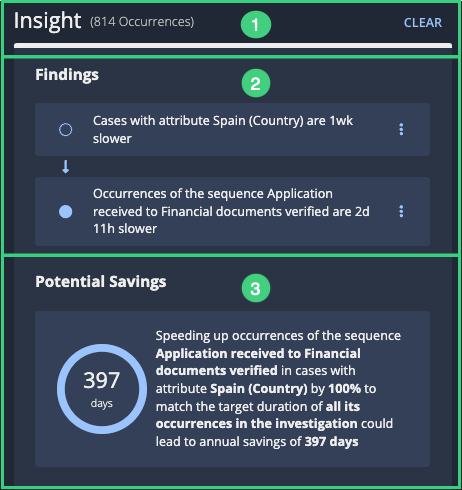
Insight paneCopy link to clipboard
As you add individual findings to an insight, the Insight pane displays those findings in a hierarchical format to represent the cumulative filtering of cases in the insight.
The following image highlights the elements of the Insight pane:
# |
Element |
Actions Available |
|---|---|---|
1 |
Header |
|
2 |
Findings section |
|
3 |
Potential Savings section |
View the potential savings calculated for the combined findings in the insight. |