This page applies to business users. It describes how to gain a deeper understanding of an individual business process.
OverviewCopy link to clipboard
In Process HQ, exploring a process helps you get familiar with how the process actually operates before you start an investigation into specific patterns and issues in the workflow.
To start exploring, simply click the name of the process in the process list.
Business processes can be complex, so we present you with high-level discoveries first.
Review key performance indicators (KPIs)Copy link to clipboard
A key performance indicator (KPI) allows you to track a specific aspect of your process to measure success. A KPI can enable you to tell, at a glance, if a process is performing to your expectations.
In the Summary tab of a process view, you can review the following default KPIs:
You can also add custom KPIs and pin them to the Summary tab of a view. Learn more about custom KPIs.
-
Total Cases: The number of cases in this view that occur in the selected date range, plus the percentage those cases represent of total cases for the view and selected date range.
-
Average Case Duration: The average duration of cases in this view that occur in the selected date range.
-
Median Case Duration: The median duration of cases in this view that occur in the selected date range.
-
Unique Activities: The number of unique activities in this view that occur in the selected date range.
Review the process diagramCopy link to clipboard
The PROCESS DIAGRAM section of the Summary tab allows you to see how the process actually operates. This tool allows you to understand the standard flow of your process and, importantly, identify where the process occurs in atypical or alternative ways.
The process diagram is composed of the following elements:
- Activities are the actions that occur in your business process such as order received or make payment. An activity is represented by a node in the diagram. A count of activity occurrences displays above each node.
- Sequences are the unique flow from one activity to the next in the business process. Collectively, all sequences in the process represent the execution of the process from start to finish. A sequence is represented by a connector in the diagram. A count of sequence occurrences and the average duration of the sequence display on each connector.
The size of activity nodes and the connectors between them represent how frequently the activity occurred. This helps you quickly see how often activities occur in relation to one another.
For example:
- Activity Frequency: If one activity occurs 200 times and another occurs 100 times, the radius of the activity node that occurs 200 times is twice as large as the radius of the activity node that occurs 100 times.
- Sequence Frequency: If 500 cases follow the sequence between one activity node and another, the connector for that sequence is 5 times thicker than a connector that only 100 cases follow.
In addition, the color of the connectors represents the average duration of the activity based on minimum and maximum values in the process data. For example, connectors with an average duration closer to the minimum are blue, and connectors with an average duration closer to the maximum are red.
The process diagram can be very complex for certain processes, so you can progressively show more detail.
Overview displays only the most common activities and sequences in your business process. For example:
As you navigate from Basic through Advanced, the diagram includes more sequences where activities were skipped, looped, or repeated.
Full displays all sequences in your business process. For example:
By default, the Basic version of the diagram is active when you open a process view.
Review case attributesCopy link to clipboard
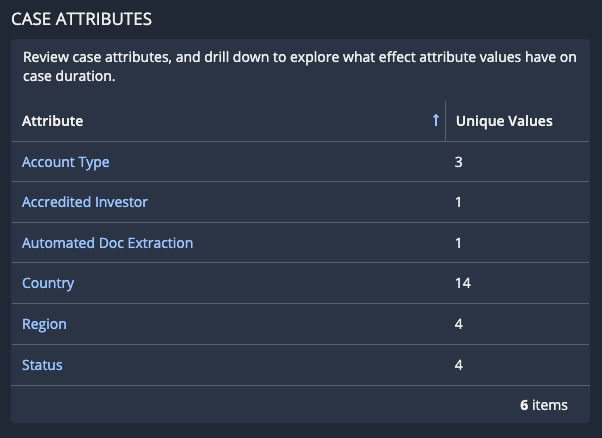
The CASE ATTRIBUTES section of the Summary tab lists attributes for cases in this view in the selected date range.
For example:
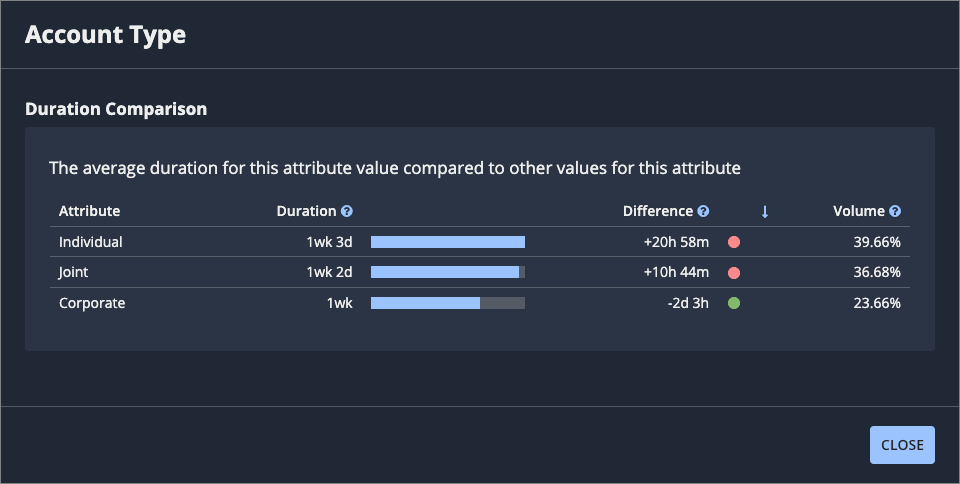
Click an attribute name to see the values for that attribute.
For example:
In this example, individual accounts are taking longer to process than corporate accounts. This difference in duration might lead you to create a new view or start an investigation to focus on individual accounts.
Review case count and duration over timeCopy link to clipboard
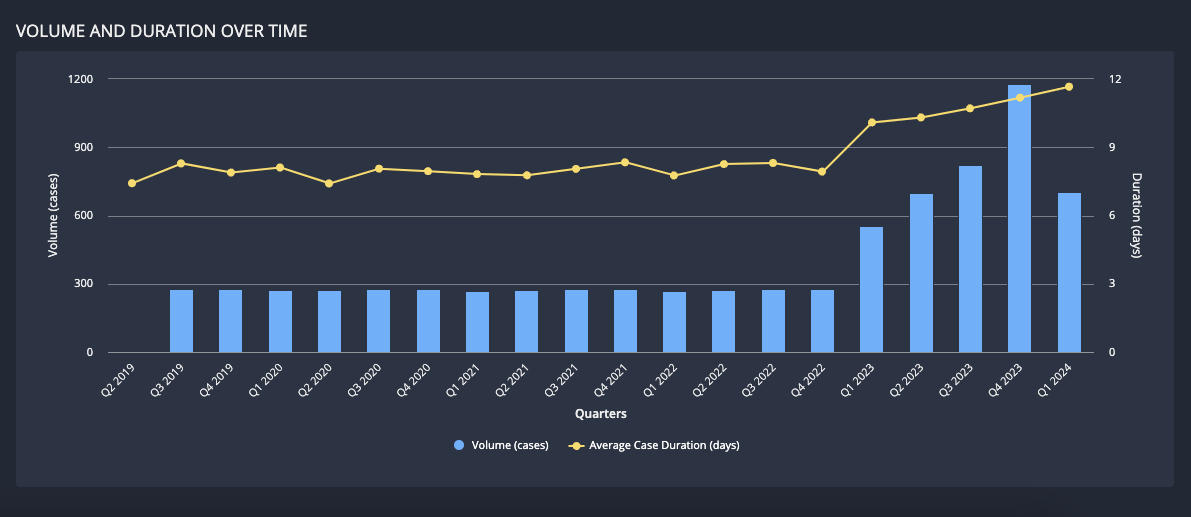
In the Summary tab, the CASE COUNT AND DURATION OVER TIME chart spotlights increases and decreases in case duration over time, in relation to the total number of cases in this view for the selected date range.
Look for increases in duration on this chart to identify periods of time you might want to investigate further.
View the case listCopy link to clipboard
To view a list of cases in a process view, go to the CASE LIST tab.
For example:
The case list consists of the following standard columns:
Column |
Description |
|---|---|
Case Id |
The unique identifier of the case. |
Start |
The timestamp of the first activity in the case. |
End |
The timestamp of the last activity in the case. |
Duration |
The time the case took to complete; that is, the length of time between the first activity in the case and the last activity in the case. |
Total Activity Duration |
The total time spent completing activities in this case. This value is only available if your event data includes a start timestamp and an end timestamp. Otherwise, this value cannot be calculated and appears as zero. |
Total Sequence Duration |
The total amount of process time spent moving between activities. For example, in a Customer Onboarding process, this total would include the time spent between the end of one activity (a Know Your Customer review) and the start of the next activity (Financial Document Verification). This value can only be meaningfully calculated if your event data includes a start timestamp and an end timestamp. Otherwise, this value is equal to the case duration. |
Additional columns appear in the list for each attribute included in the process.
Review custom KPIsCopy link to clipboard
To view all custom KPIs, go to the KPIs tab of the view.
Learn more about managing custom KPIs.
Review investigationsCopy link to clipboard
To view investigations associated with the view, go to the INVESTIGATIONS tab.


