
This page applies to business users. It describes how to configure strategic process metrics for an executive-level audience in a process view.
Note: To configure and present executive metrics in a process view, you must have Analyst permissions for the process.
OverviewCopy link to clipboard
Process insights allows you to easily access a detailed analysis of your process data, so you can explore your process and identify insights that ultimately lead to process improvements. That's why, when you open the process view, the Summary tab presents you with a rich display of key performance indicators (KPIs), charts, and summary lists. There's a lot there to get you digging deeper!
However, that level of analytical detail isn't always useful when you're presenting to the decision-makers in your organization. To make those presentations easier, you can configure an executive dashboard for each process and add important business context to the KPIs most relevant to your executive stakeholders.
To view the executive dashboard, go to a process view, then go to the Executive Dashboard tab.
This tab consists of the following sections:
KPIsCopy link to clipboard
The KPIs section of the Executive Dashboard tab contains KPIs that are likely to have strategic value to your organization.
For example:


This section provides the following KPIs:
KPI |
Description |
|---|---|
Average Case Duration |
How long (on average) cases in this view take. |
Total Cost |
The total cost of all activities in the view. This KPI is empty until you define the activity costs for the process. |
Error Rate |
The percentage of errors for all activities in the view. This KPI is empty until you define the activity errors for the process. |
Automation Rate |
The percentage of activities in this view that were performed by an automation. This calculation is based on the number of events with an Automation attributes. |
ActivitiesCopy link to clipboard
The ACTIVITIES section displays statistics for each activity in the process view.
This section has a grid display and a chart display.
Grid displayCopy link to clipboard
The grid display consists of a list of activities and activity-related statistics.
For example:
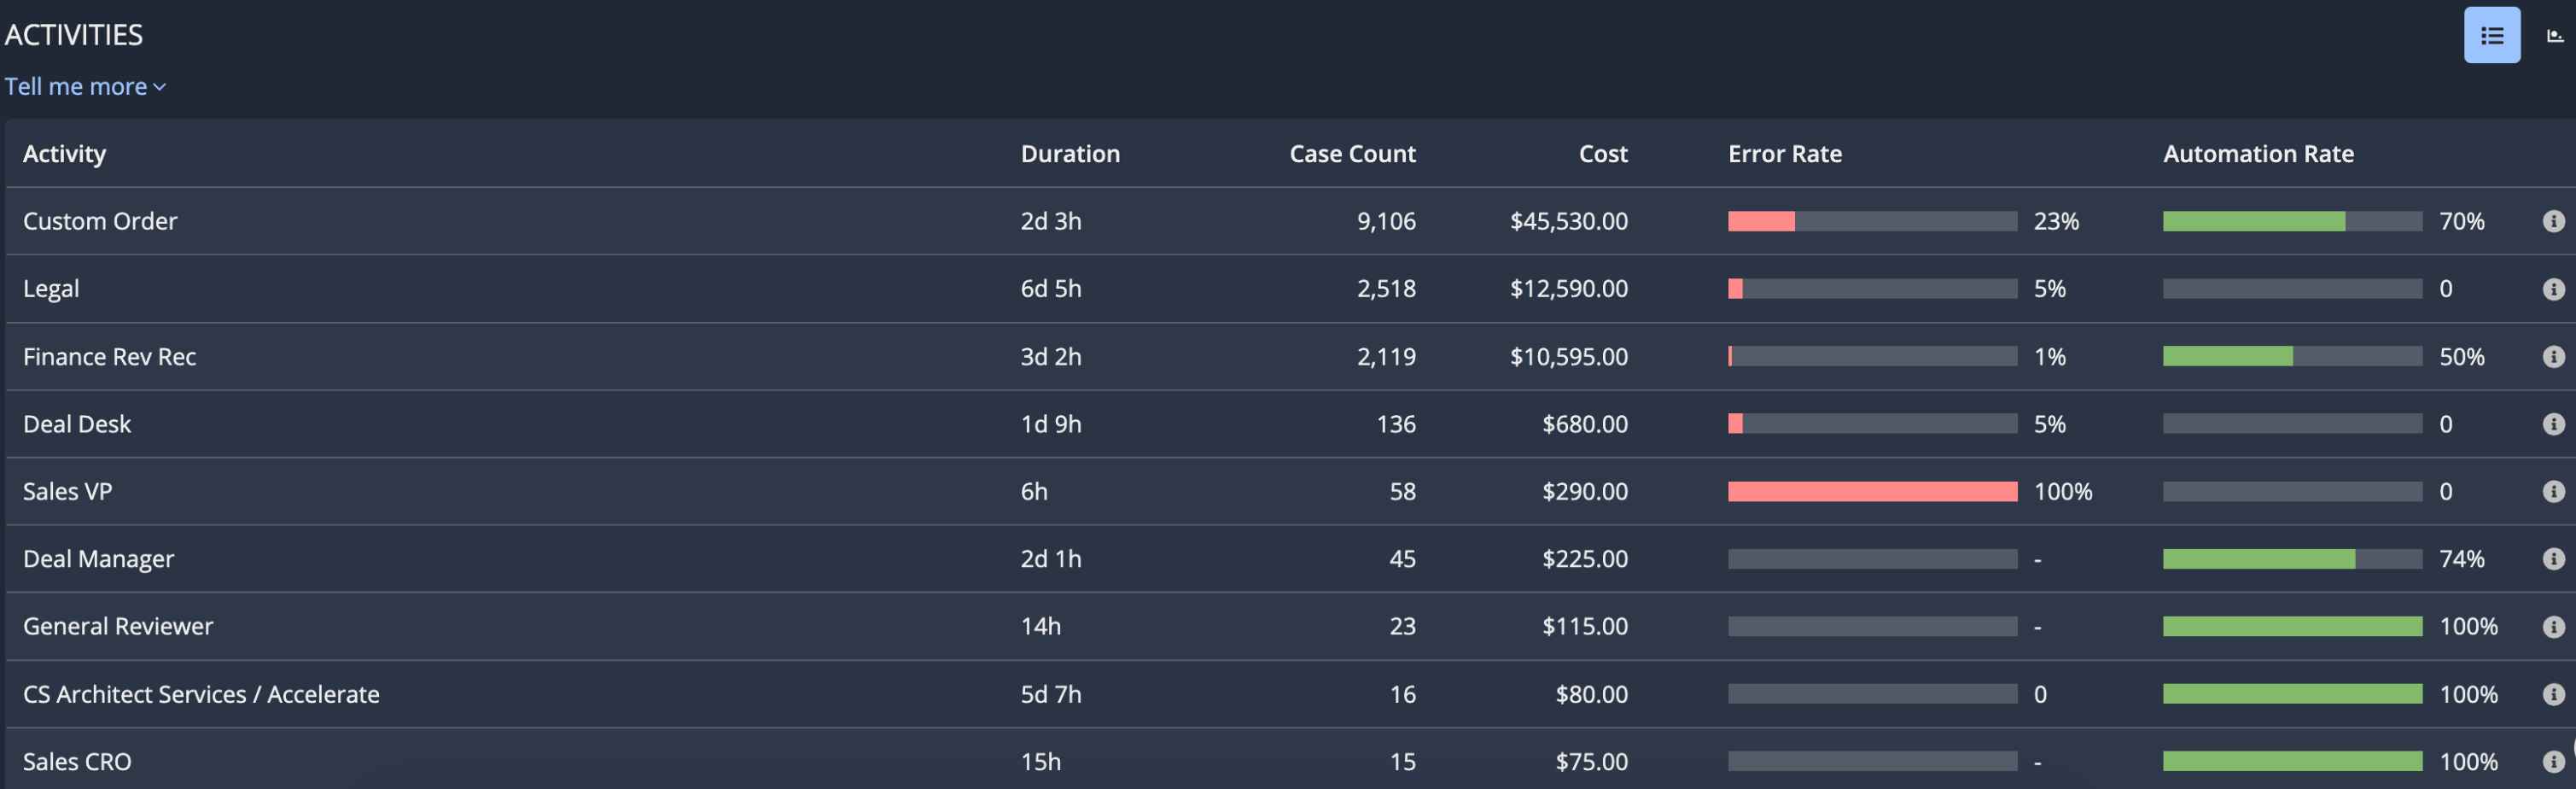
The ACTIVITIES grid contains the following columns:
Column |
Description |
|---|---|
Activity |
The activity for which the statistics are calculated. An activity is the action that occurs in your business process. |
Duration |
How long (on average) the activity takes when it occurs in cases in this view. |
Case Count |
The number of cases where the activity occurs. |
Cost |
The total cost of all occurrences of the activity. This calculation is based on the individual activity costs defined for the process. |
Error Rate |
The percentage of activities that do not follow the expected sequence order in this view. This calculation is based on the individual activity errors defined for the process. |
Automation Rate |
The percentage of activities in this view that were performed by an automation. This calculation is based on the number of events with an Automation attribute. |
Chart displayCopy link to clipboard
The bubble chart format allows you to identify activities that could benefit from improvement at a glance.
The chart displays information about the total cost of activities in relation to the percentage of activities that did not follow the expected sequence order.
The bubble chart is only available if activity costs and activity errors are defined for the process.
For example:
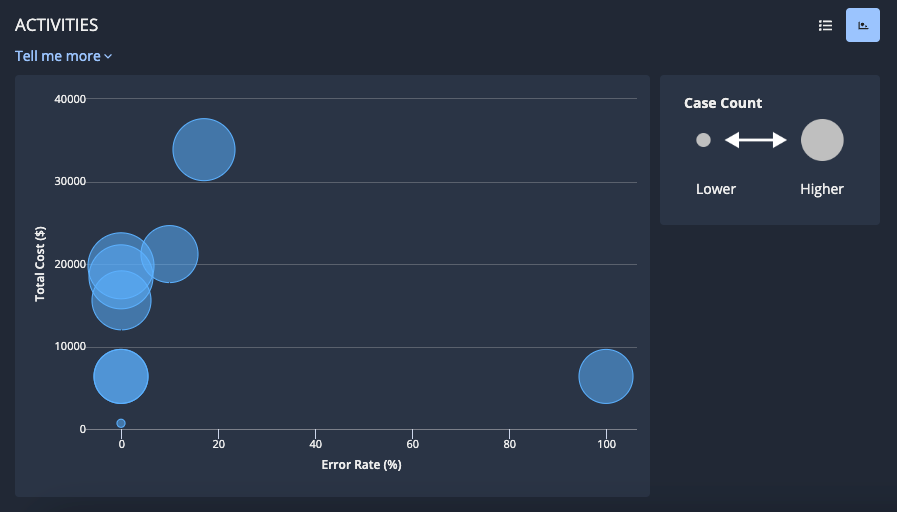
The ACTIVITIES chart contains the following elements:
- Total Cost (Y-axis): The total cost of the activity.
- Error rate (X-axis): The error rate of the activity.
- Bubble: Each bubble represents an activity. The size of the bubble reflects how often the activity occurred in all cases in this view.
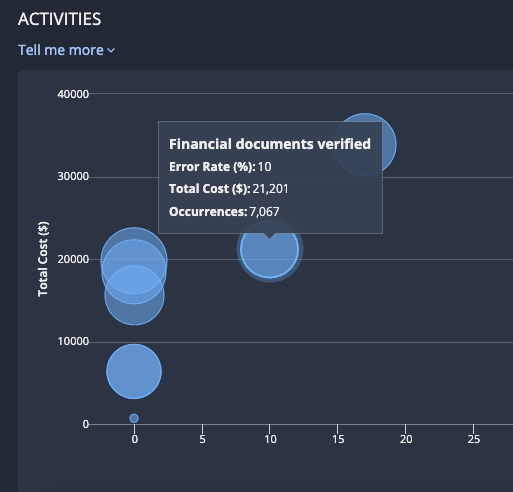
Hover over a bubble to see:
- The name of the activity.
- The error percentage of activities that do not follow the expected sequence order in this view.
- The total cost of all occurrences of this activity.
- The number of times the activity occurred in all cases in this view.
- An icon representing the automation type based on Automation Type attributes.
For example:
Toggle between displaysCopy link to clipboard
To toggle between the displays, click the icon in the top right corner of the section.
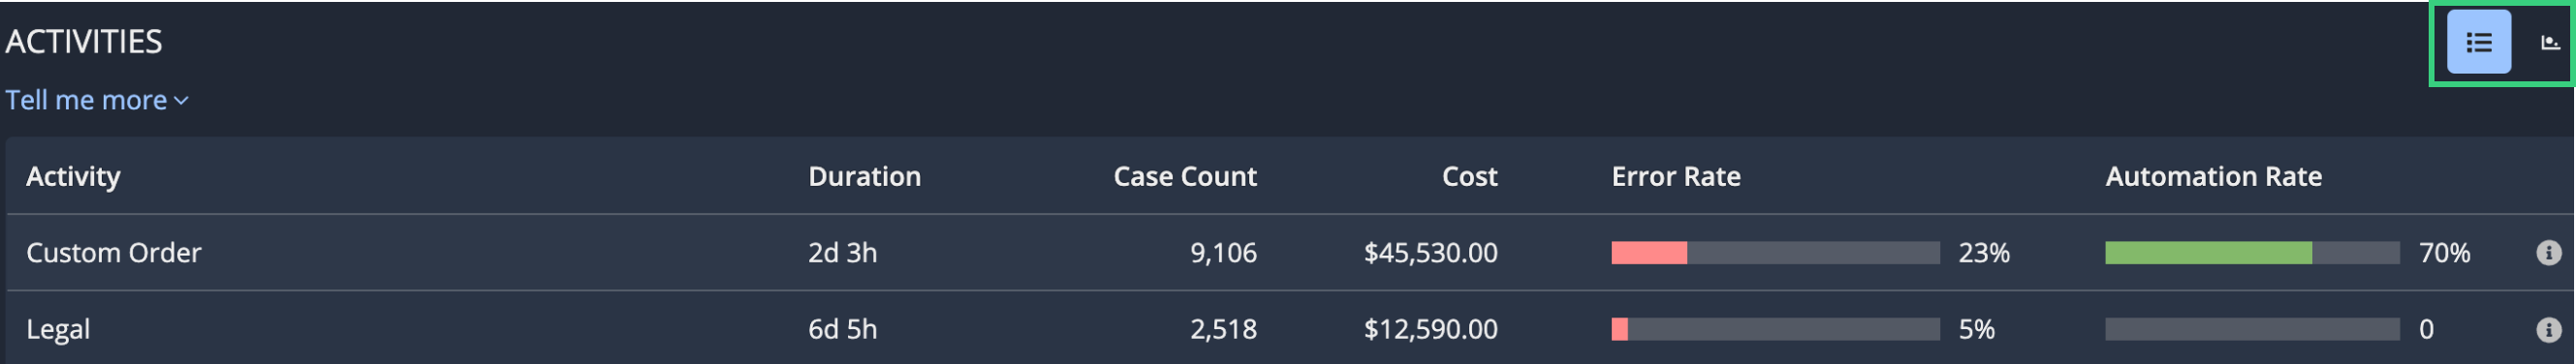
The toggle is only available if activity costs and activity errors are defined for the process.
Define activity costsCopy link to clipboard
Your organization spends money each time an activity occurs in a process. Once you've estimated what each activity costs to complete, process insights can calculate the total cost for the entire process.
You only need to define activity costs once per process. You can add or modify costs within any view associated with the process.
To define activity costs for a process:
-
In the Executive Dashboard tab, click the edit icon on the Total Cost KPI. The Define Activity Costs dialog displays.
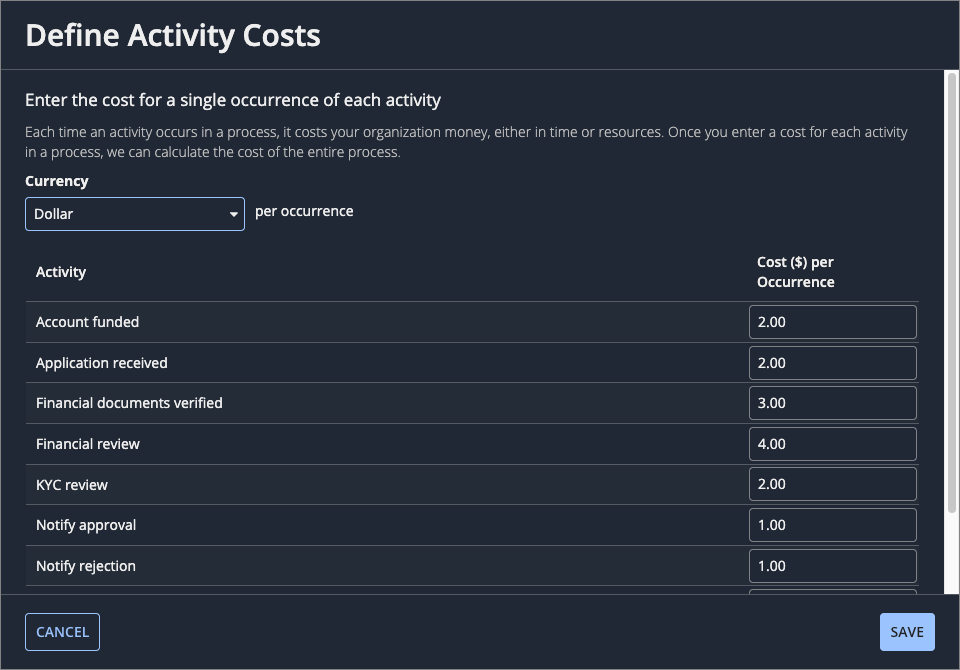
This dialog lists each activity that occurs in cases in the current view.
- From the Currency dropdown, select the currency to use when displaying costs.
- For each activity listed, enter an estimated cost.
- Click SAVE.
Define activity errorsCopy link to clipboard
The order in which activities occur can lead to the best outcome for your process—or the worst. For example, repetitions of an activity can signal rework. To identify these undesirable business outcomes, process insights lets you define which sequences of activities represent an error in the process. Once you've defined what errors look like in your process, process insights can calculate the rate at which those errors occur in the process.
You only need to define activity errors once per process. You can add or modify errors within any view associated with the process.
To define activity errors:
-
In the Executive Dashboard tab, click the edit icon on the Error Rate KPI. The Define Activity Errors dialog displays.
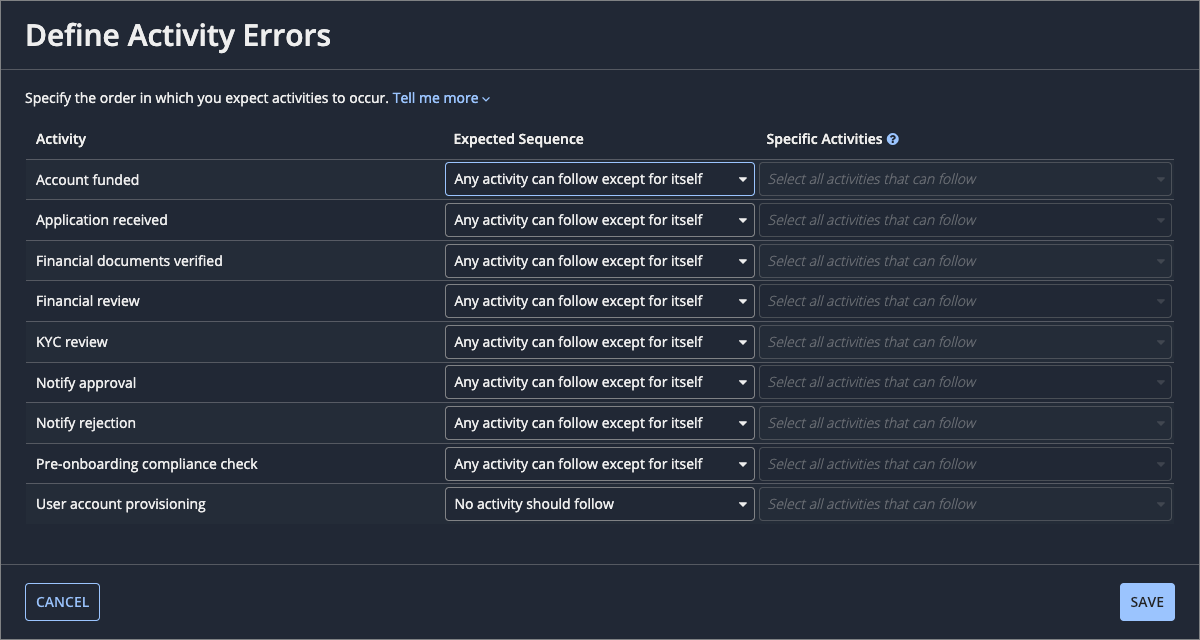
This dialog lists each activity that occurs in cases in the current view.
-
For each activity listed, select an expected sequence:
Expected Sequence
Description
Any activity can follow except for itself
Select this option if the activity should not immediately repeat.
Any activity can follow
Select this option if any activity can follow this activity.
No activity should follow
Select this option for the activity that represents the end of the business process.
Only specific activities should follow
Select this option to set the expected sequence order. Then, from the Specific Activities list, select one or more activities that can appropriately follow the activity.
-
Click SAVE.