| This content applies solely to Connected KYC, which must be purchased separately from the Appian base platform. This content was written for Appian 23.1 and may not reflect the interfaces or functionality of other Appian versions. |
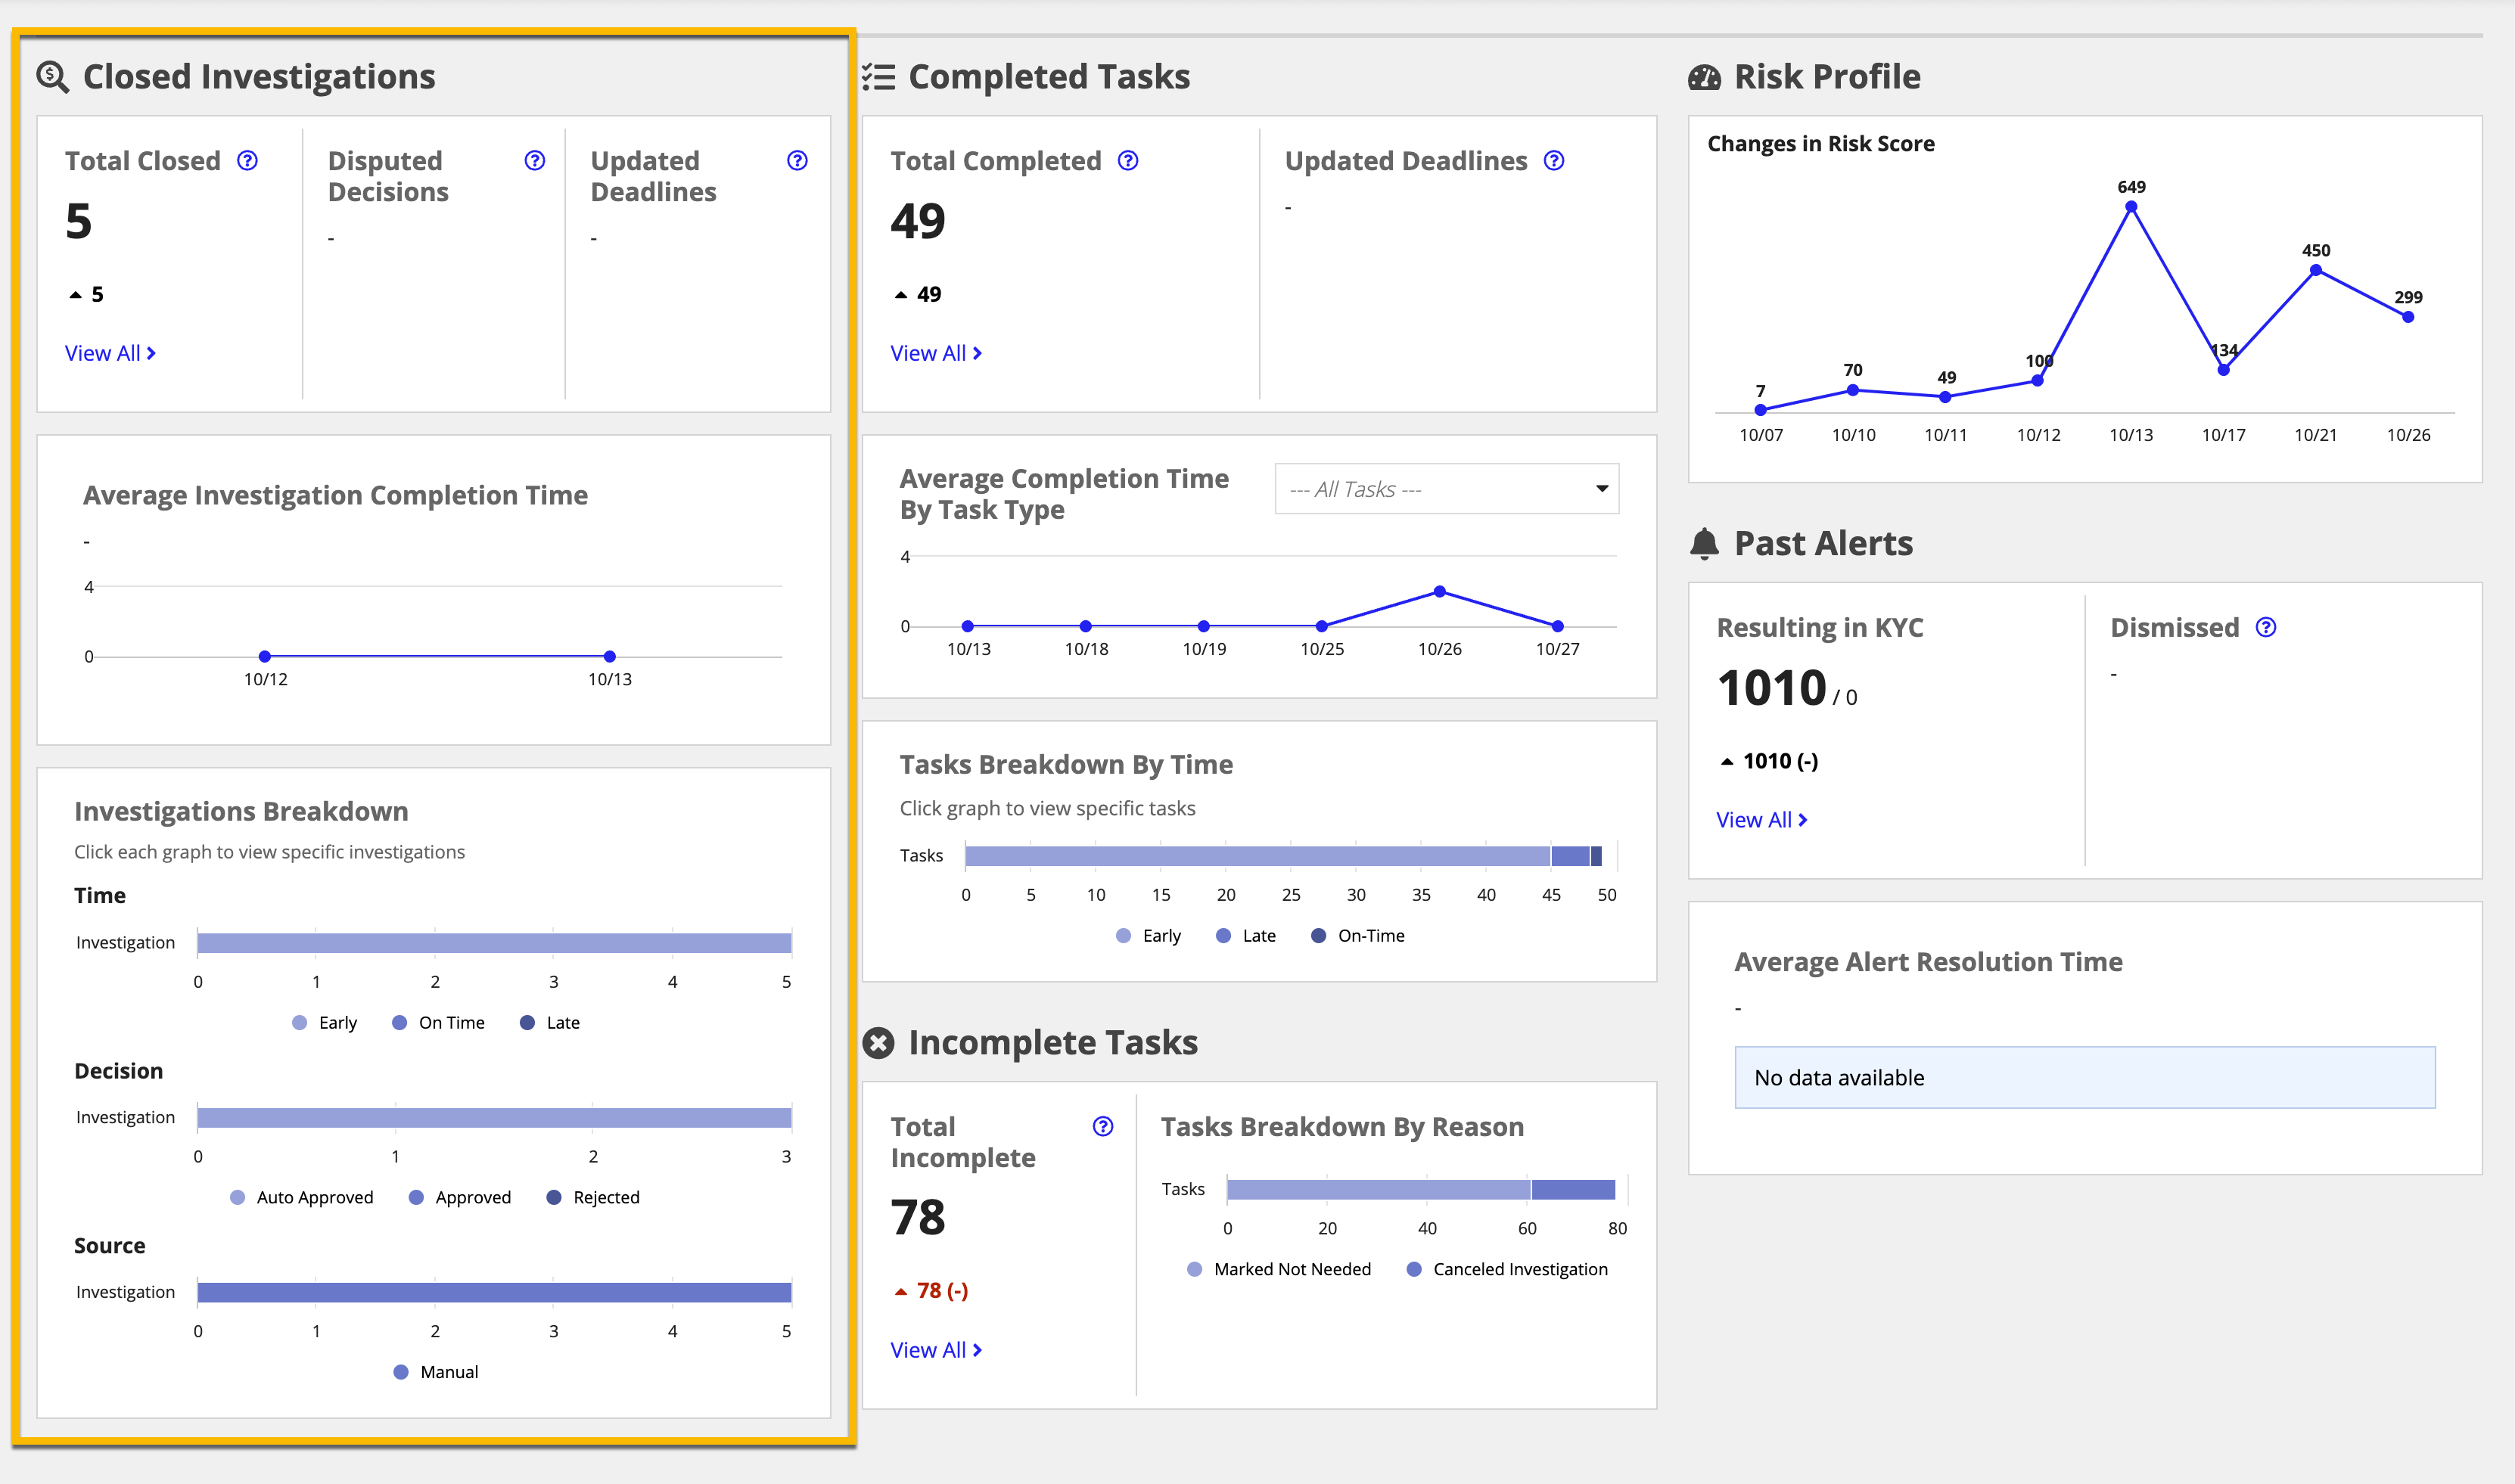
The TRENDS dashboard allows managers to view a series of reports, letting them monitor completed KYC investigations, task completion performance, and more. This page describes how managers can view these metrics to see how their organization performs in specific areas.
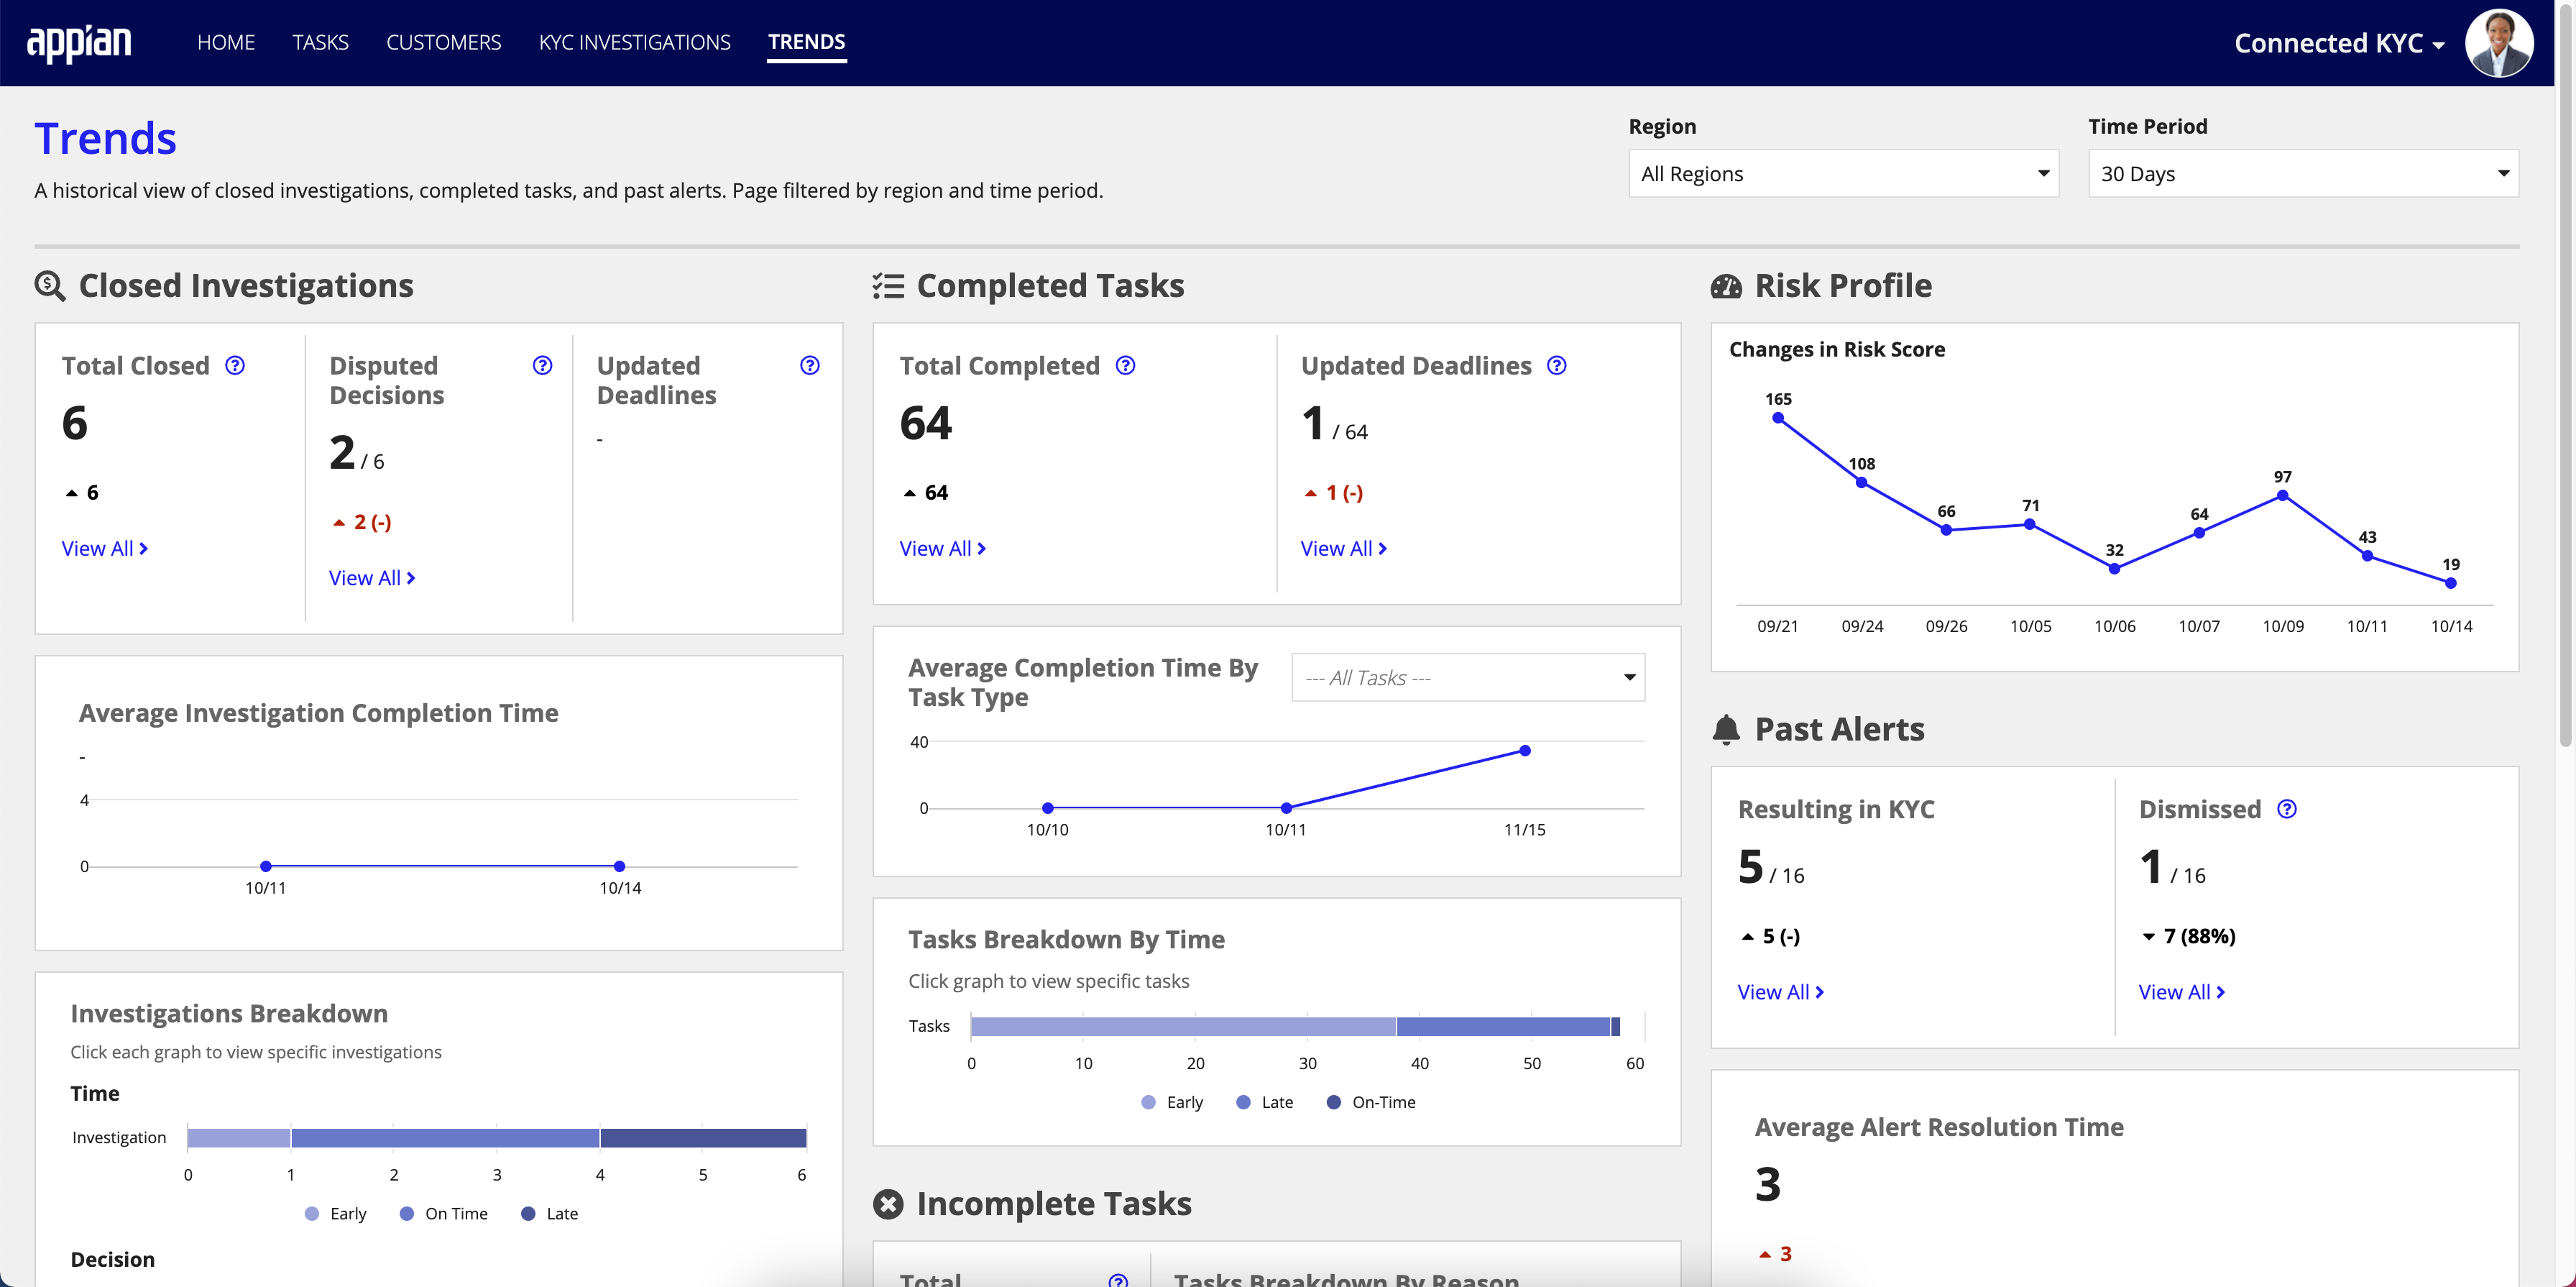
The TRENDS dashboard has several sections, with each section featuring panels focusing on a different set of data.
The sections are:
A manager can use the filter options to change the data they want to display on the dashboard. Filters can be combined to show more specific results.
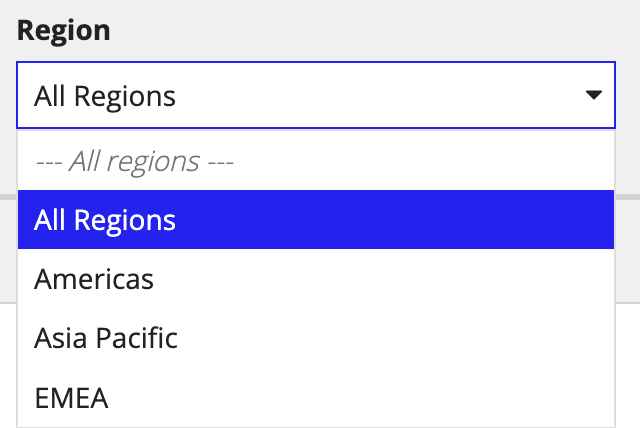
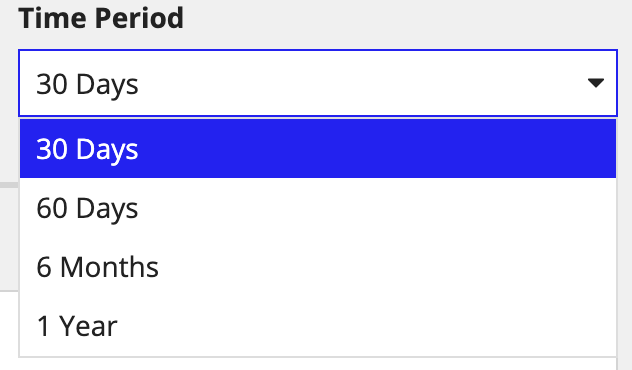
The available filters are:
Region: The user can select to look at the data generated from All Regions, Americas, Asia Pacific, and EMEA (Europe, Middle East, and Africa). By default, the dashboard shows All Regions.
Time Period: The user can select to look at the data over a 30, 60, or 90-day historical period. By default, the dashboard shows the past 30 days.
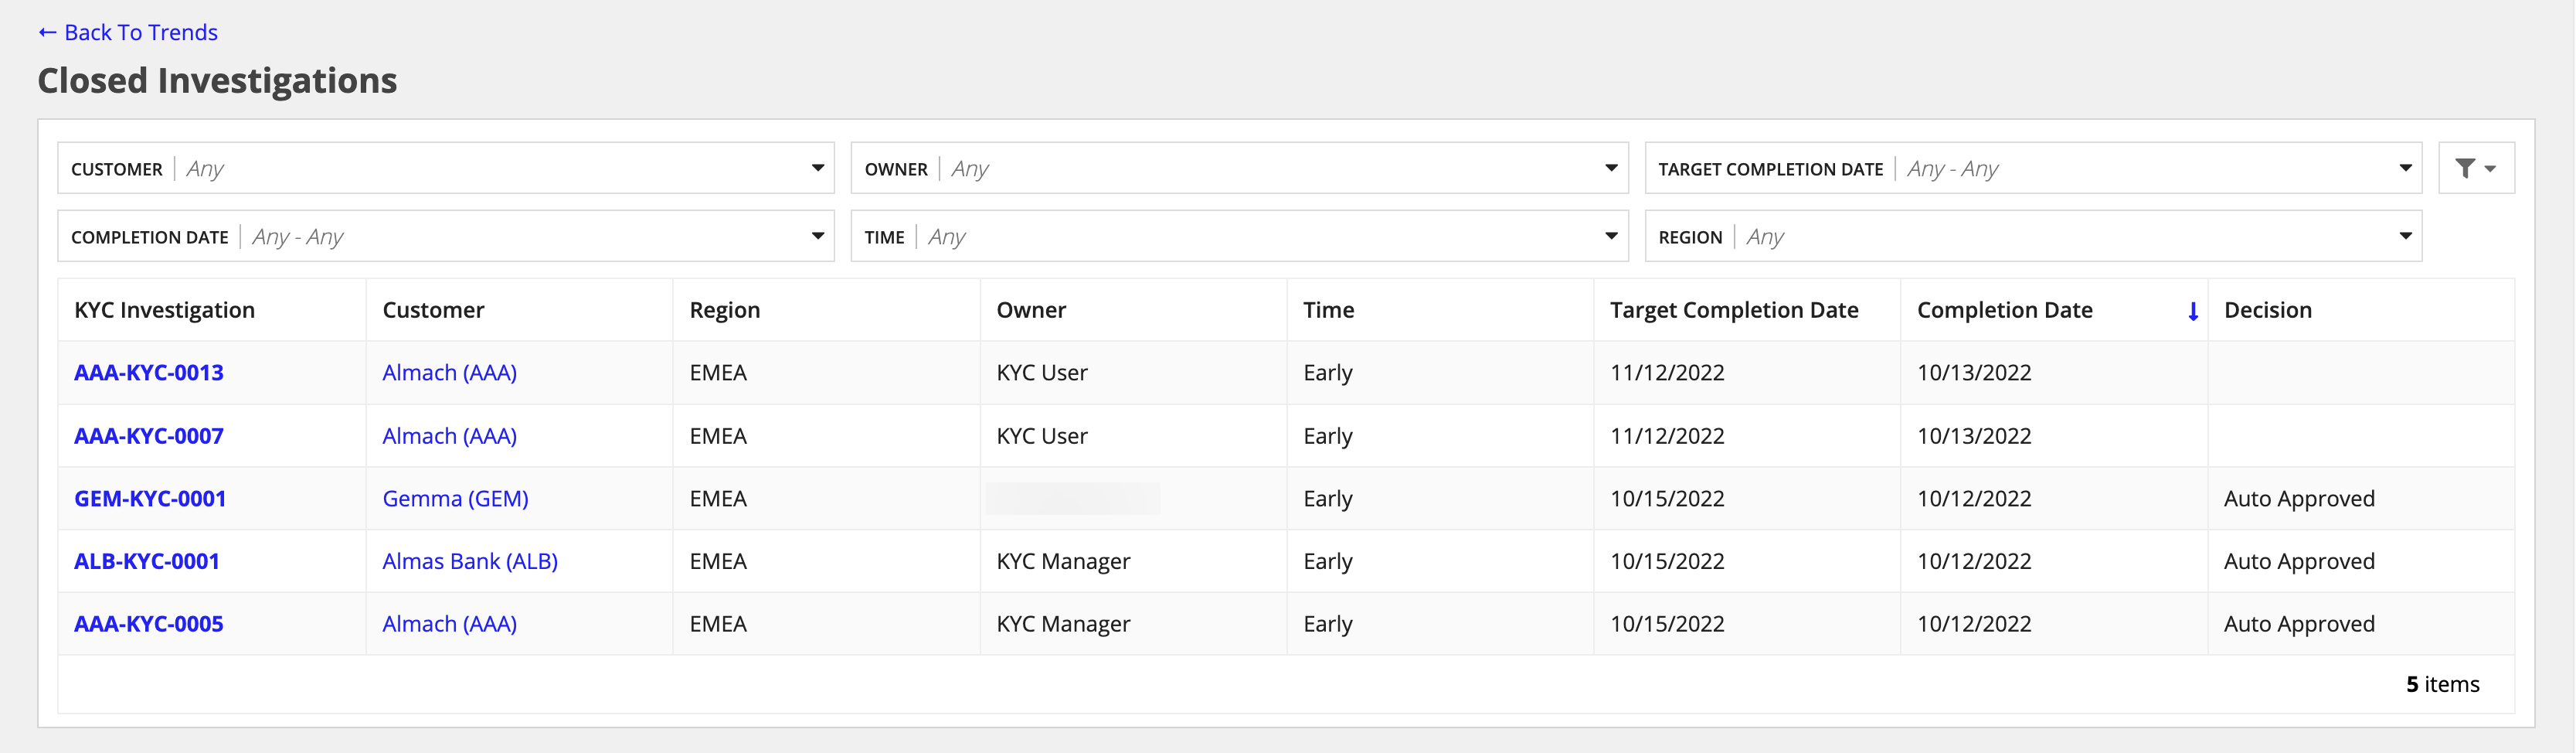
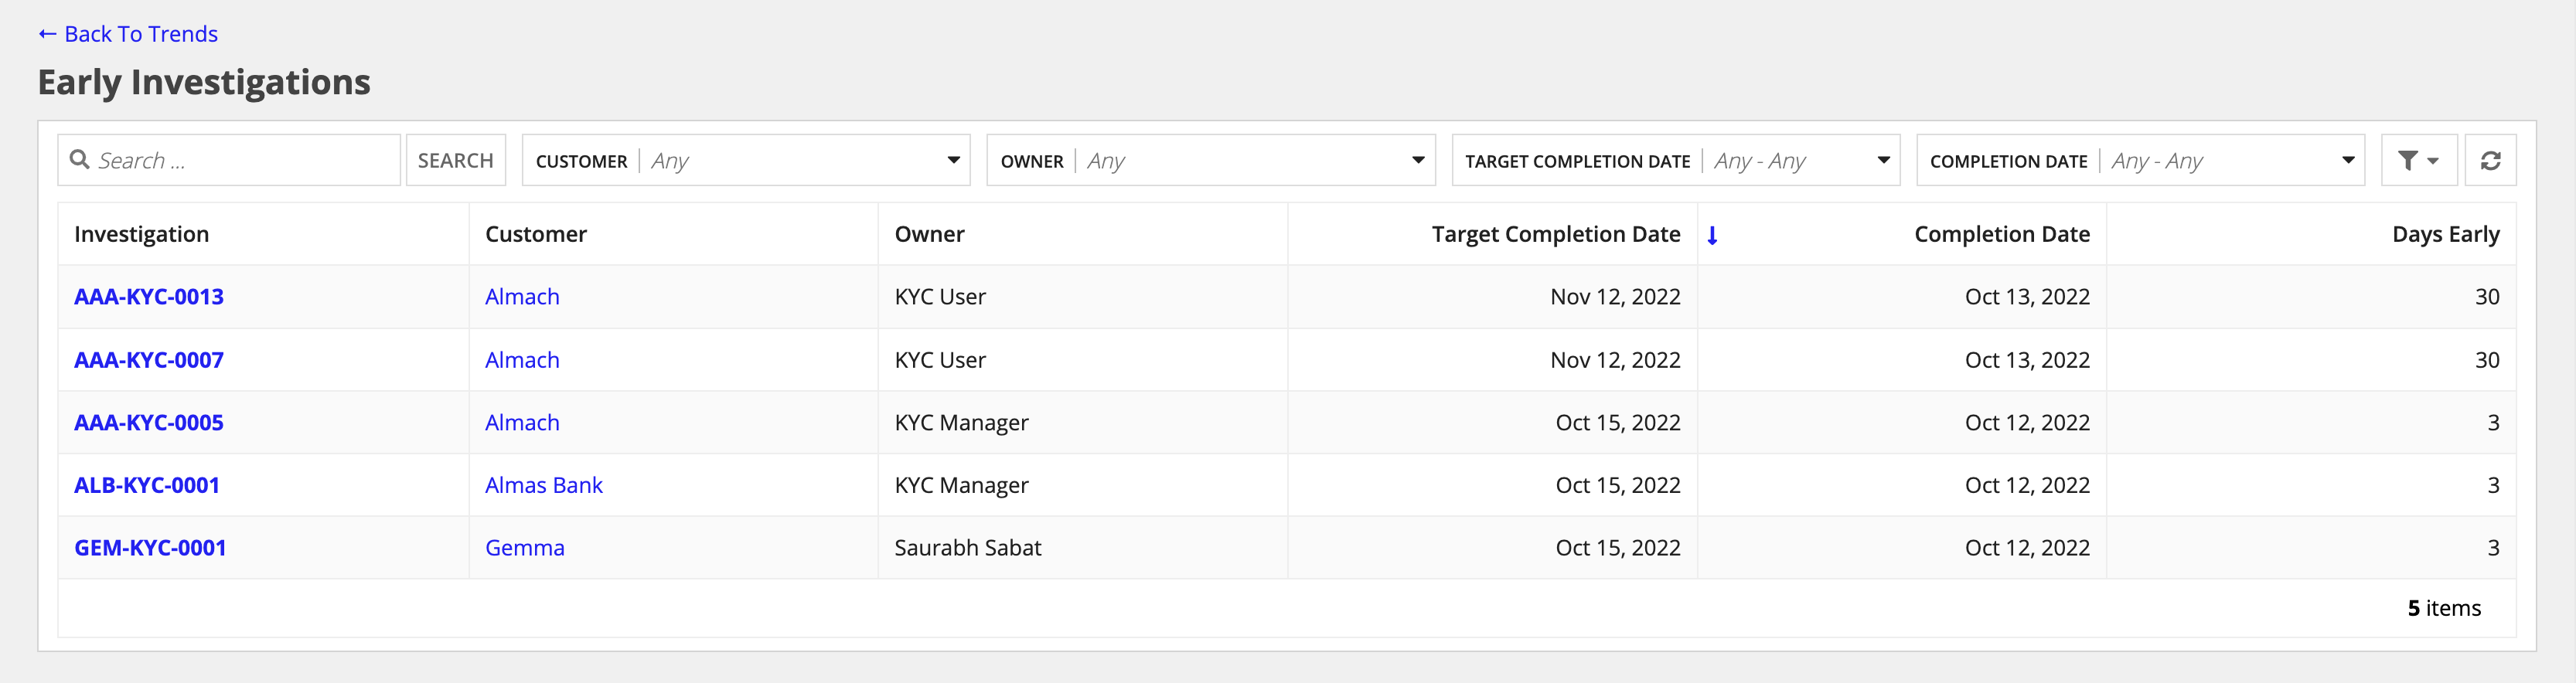
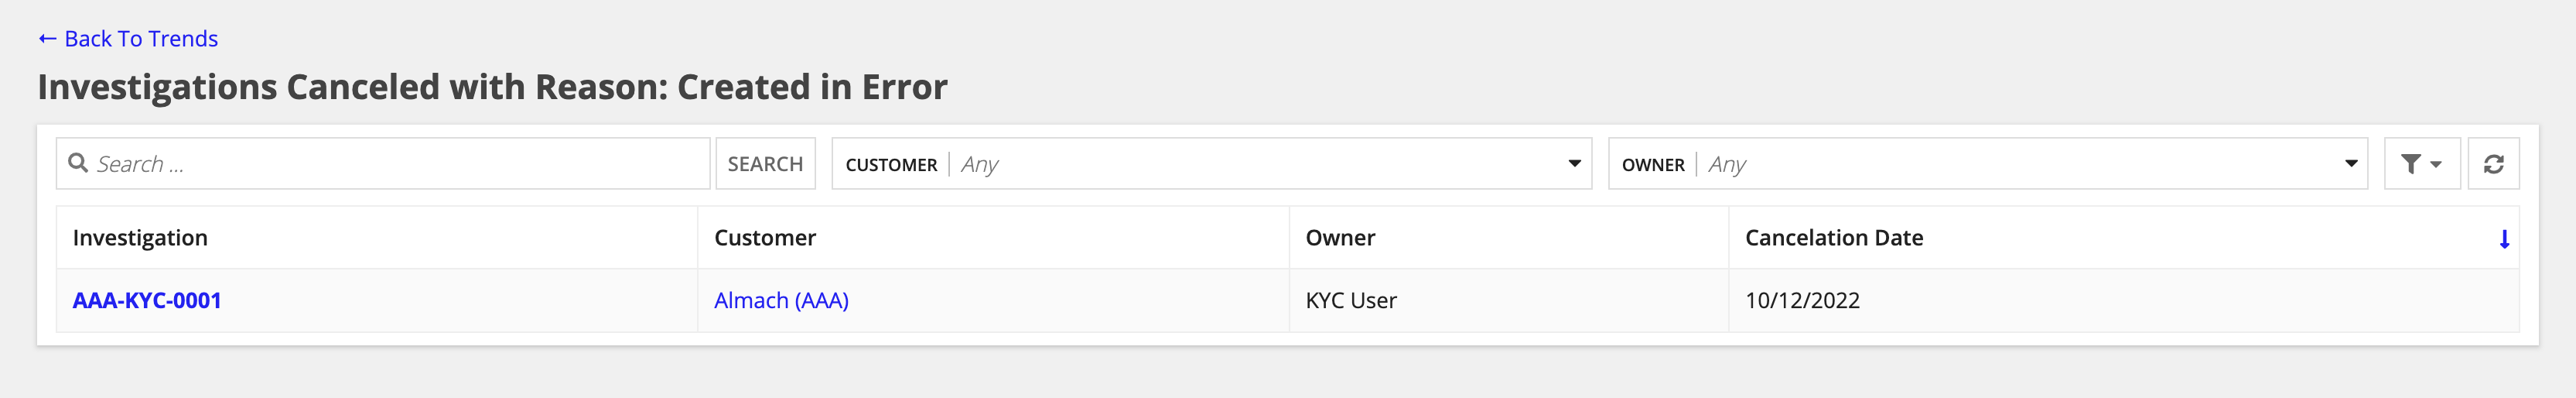
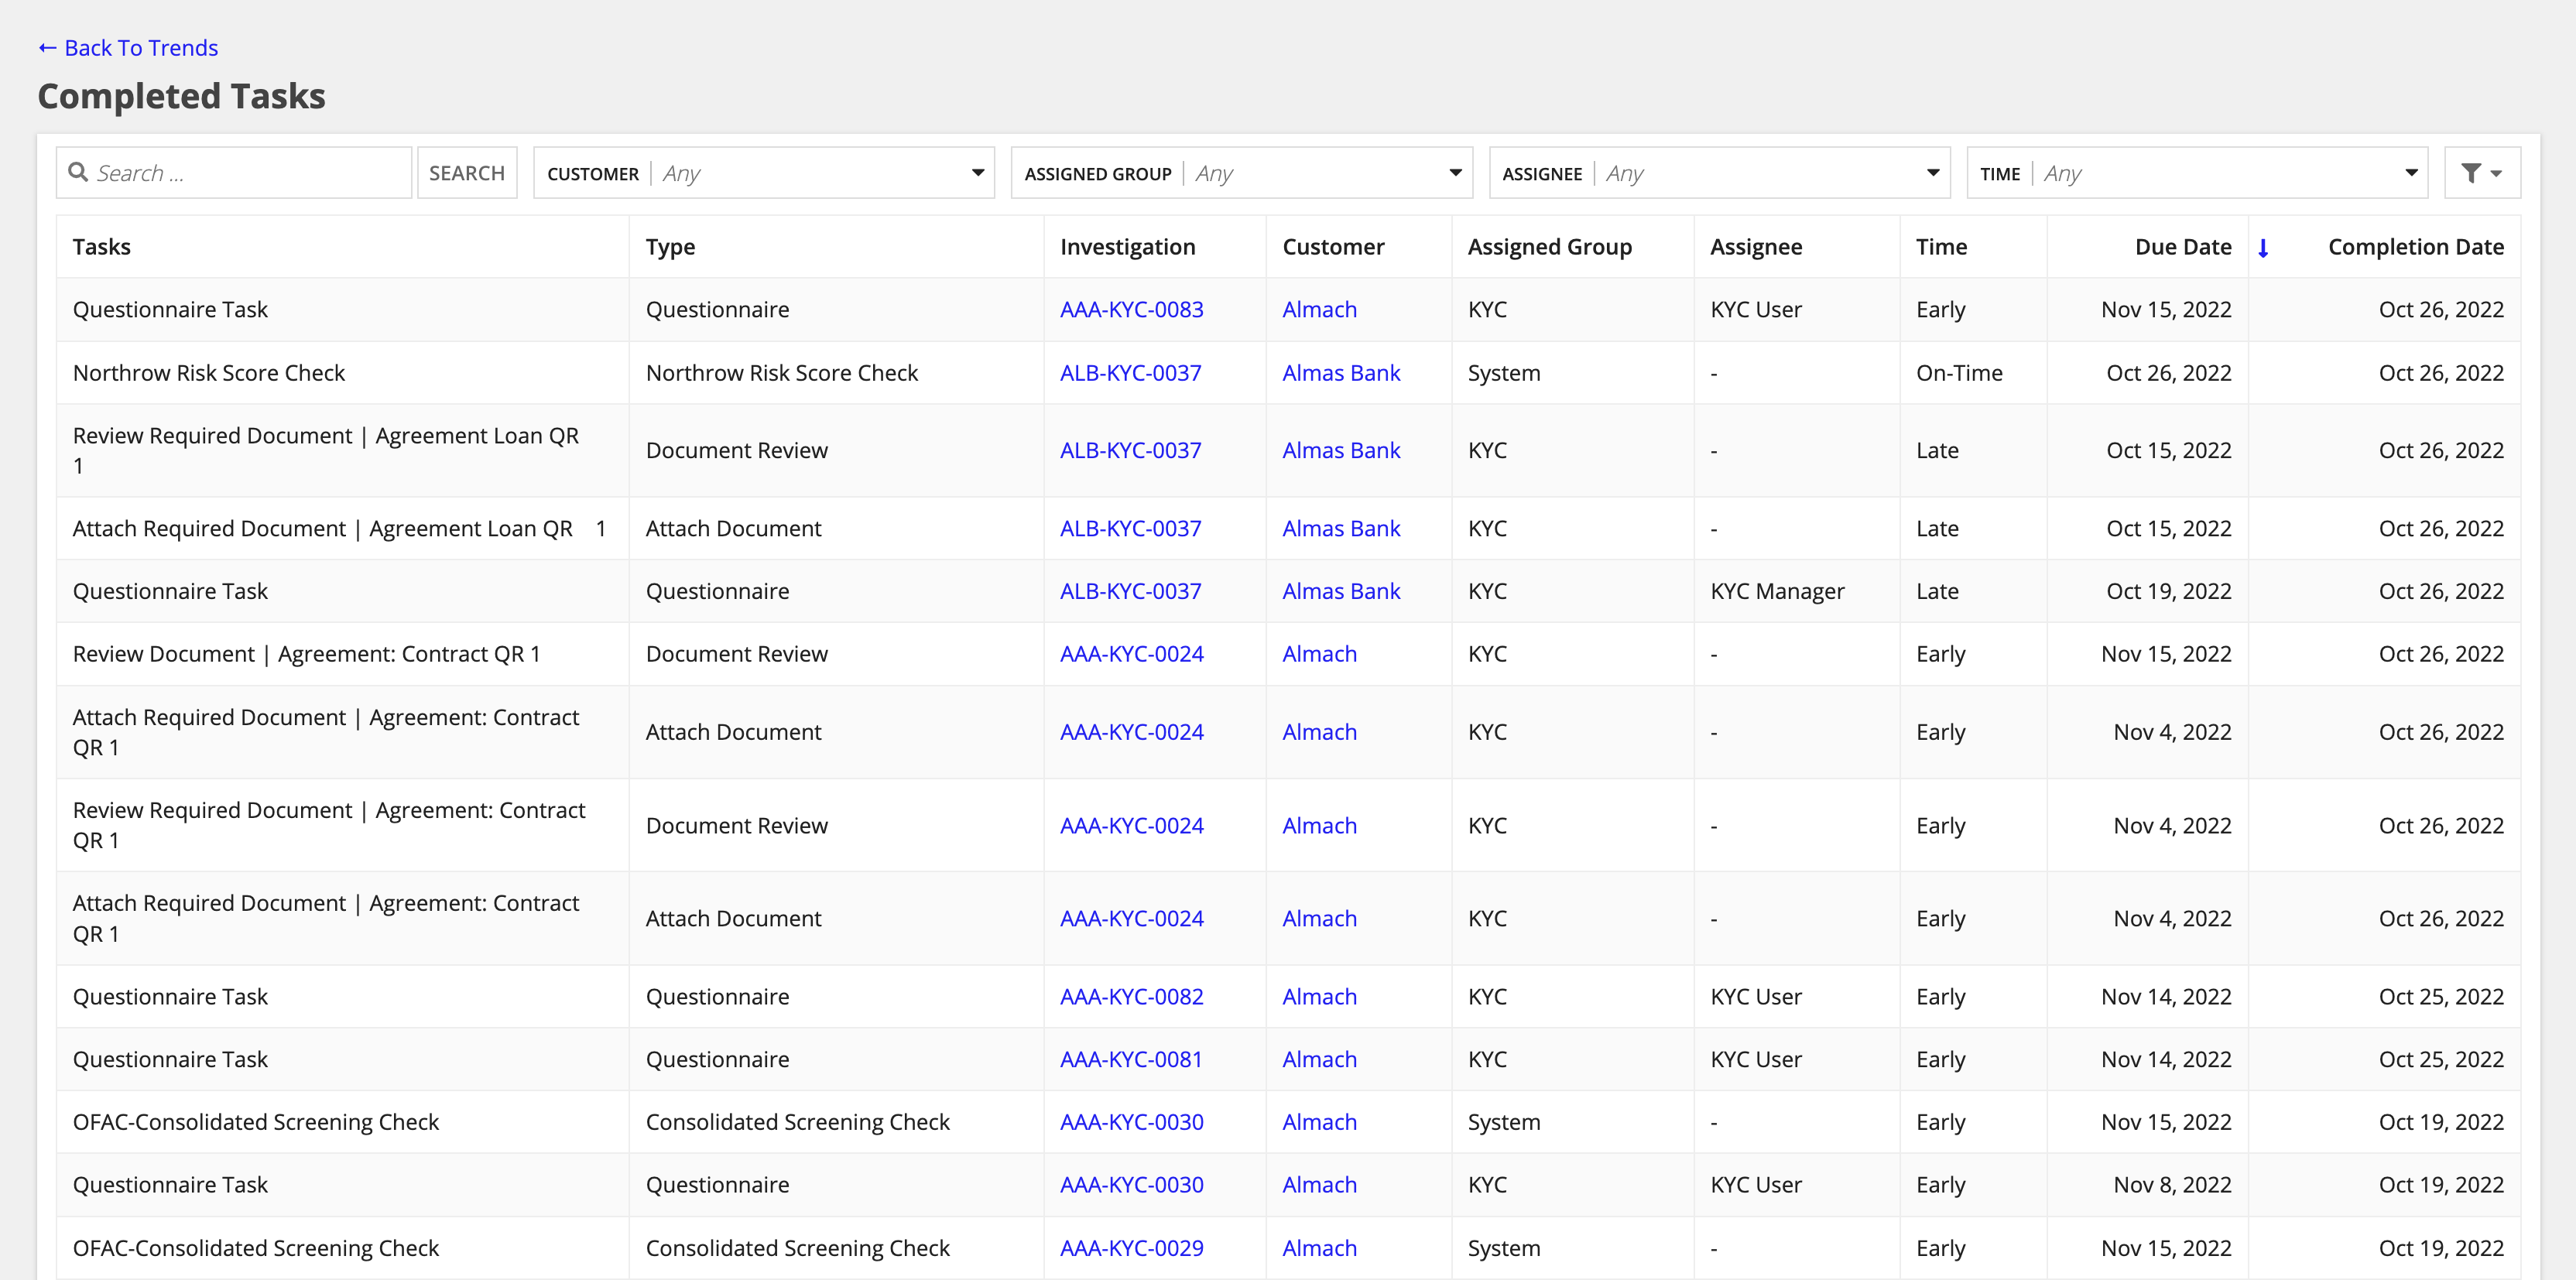
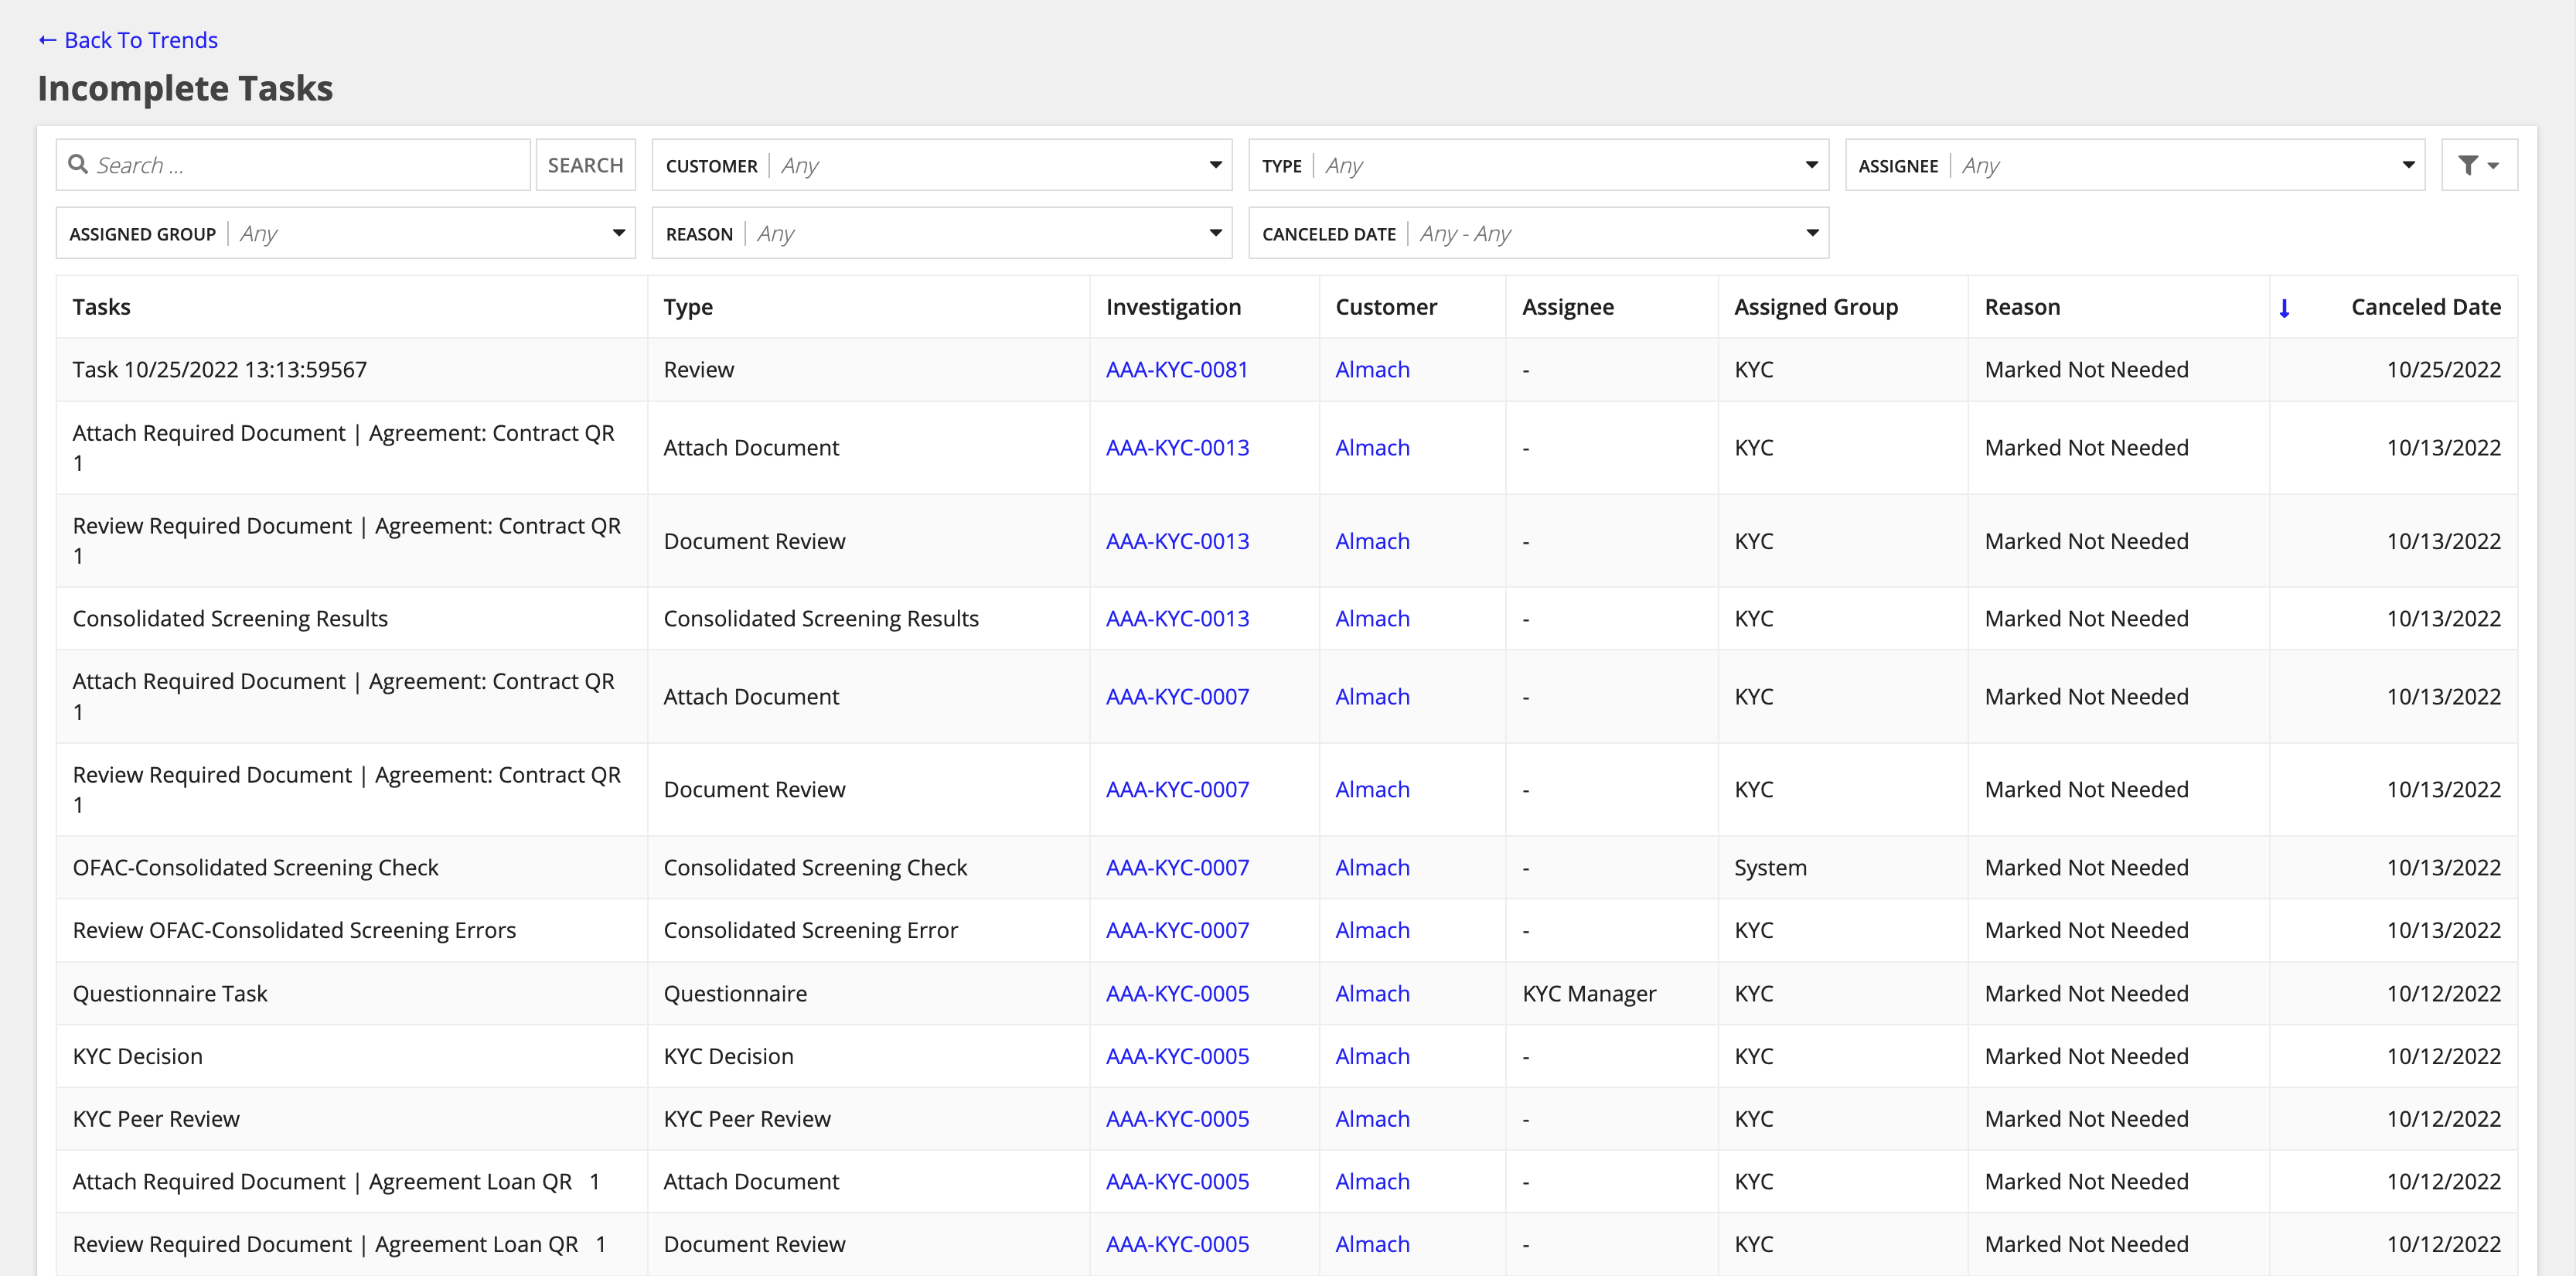
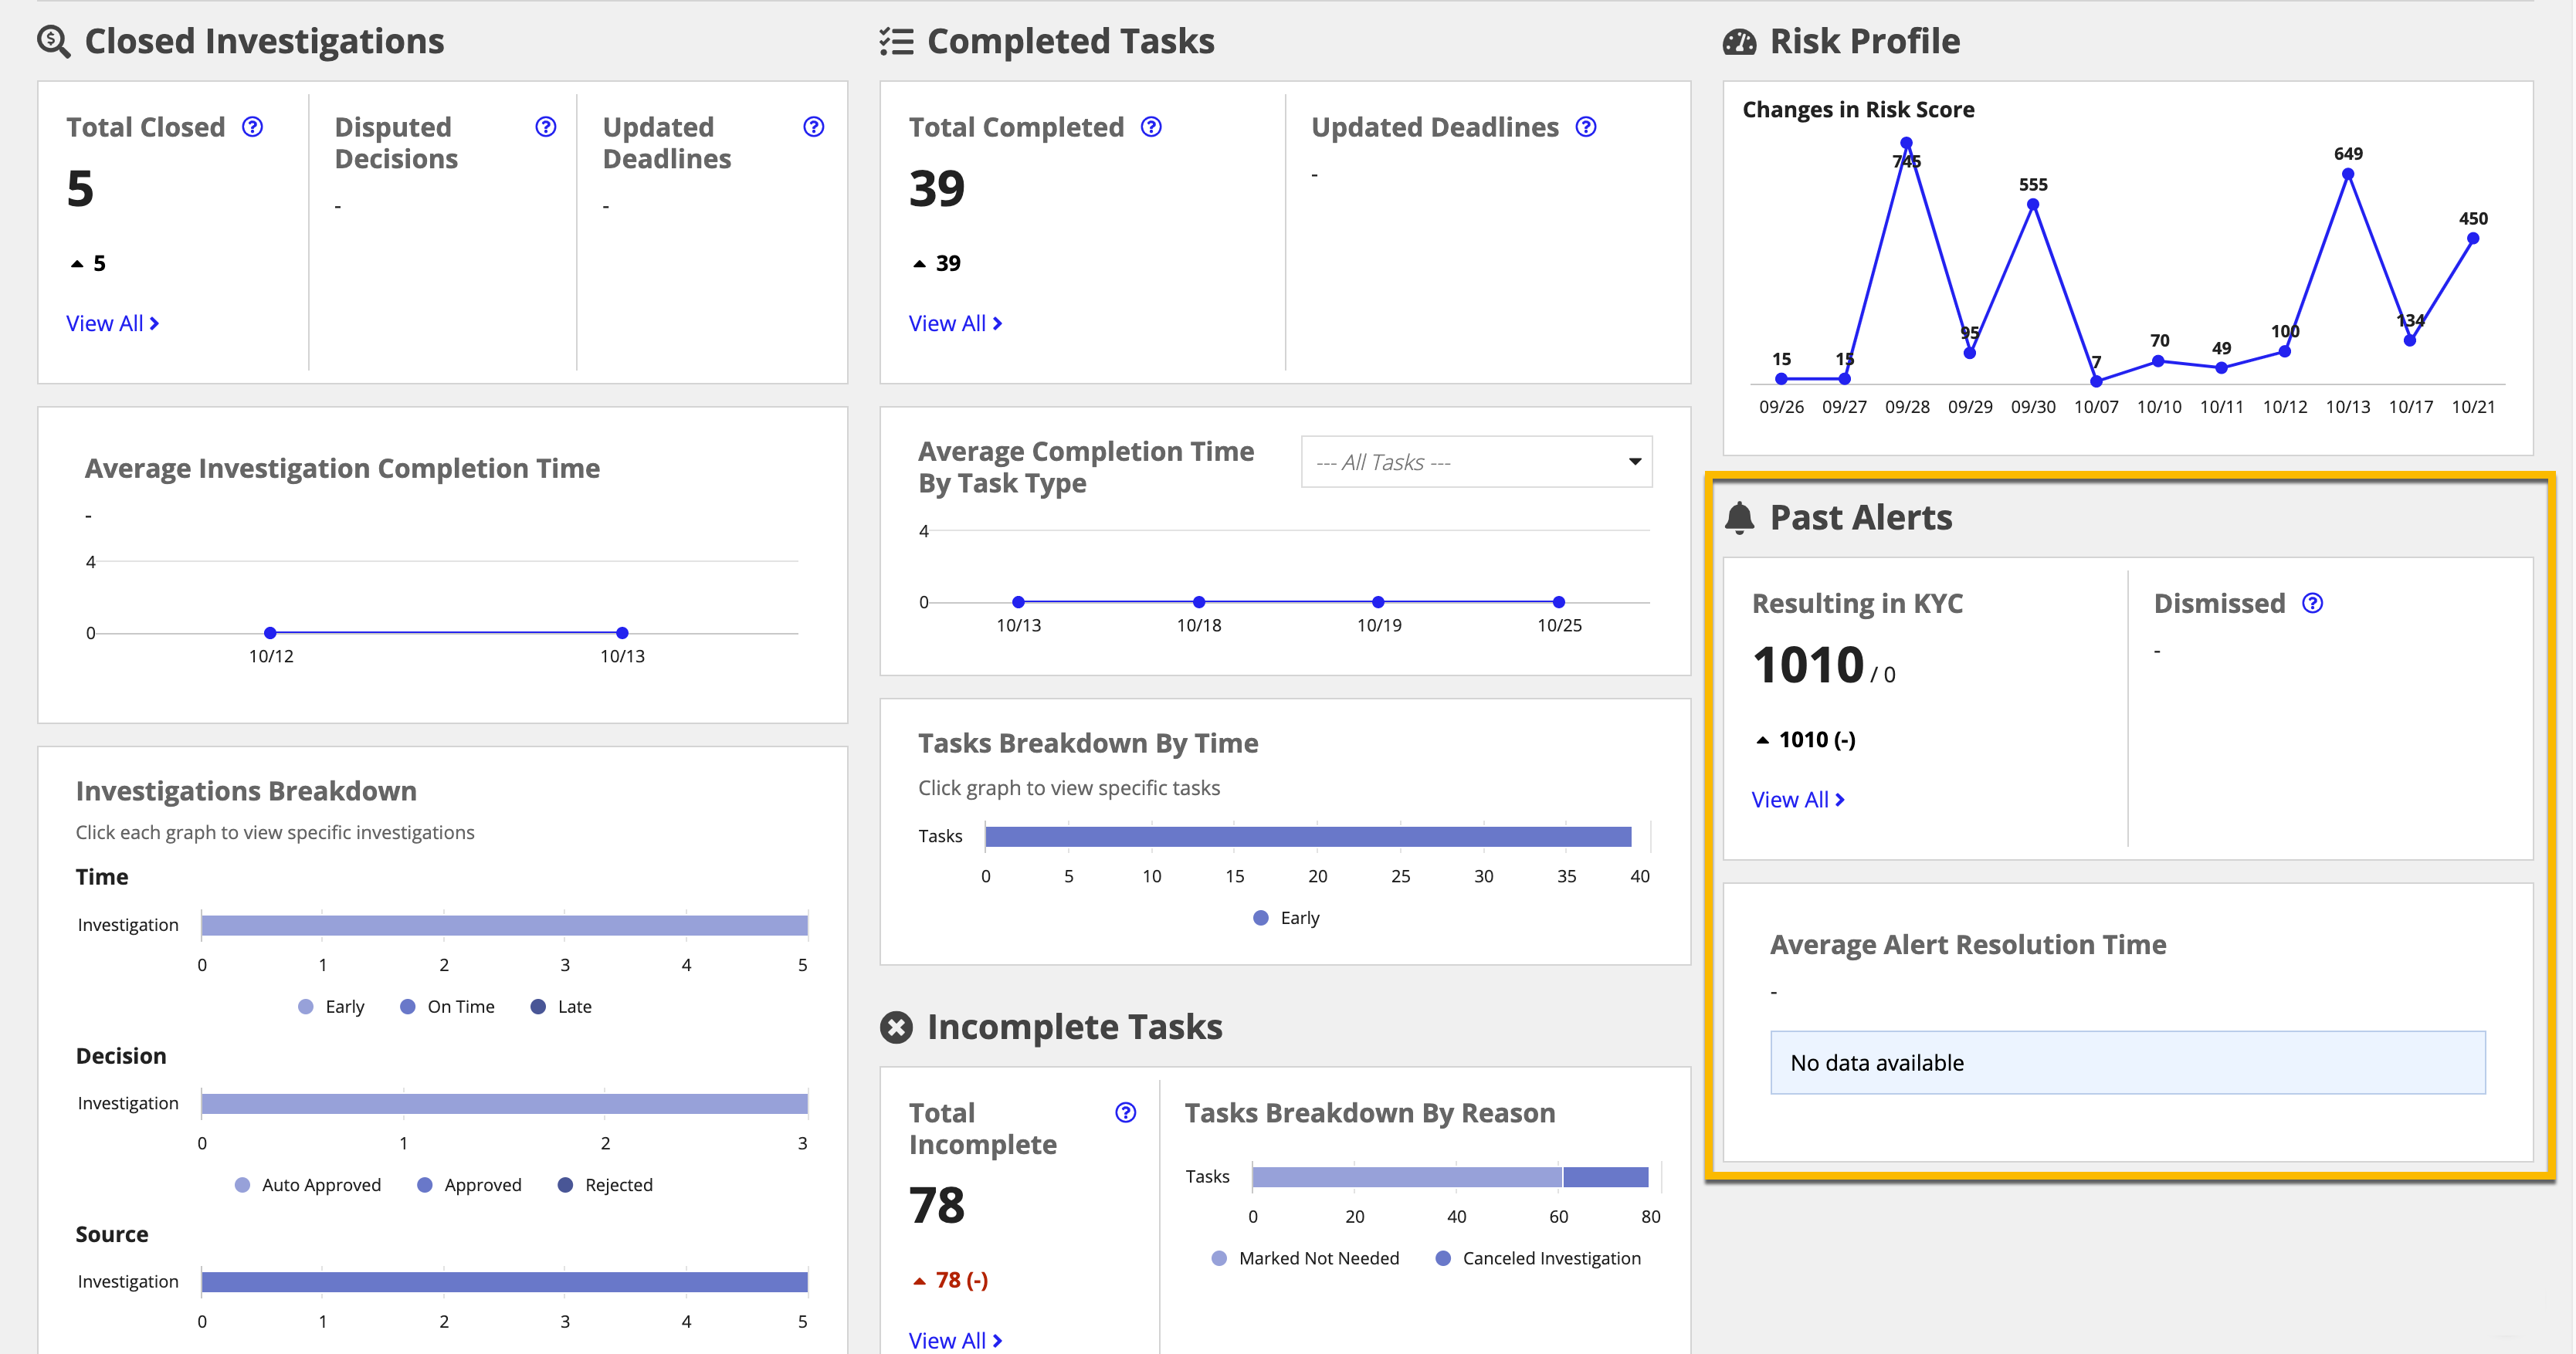
Some reports can be drilled down into to reveal additional information, like the record tables of the shown data. Note that not all reports feature the ability to drill down deeper into the data, and some may only feature one of the possible methods for drilling down.
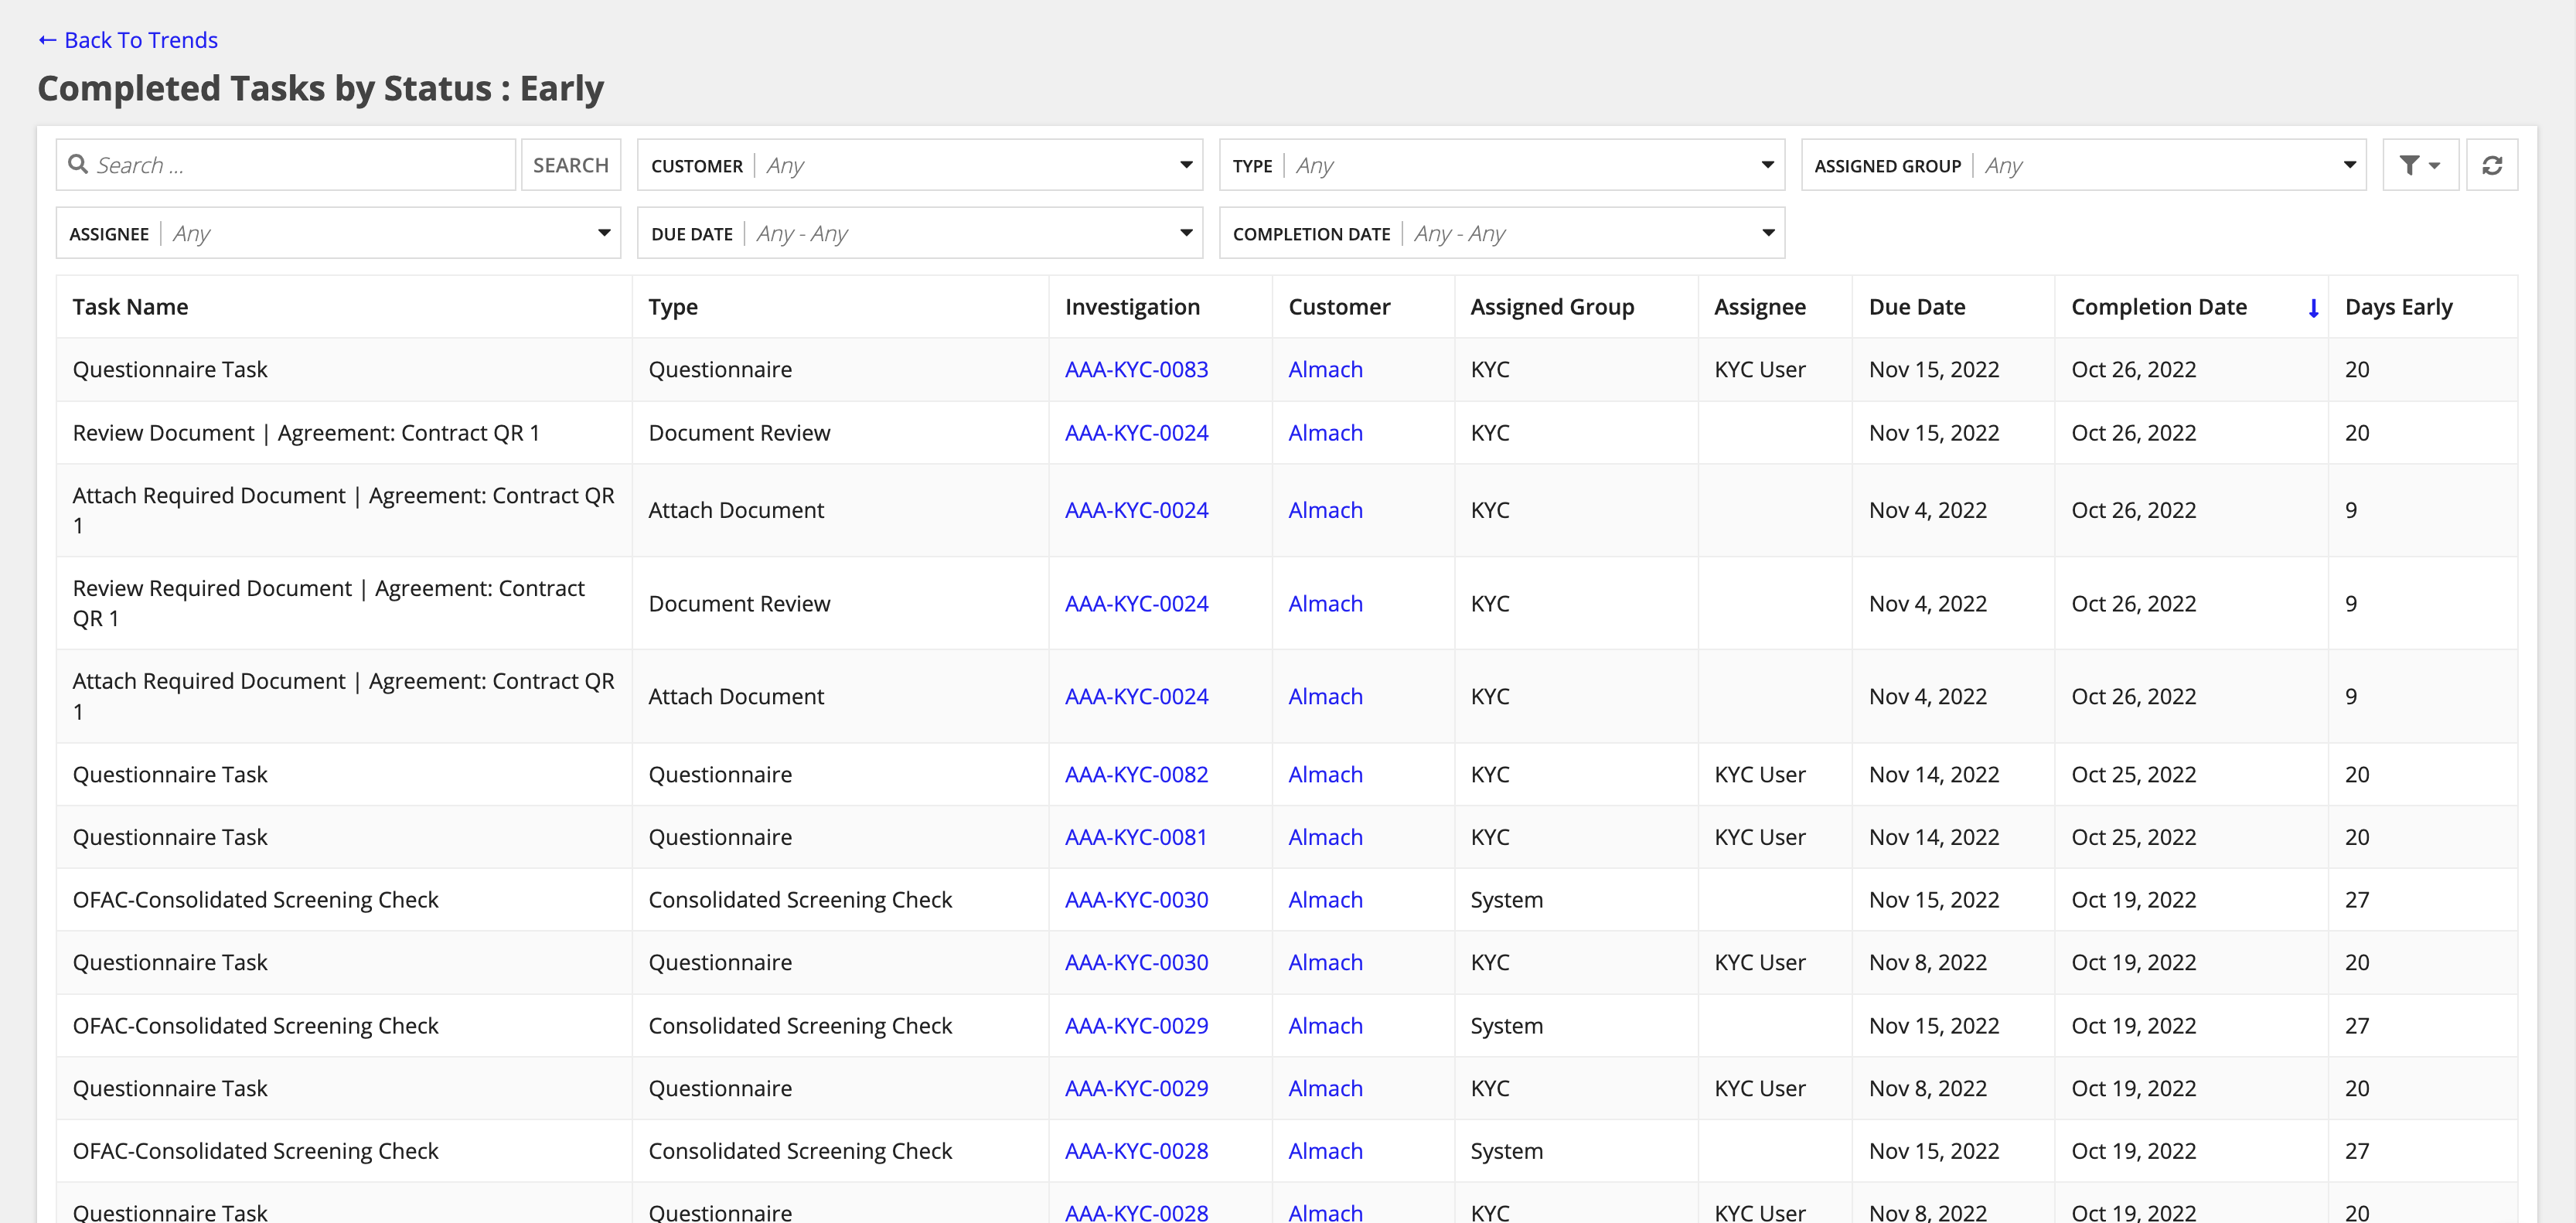
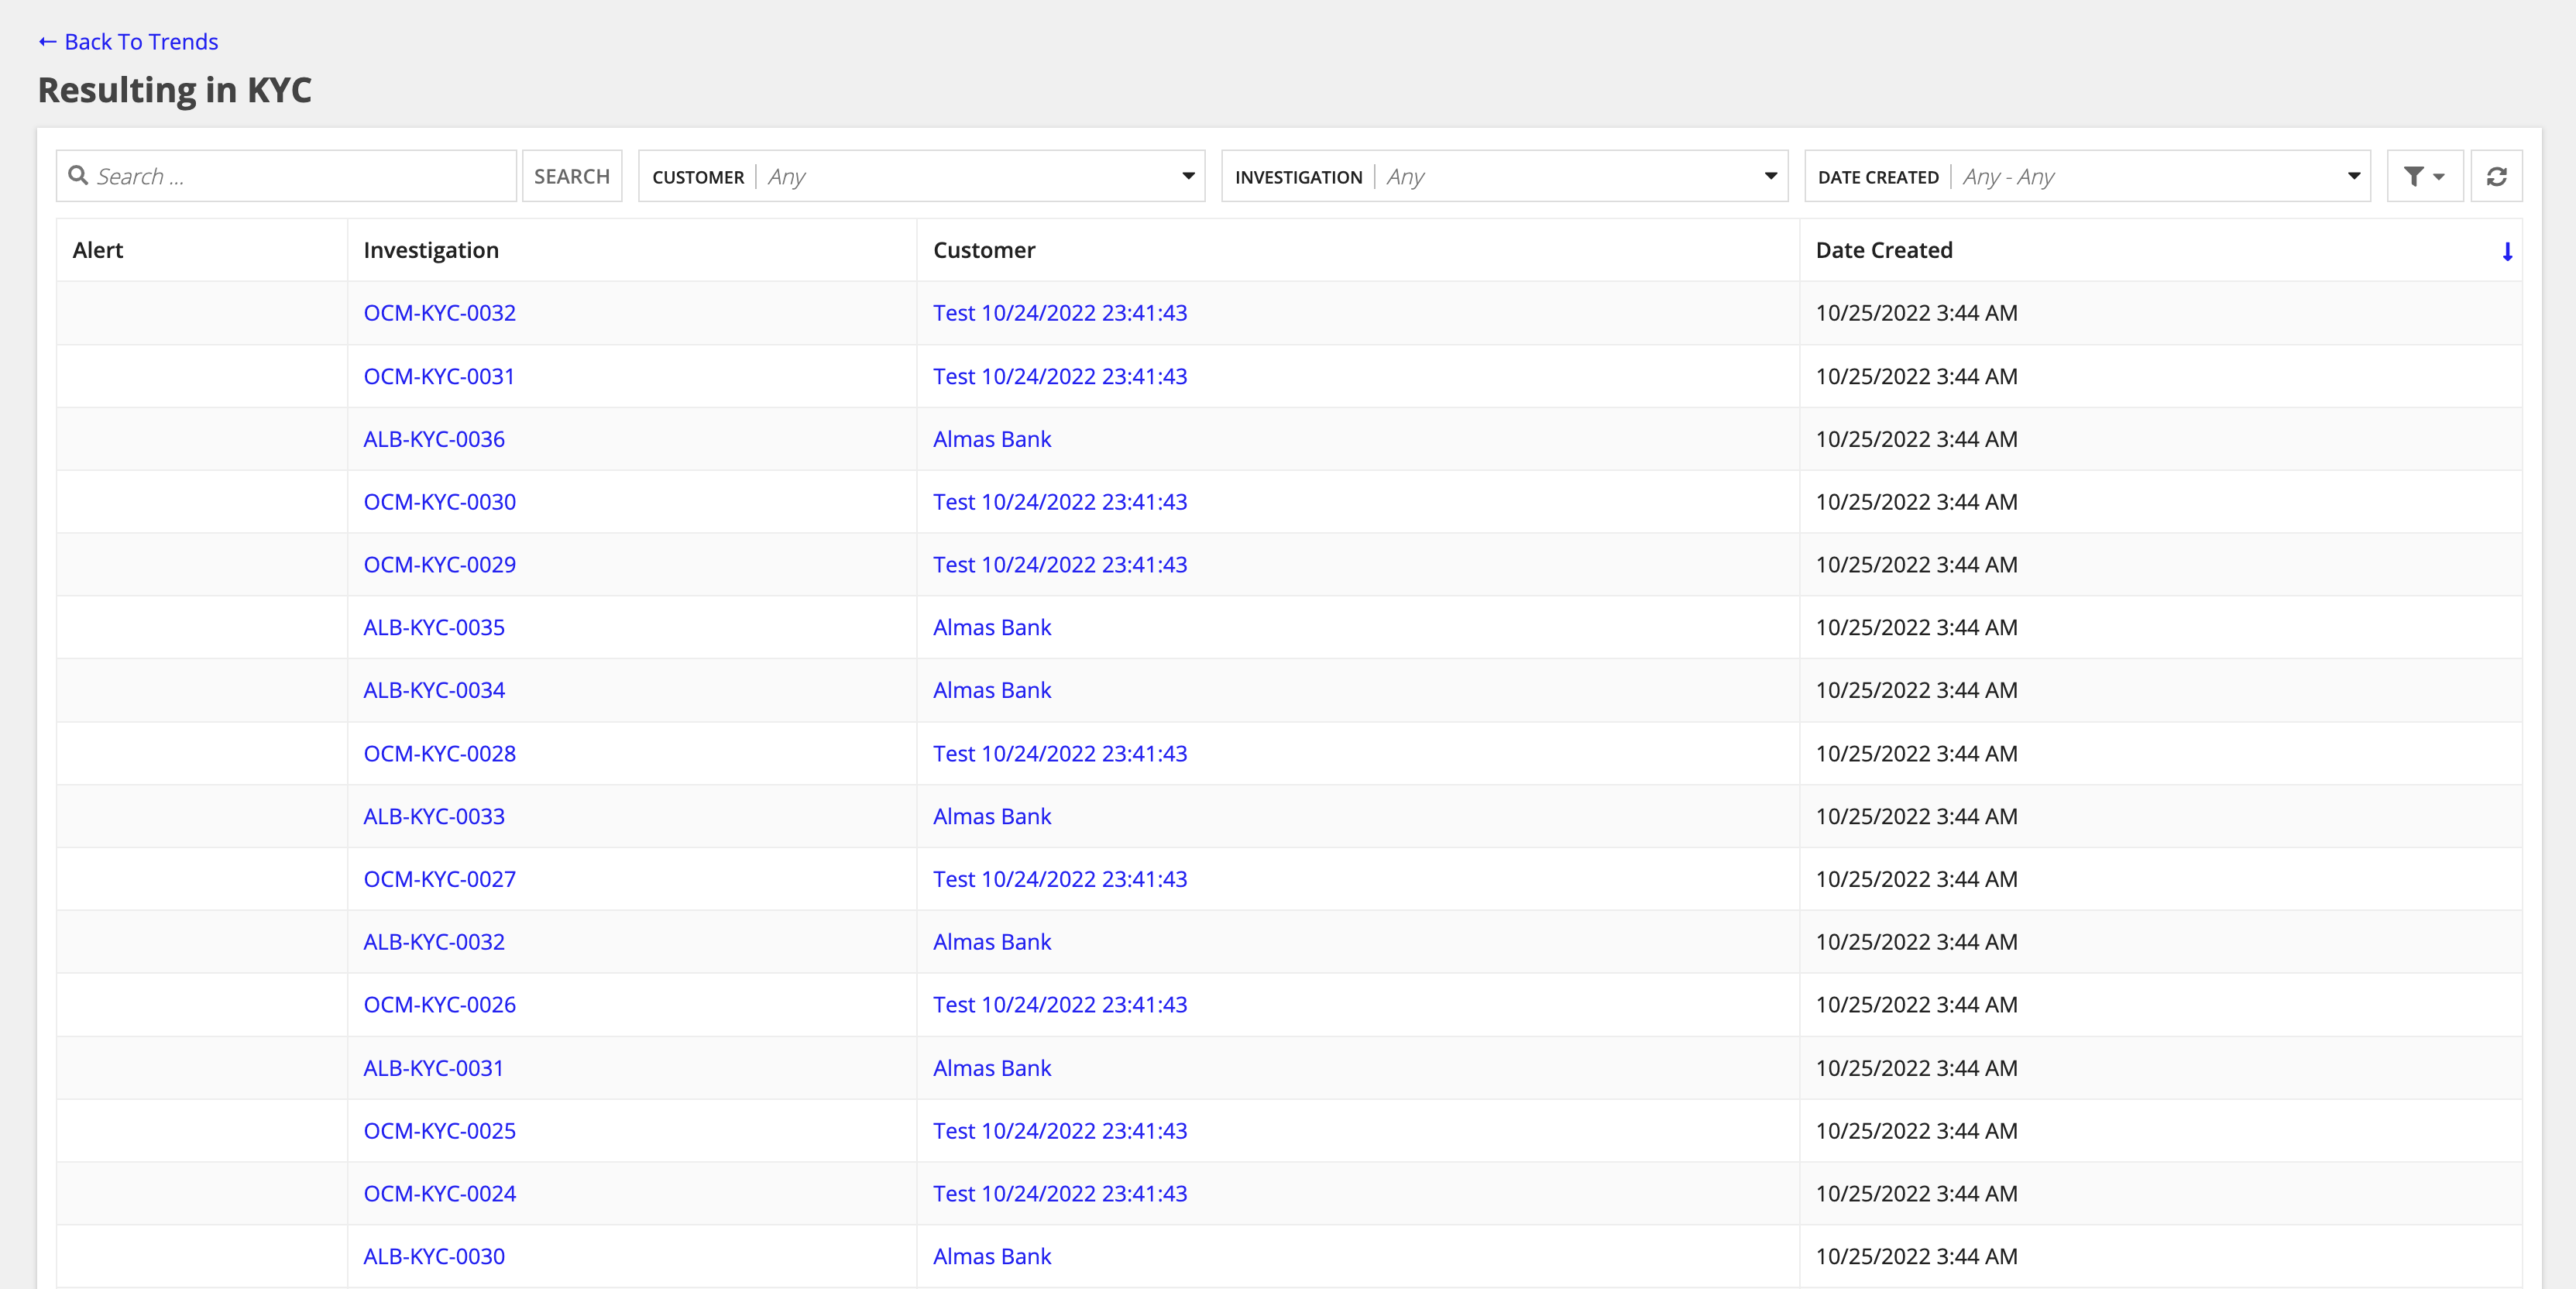
Clicking the View All hyperlink within a panel shows a record table of all the investigations included in a respective statistic.
Clicking an individual statistic in a graph that groups together multiple statistics shows an isolated view of the respective data you clicked.
Some questions that this data can answer are:
The Total Closed, Disputed Decisions, and Updated Deadlines section shows how many investigations were closed, had disputed decisions, or had their deadline adjusted prior to closing.
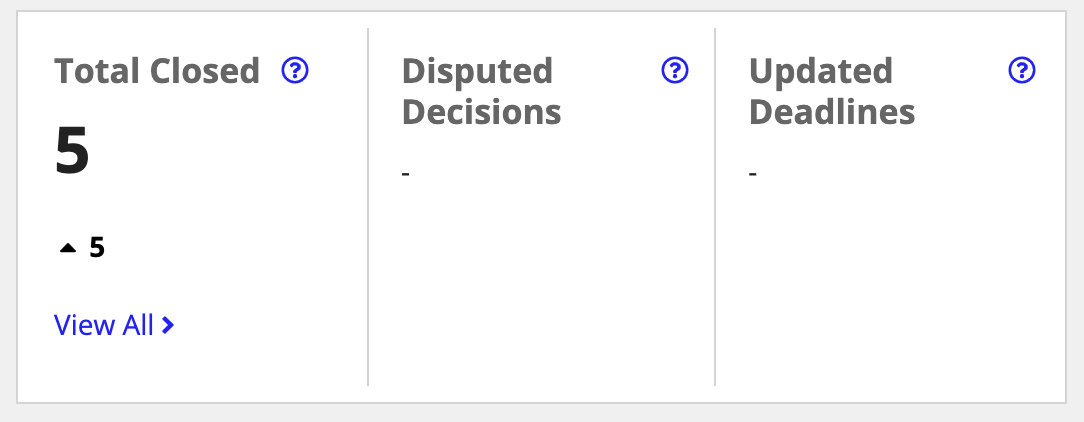
In this section, you see:
The Average Investigation Completion Time section shows the time that investigators are taking to complete investigations.
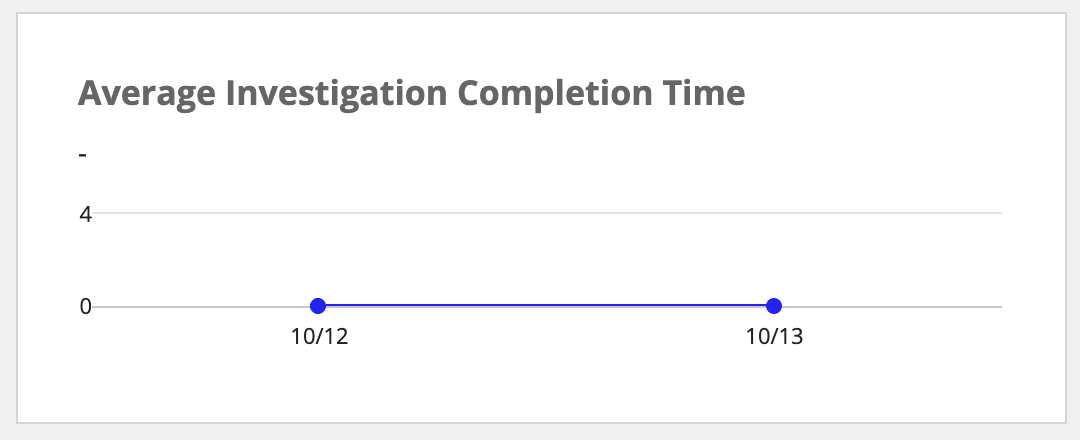
In this section you, see:
The Investigations Breakdown section shows a detailed breakdown of closed investigations by Time, Decision, and Source.
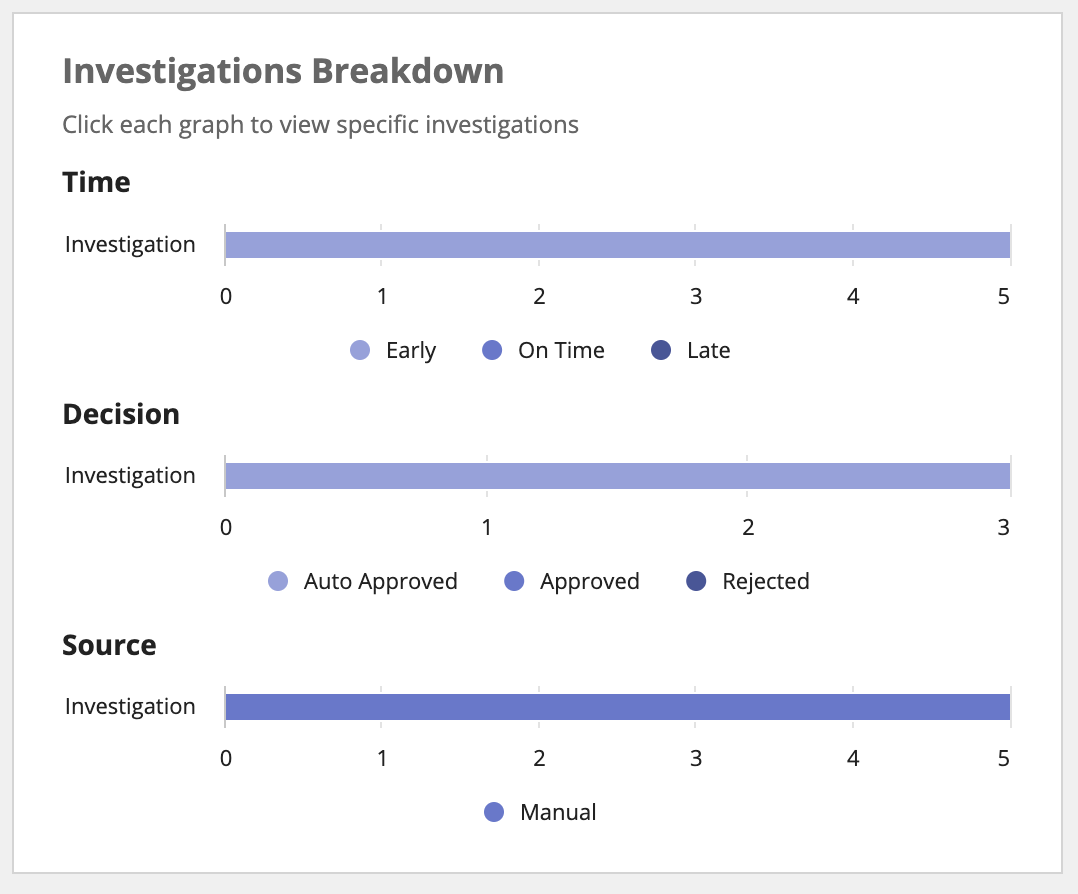
In this section, you see:
Some questions that this data can answer are:
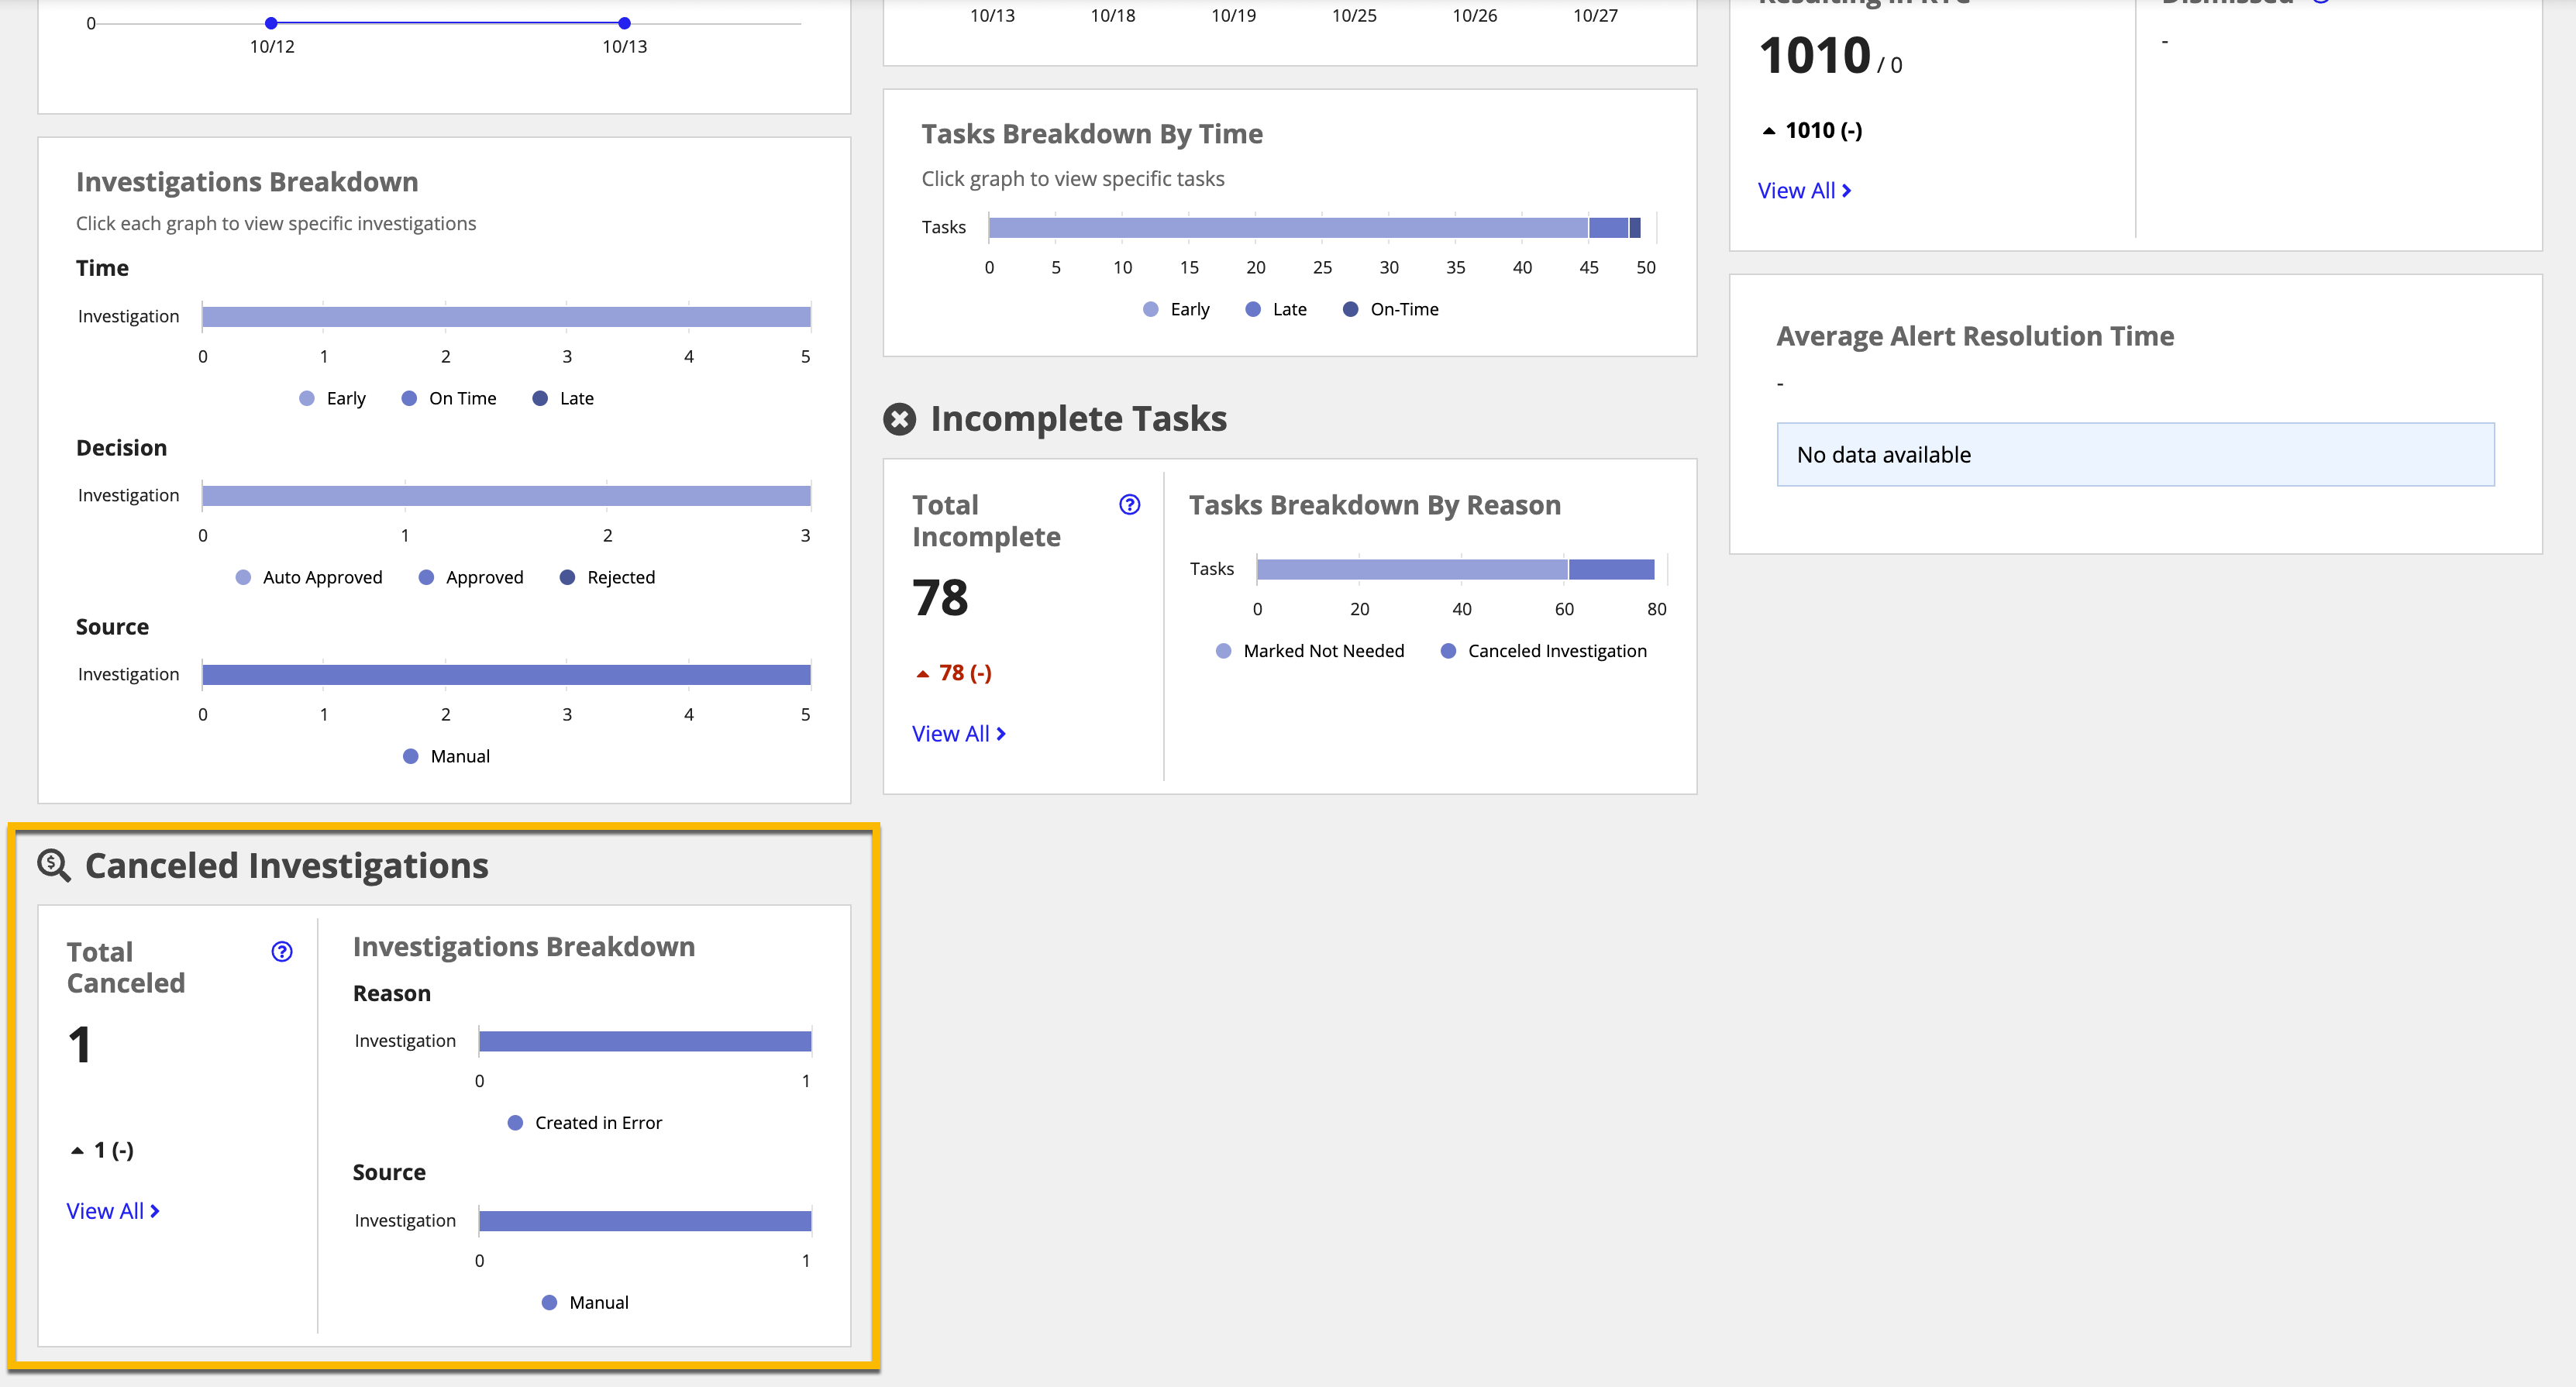
The Total Canceled, Investigations Breakdown section shows how many investigations were canceled, and a breakdown of the reasons and sources for the cancellation.
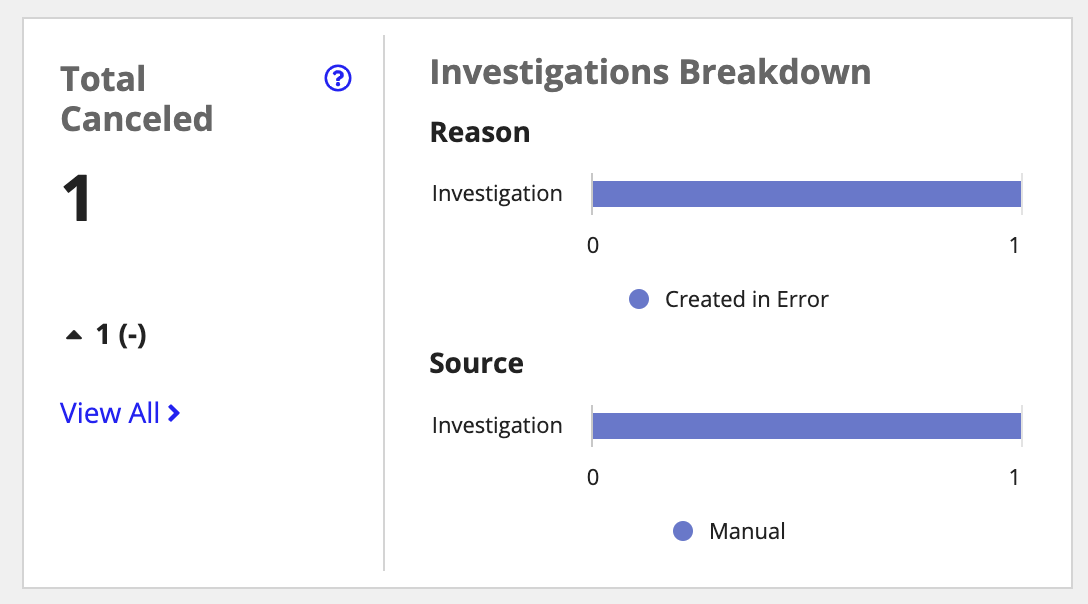
In this section, you see:
Some questions that this data can answer are:
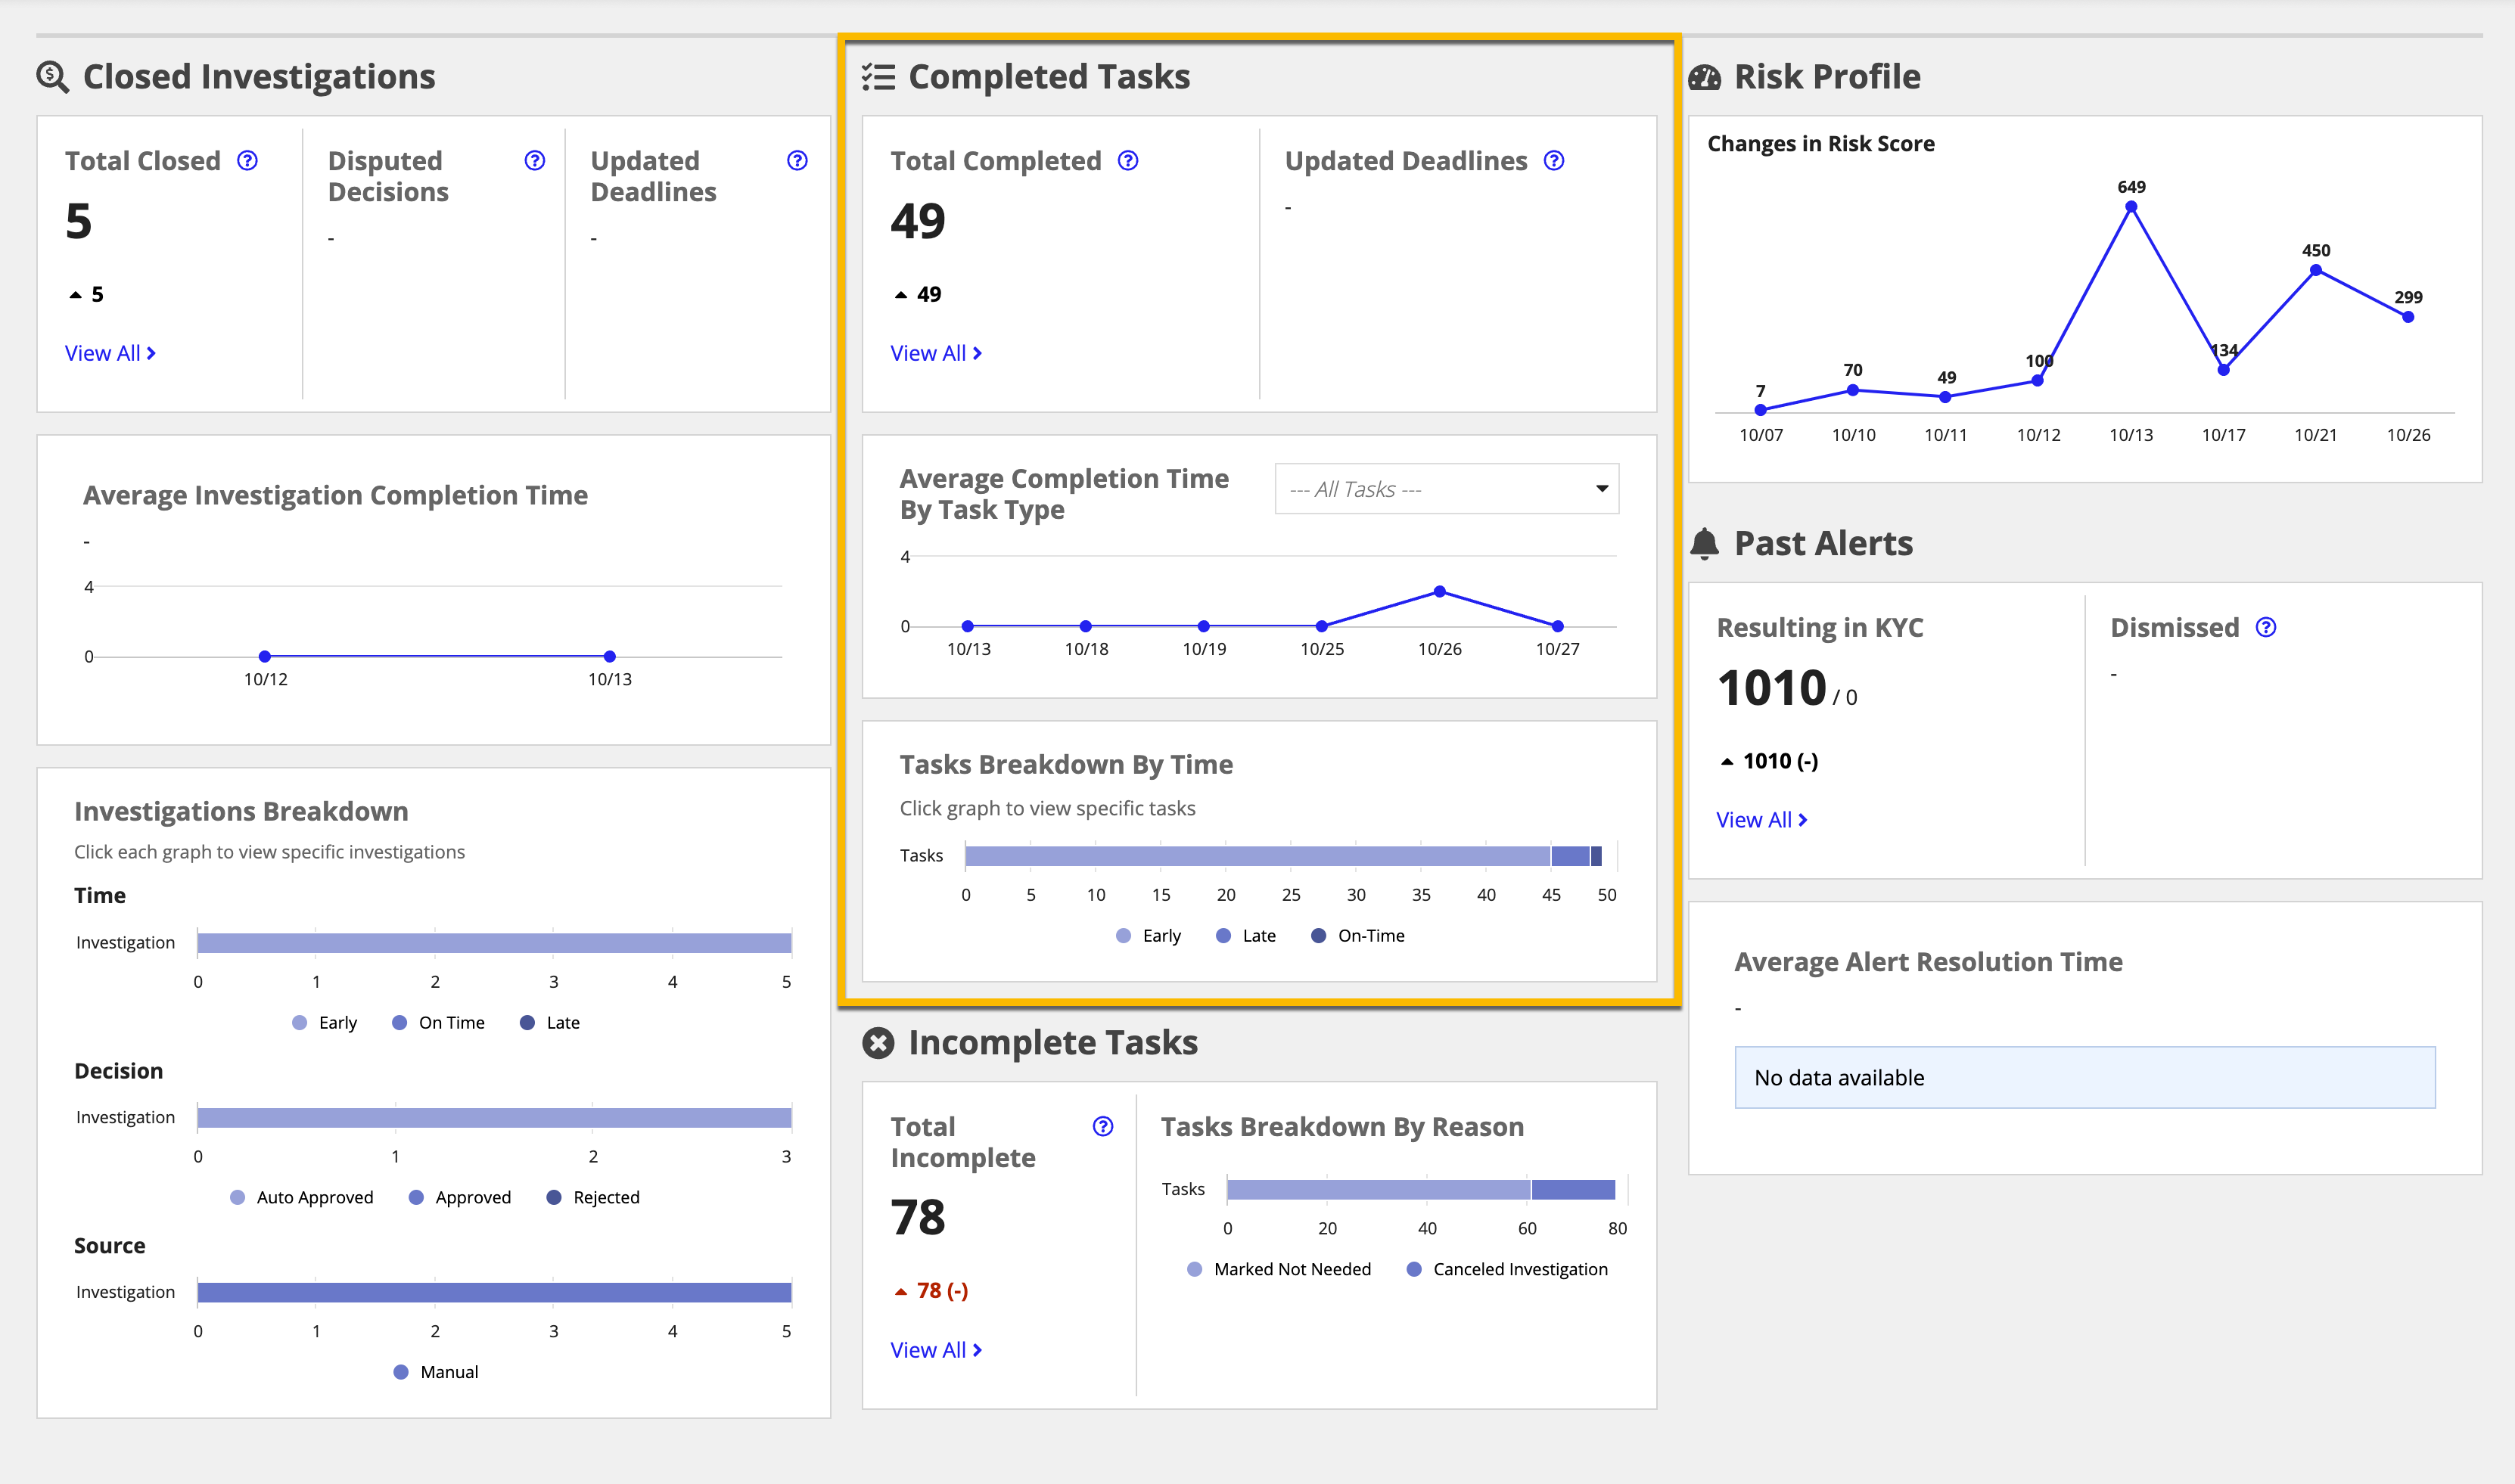
The Total Completed, Updated Deadlines section shows how many tasks were completed or had their deadlines updated prior to completion.
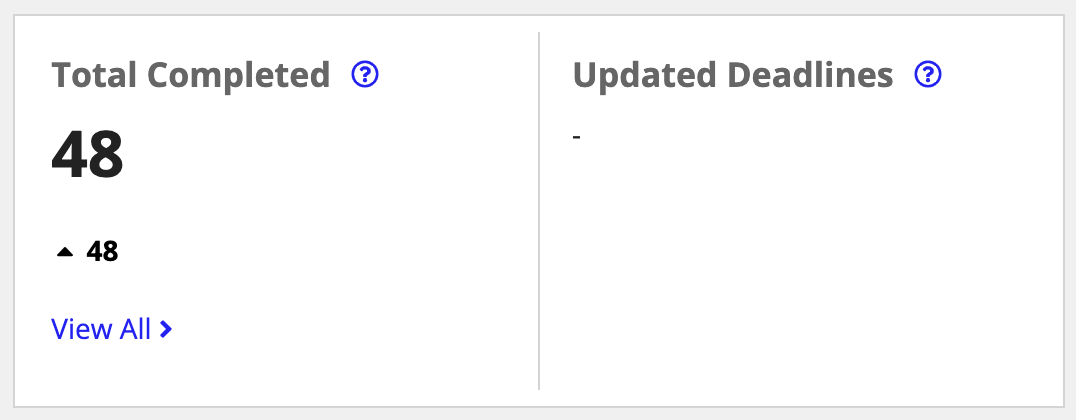
In this section, you see:
The Average Completion Time By Task Type section shows the average time needed to complete tasks, filterable by the specific tasks.
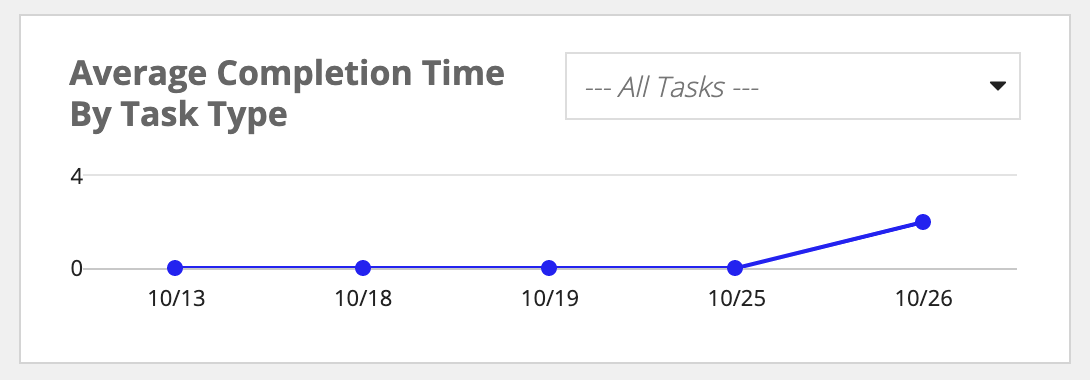
In this section, you see:
The Tasks Breakdown By Time section shows a detailed breakdown of completed tasks.
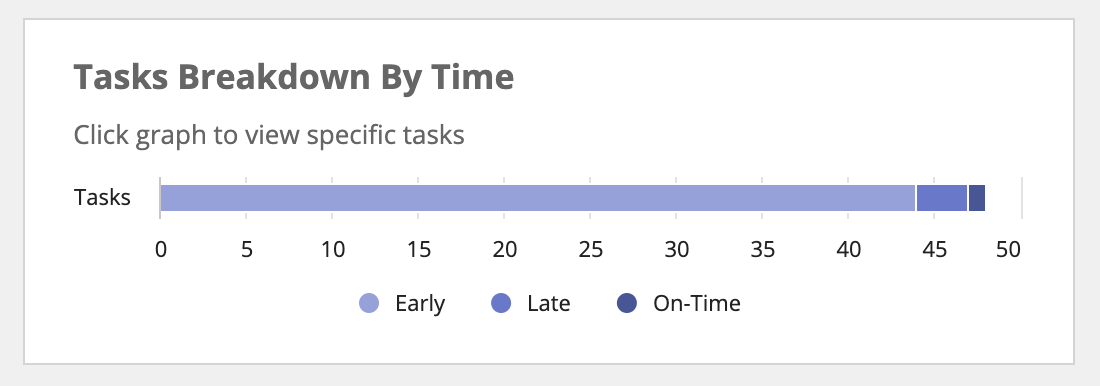
In this section, you see:
Some questions that this data can answer are:
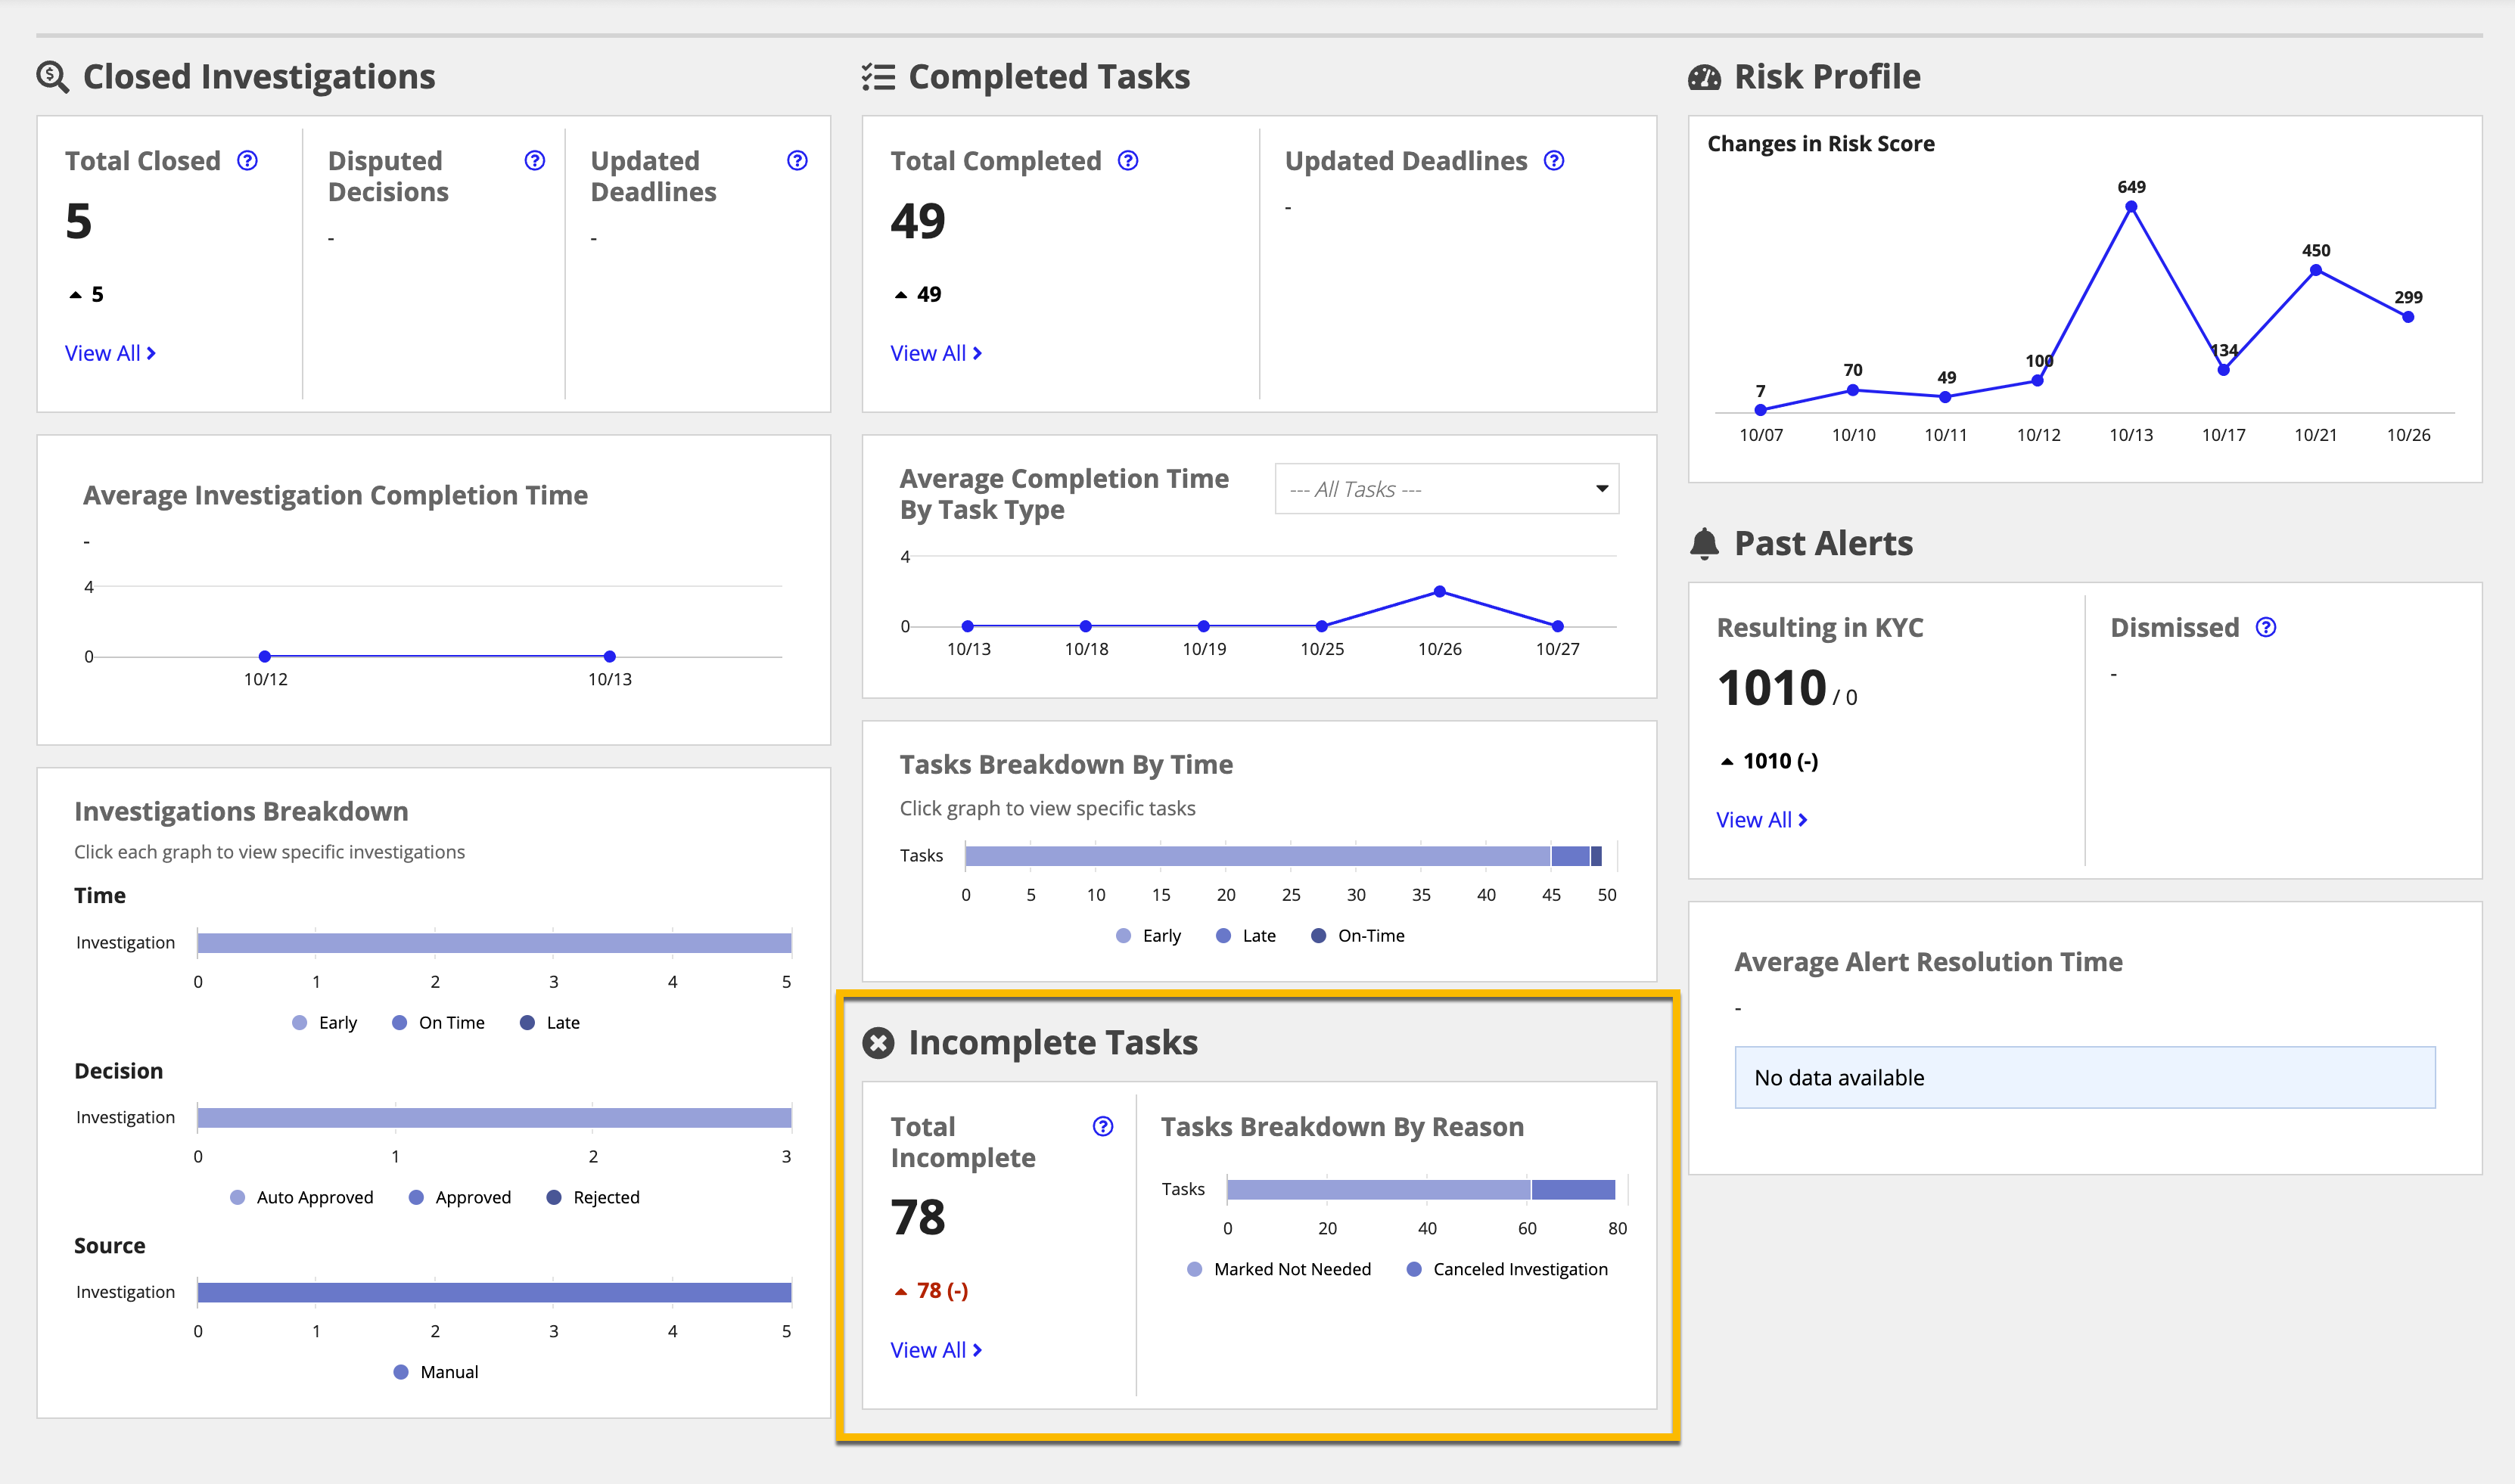
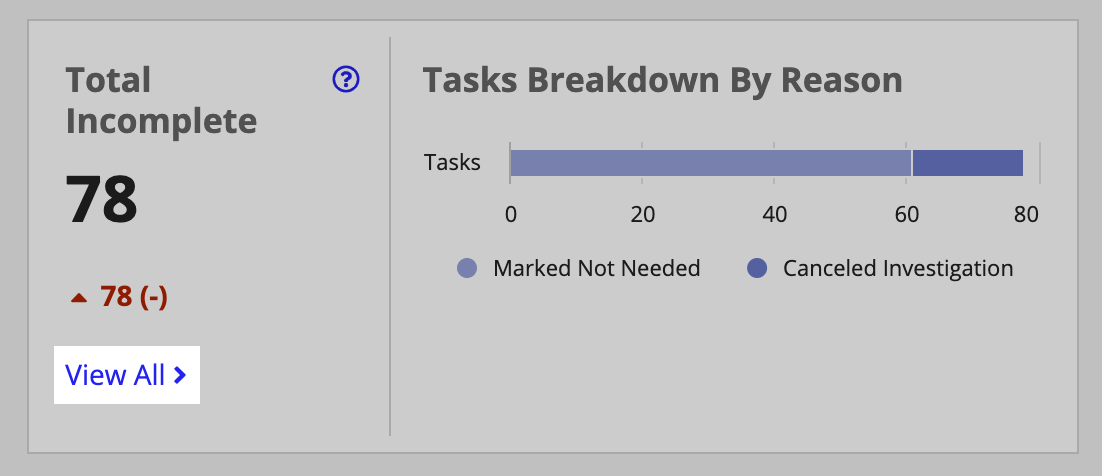
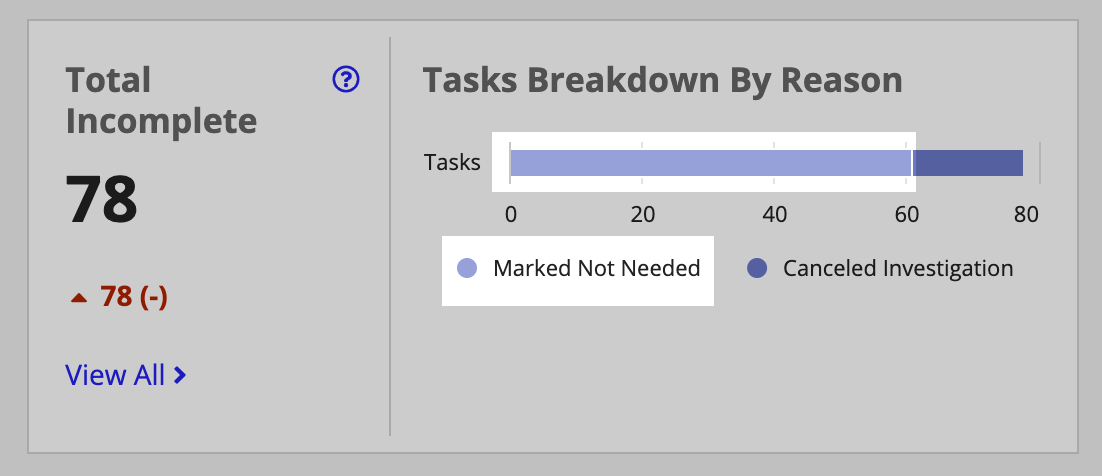
The Total Incomplete, Tasks Breakdown By Reason section shows how many tasks were not completed, and a breakdown of the reasons why they were not completed.
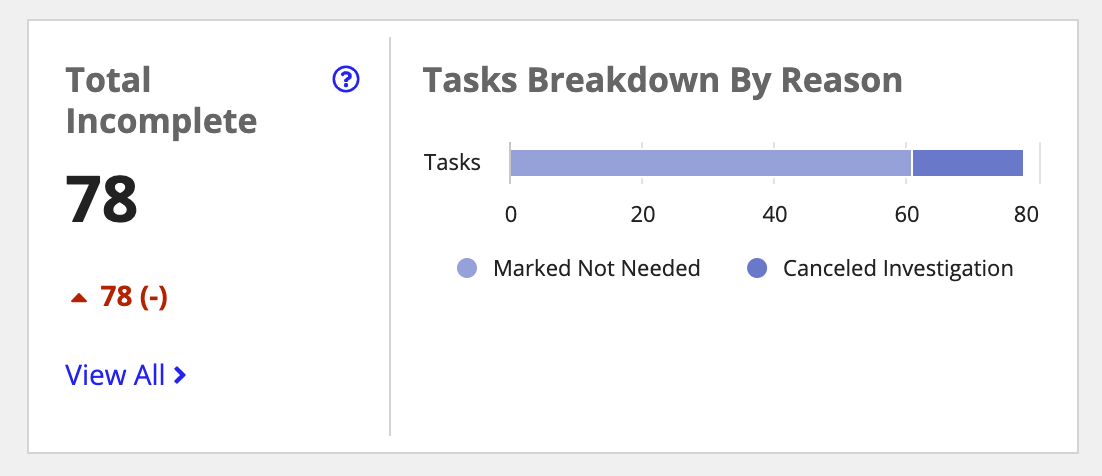
In this section, you see:
The charts and figures in the Risk reports section give insight into risks and alerts. Some questions that this data can answer are:
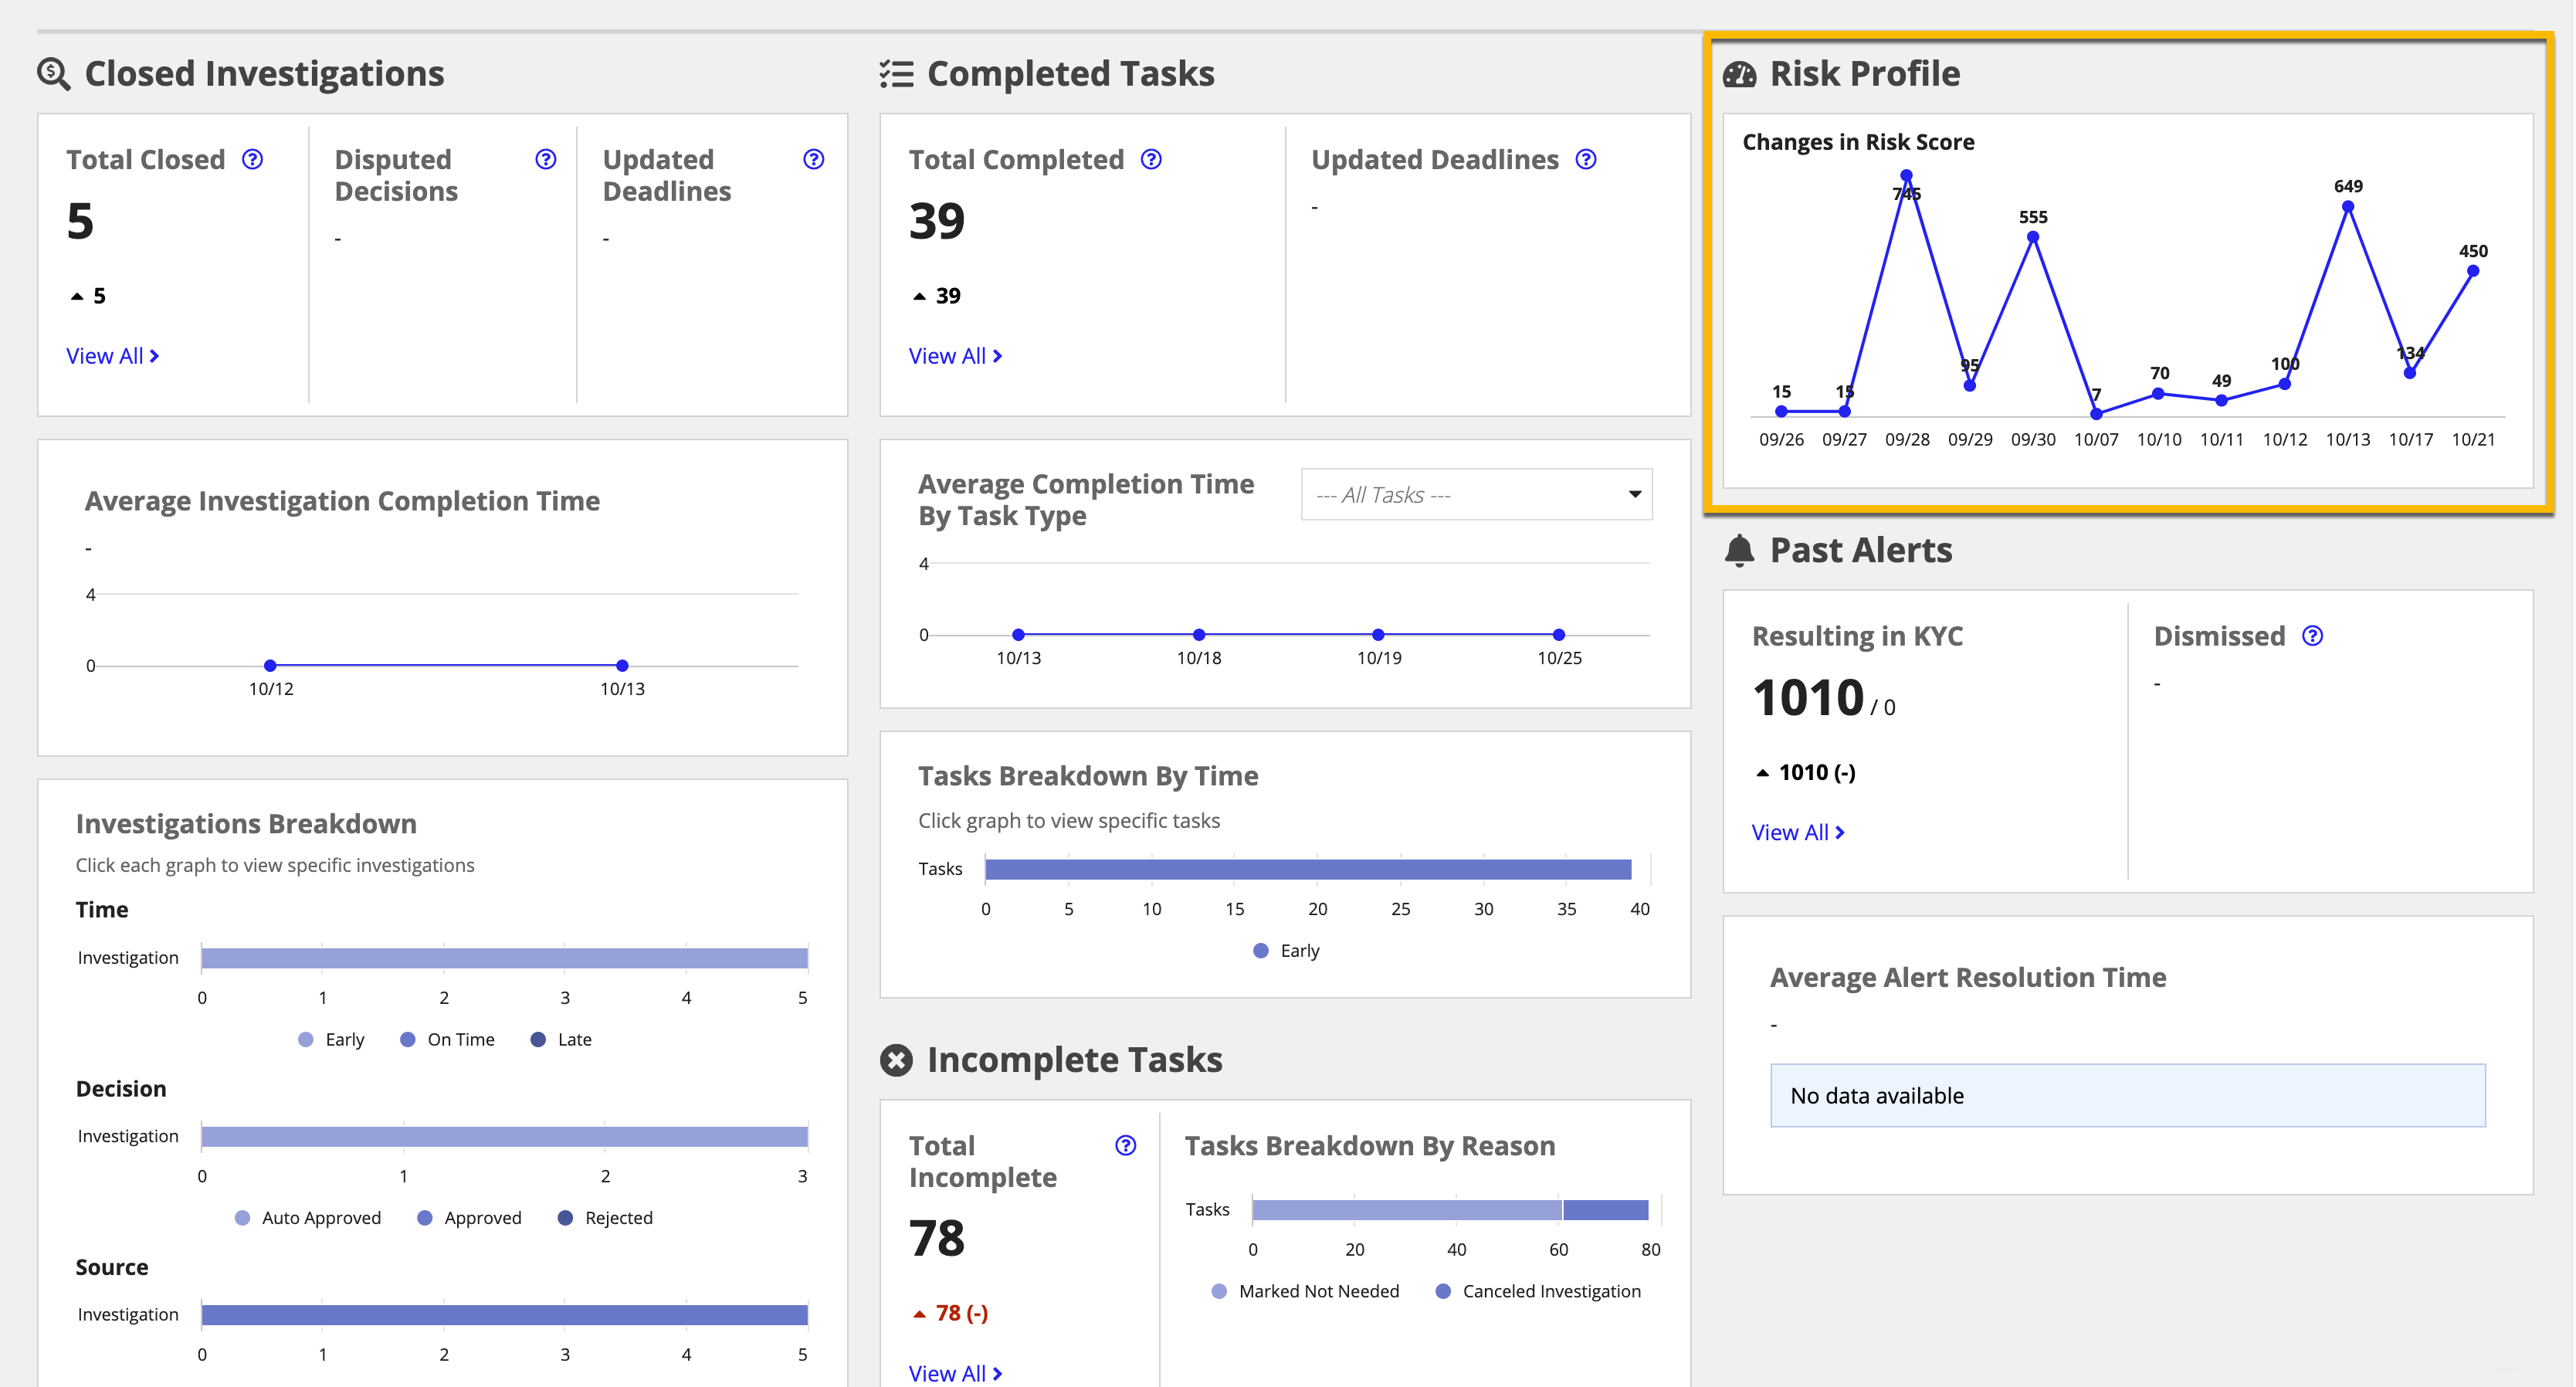
The Changes in Risk Score section shows a risk score associated to current customers and how it has fluctuated over time.
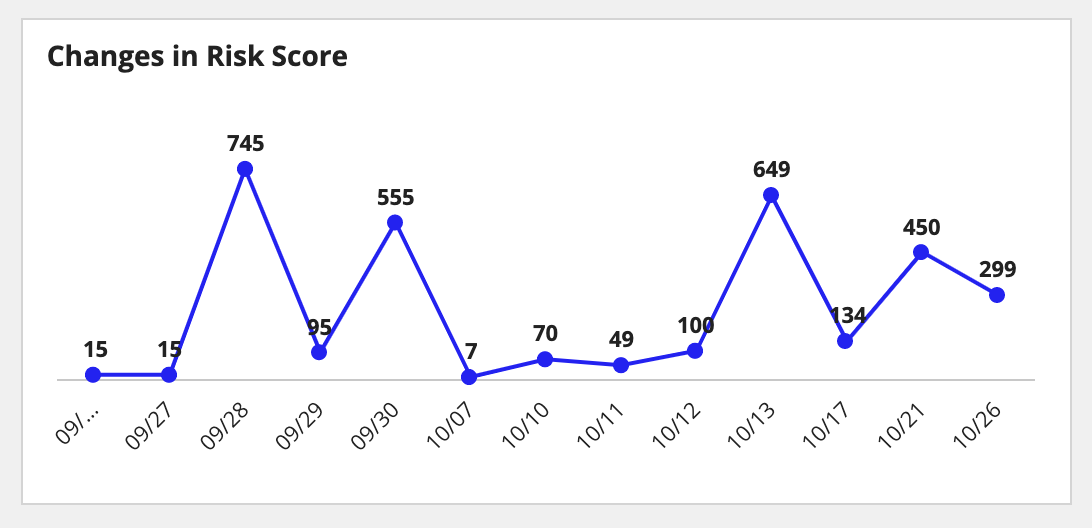
In this section, you see:
The charts and figures in the Alert reports section give insight into risks and alerts. Some questions that this data can answer are:
The Resulting in KYC, Dismissed section shows the number of alerts that have been received and whether they resulted in a KYC investigation or were dismissed.
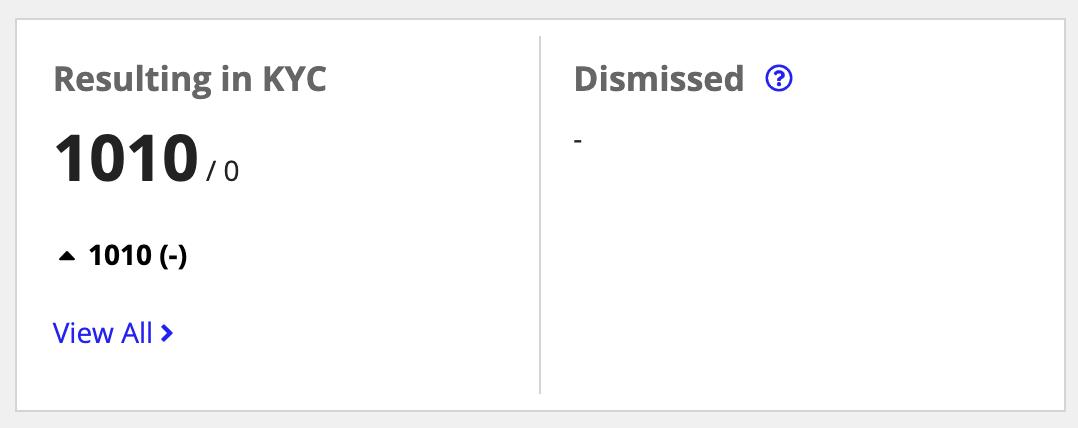
In this section, you see:
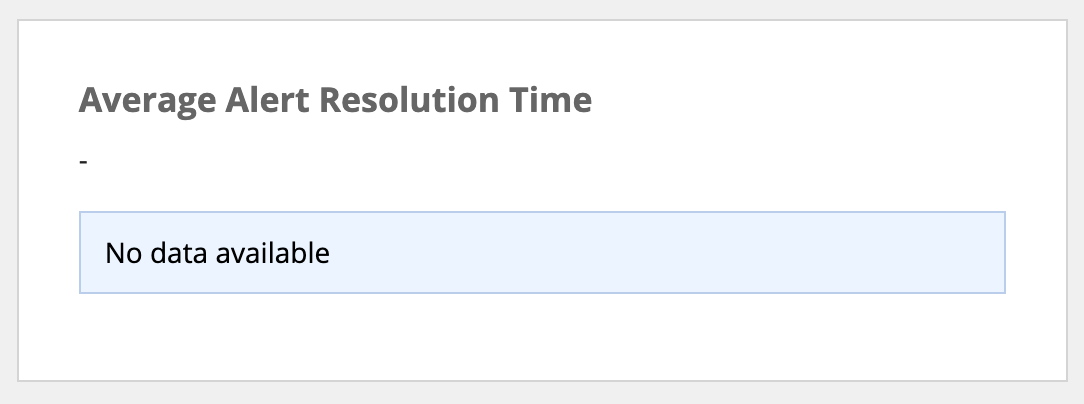
The Average Alert Resolution Time sections shows the average time needed to resolve alerts.
In this section, you see:
Viewing KYC Reports
