| This content applies solely to Workforce Safety, which must be purchased separately from the Appian base platform. This content was written for Appian 21.4 and may not reflect the interfaces or functionality of other Appian versions. |
The Response Hub in Workforce Safety allows certain users to see and manage the health and work status of employees and facilities in one central location that's updated in real-time.
The Response Hub is organized into Incidents, Activity, People, Reports, and Configure pages.
This page describes what information and actions are in the Response Hub.
Every organization should have a response manager that oversees the day-to-day activities of the Response Hub. Your organization can also decide to use any or all of the following personas that have access to different information and actions in the Response Hub.
| Persona | Description | Group |
|---|---|---|
| Response Managers | Response managers respond to incidents and manage COVID-19 testing and contact tracing for their organization. They can also view reports for their people, facilities, and incidents to provide real-time insight into the situation. Additionally, they can tailor the application to suit the organization's needs. | Workforce Safety Response Managers |
| Coordinators | If the Community Volunteering and Help Requests feature is toggled on, members of this group can see all incoming help requests and match them to volunteers. They can also view reports to see how they can best distribute resources to those in need. | Workforce Safety Coordinators |
| Screeners | Members of this group can scan user passes and request passes on behalf of users. | Workforce Safety Screeners |
| Facility Managers | Facility managers can help take on the responsibility of maintaining the facilities, departments, and areas for an organization. | Workforce Safety Facility Managers |
| Configuration Managers | Configuration managers can tailor the application to suit the organization's needs without seeing user data. | Workforce Safety Configuration Managers |
| Administrators | Administrators can configure Data Management to archive data and can add and remove users from groups. Although they have access to the Response Hub to perform these functions, they can't see any of the data in the Response Hub. | Workforce Safety Administrators |
See the Groups Reference Page for more information on which groups have access to what content in Workforce Safety.
Administrators can configure data management to automatically archive data after a defined period of time. This can optimize Workforce Safety performance and improve the user experience.
If you think you are missing data in a Response Hub report, contact an administrator. They have the ability to restore any archived data, as well as tell you which data is being archived.
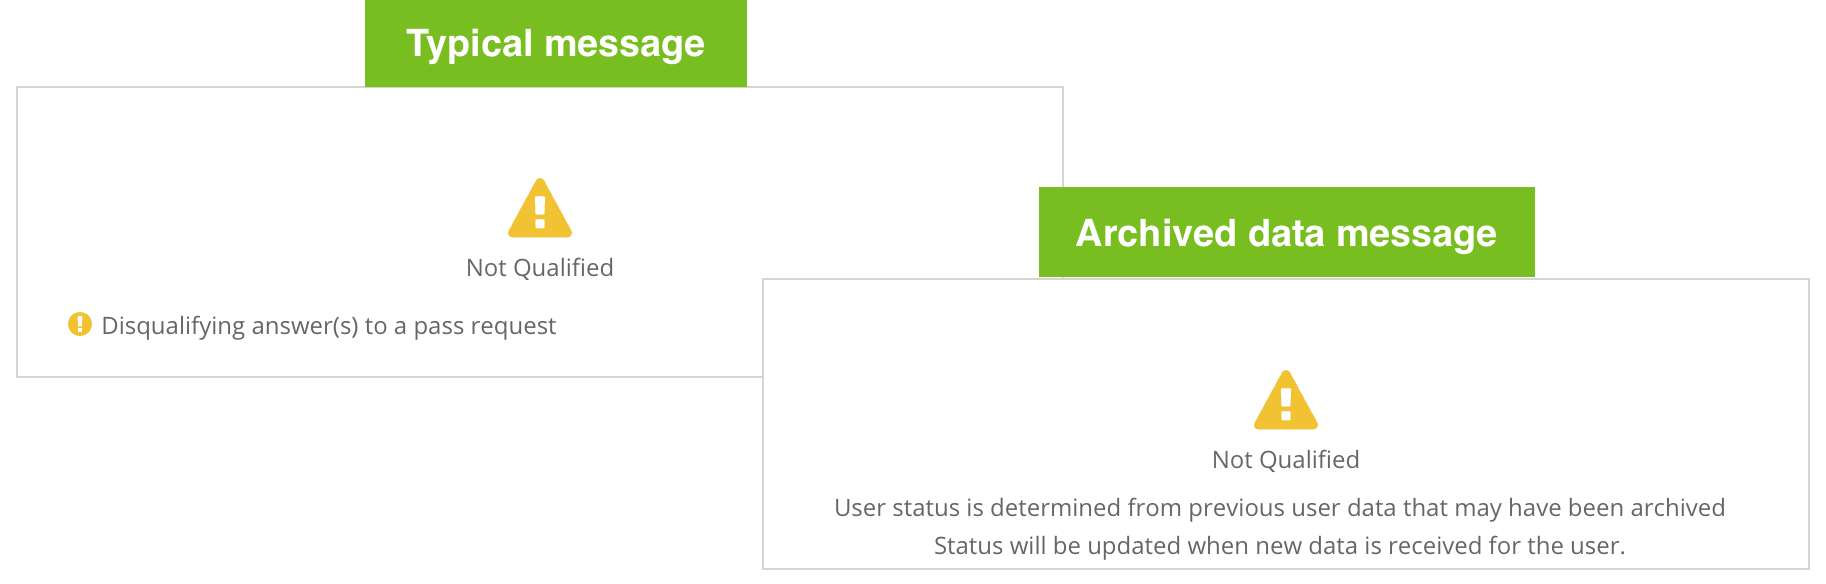
Additionally, when data is archived that affects a user's status, their status will remain the same, but the reason for that status may not be available. For example, if a user is in a Not Qualified status, but their last pass request is archived, the reason for why they were in that state cannot be displayed.
Incidents are how you resolve issues for your employees. They can be created automatically, such as through questionnaire responses, or manually to report issues or COVID-19 positive diagnoses, isolations, and exposures.
Incidents are so important to how you manage crises, that we put it front and center in the Response Hub.
When you log in to the Response Hub, the INCIDENTS page displays. From here, you can view all incidents that have been reported for your organization and review a queue of vaccination verifications from your employees.
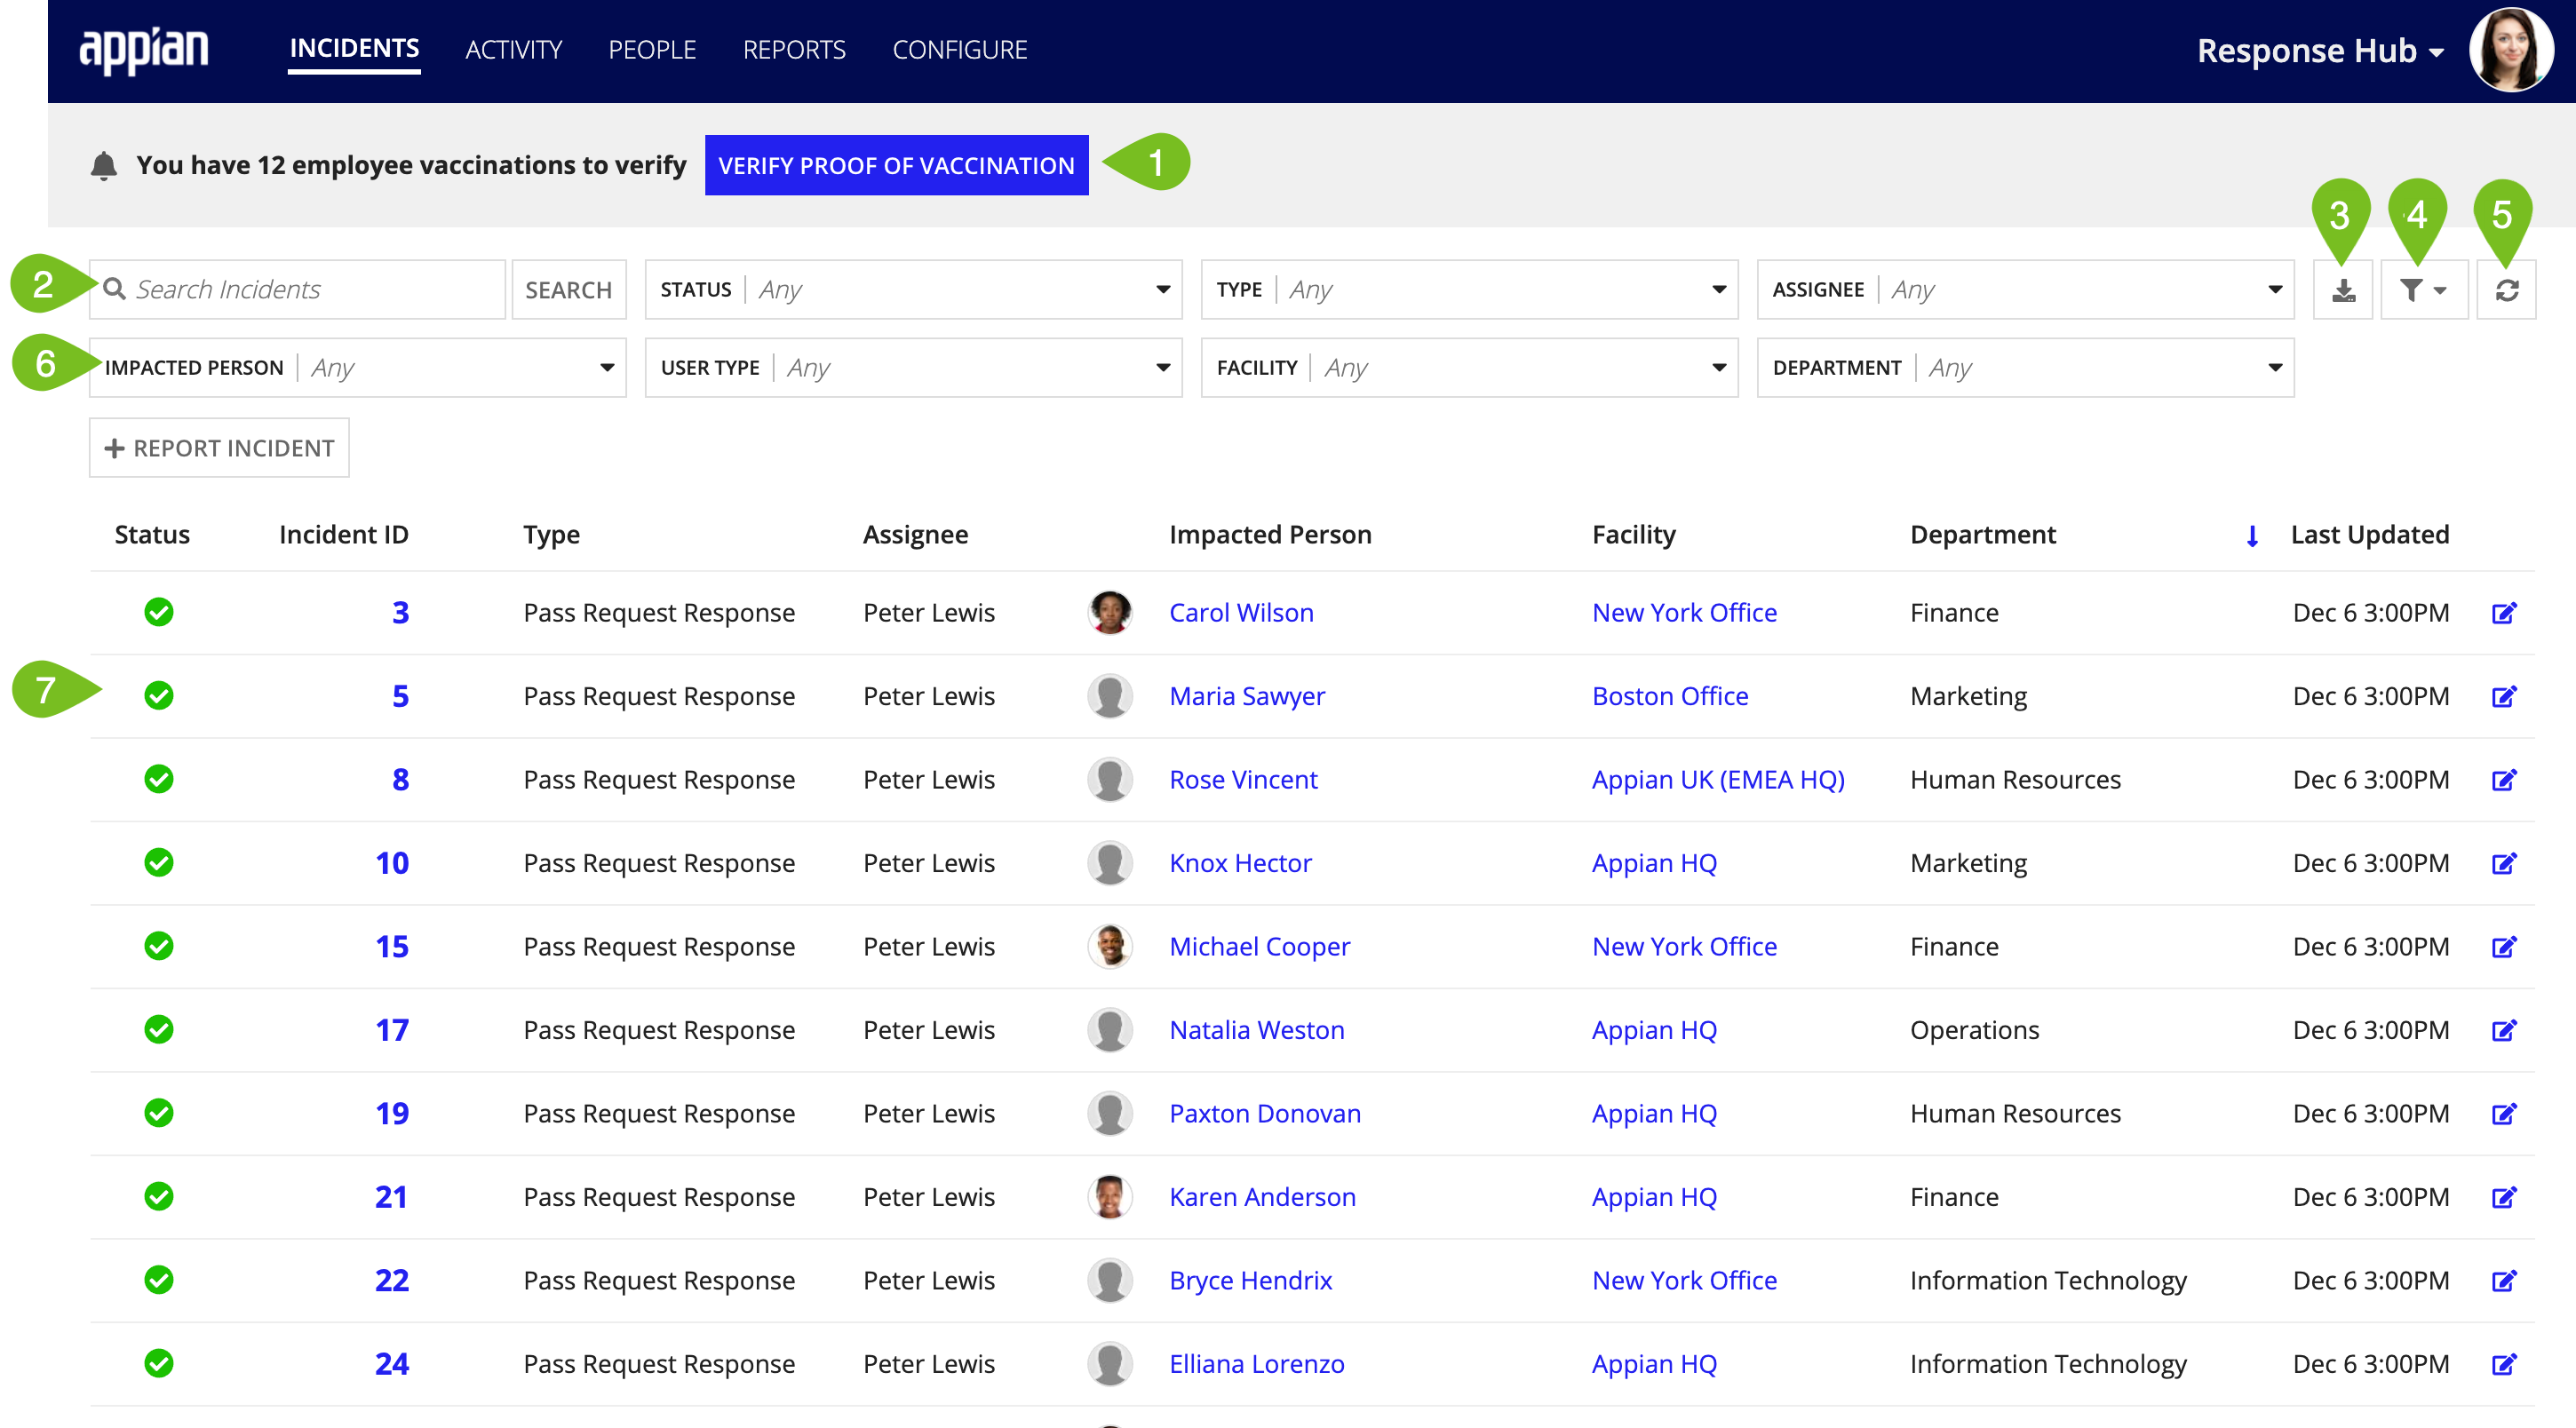
On this page you can:
The ACTIVITY page contains the following tabs and information:
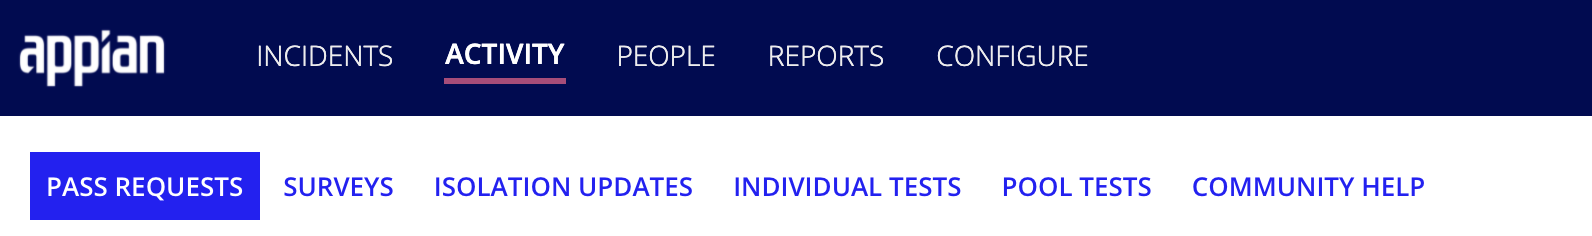
The PASS REQUESTS tab shows all of the pass requests that have been submitted for your organization.
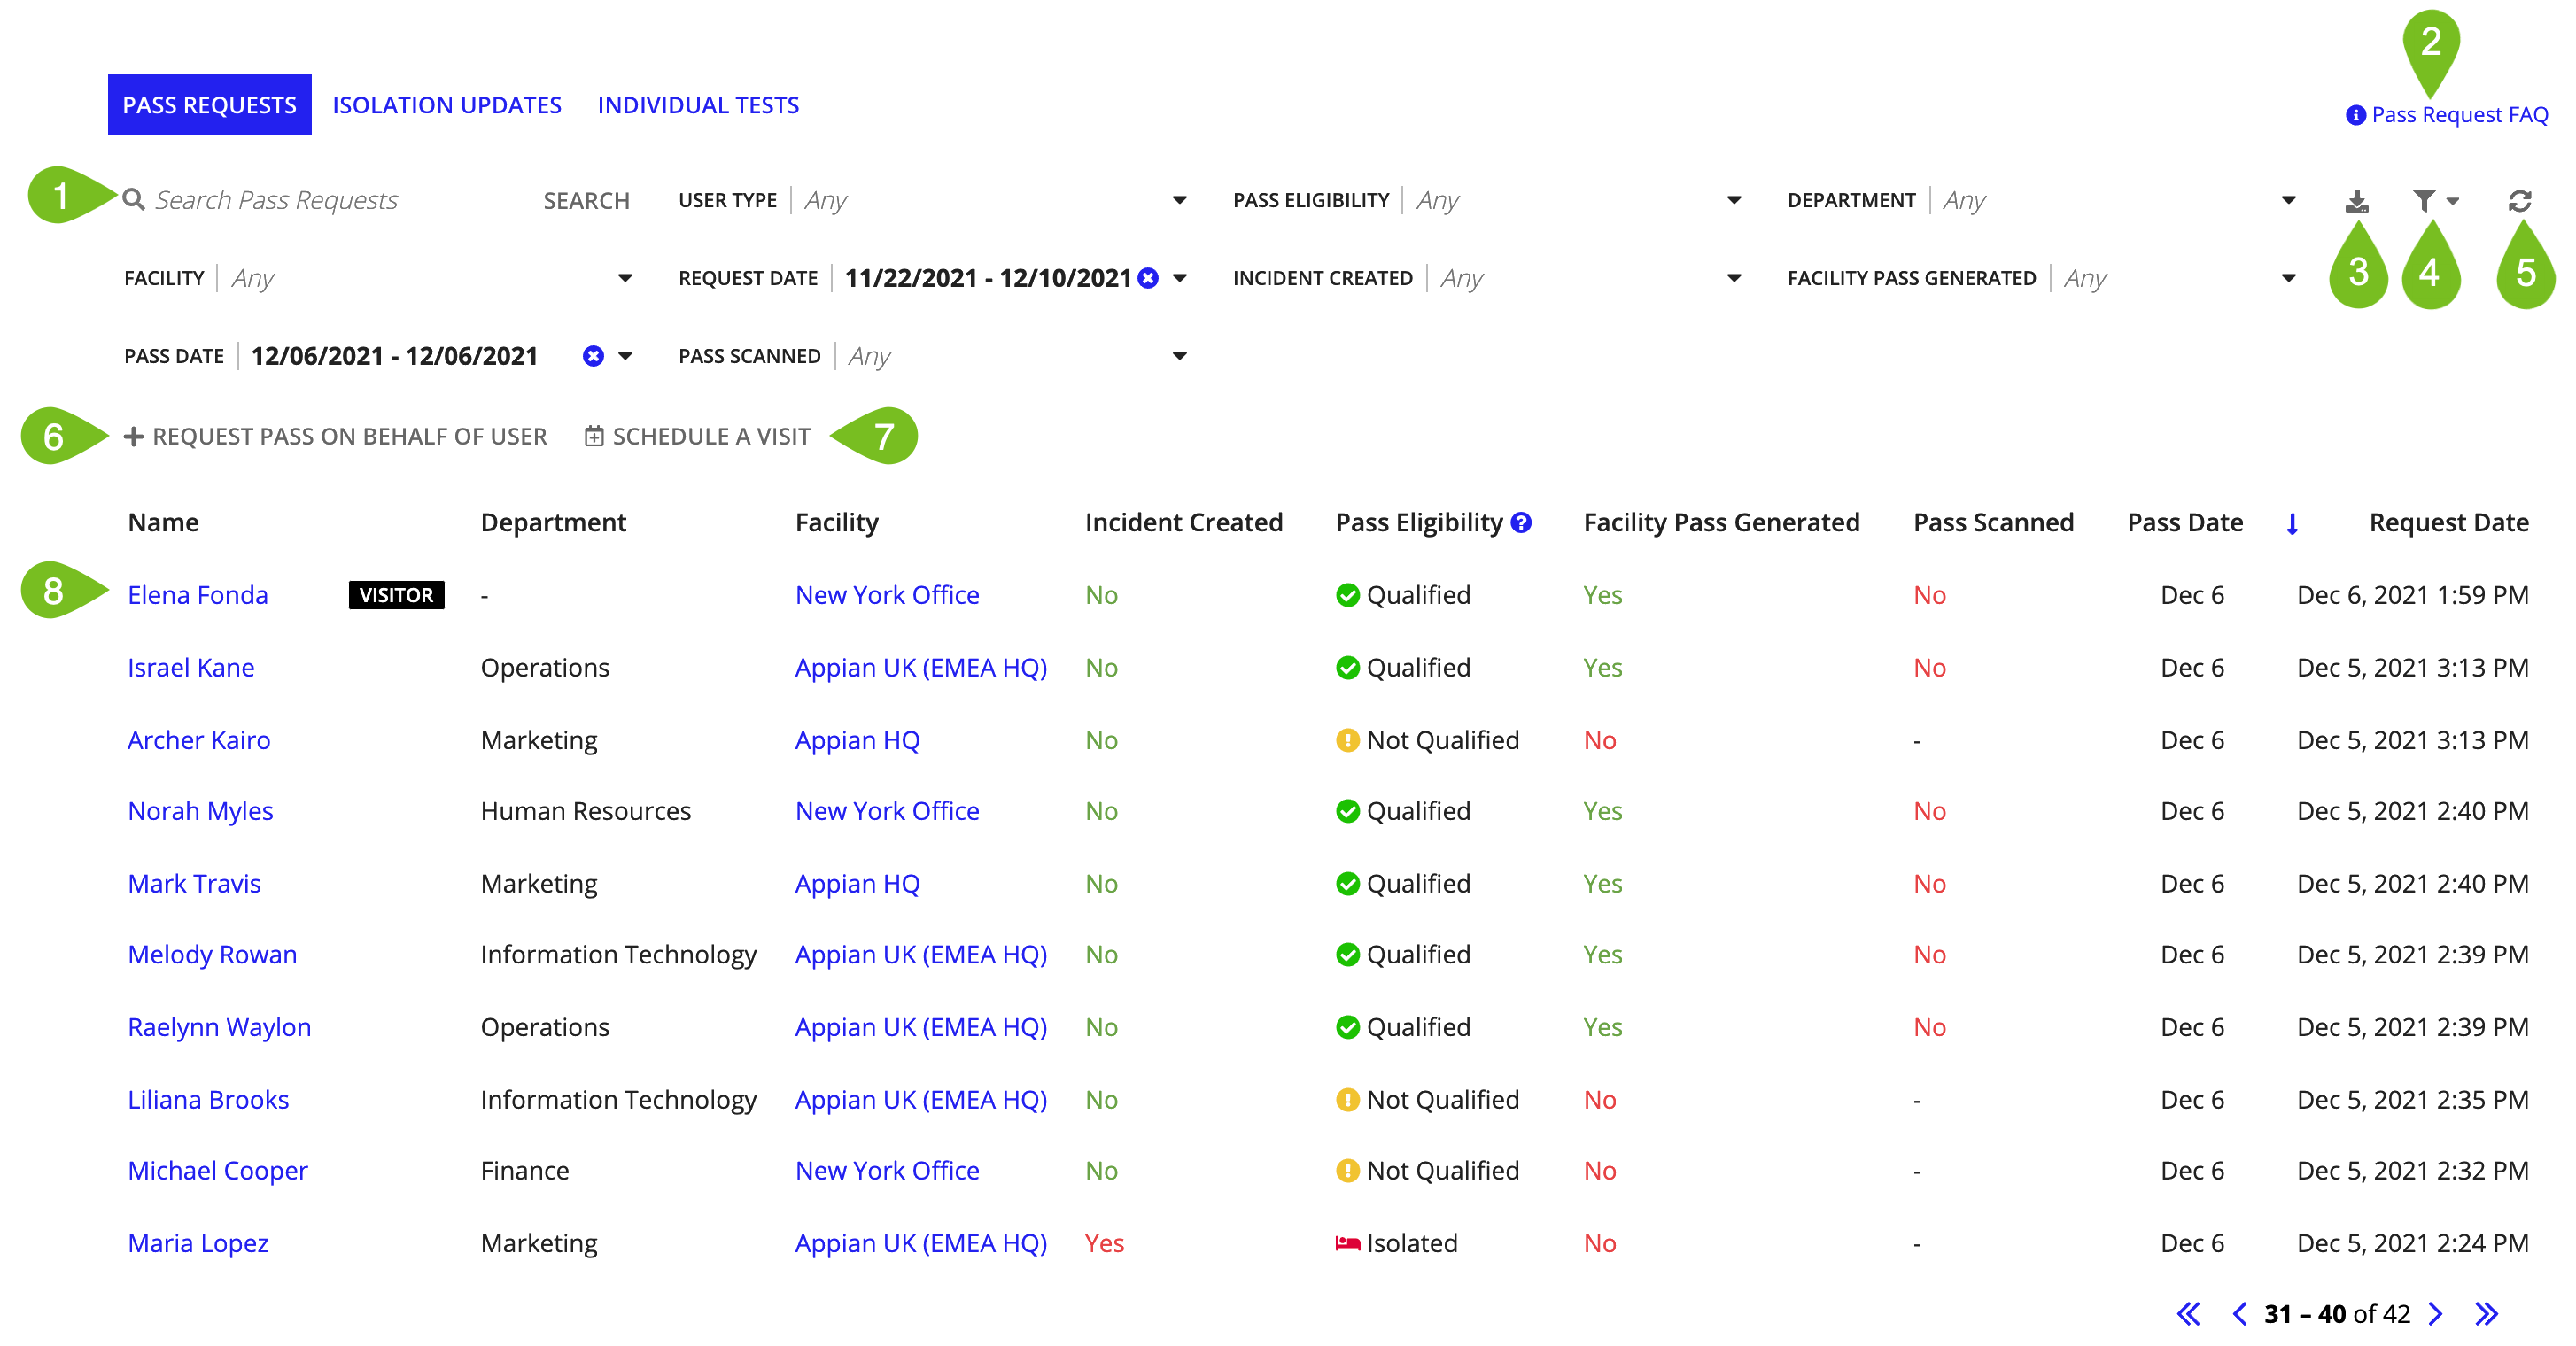
From this tab, you can:
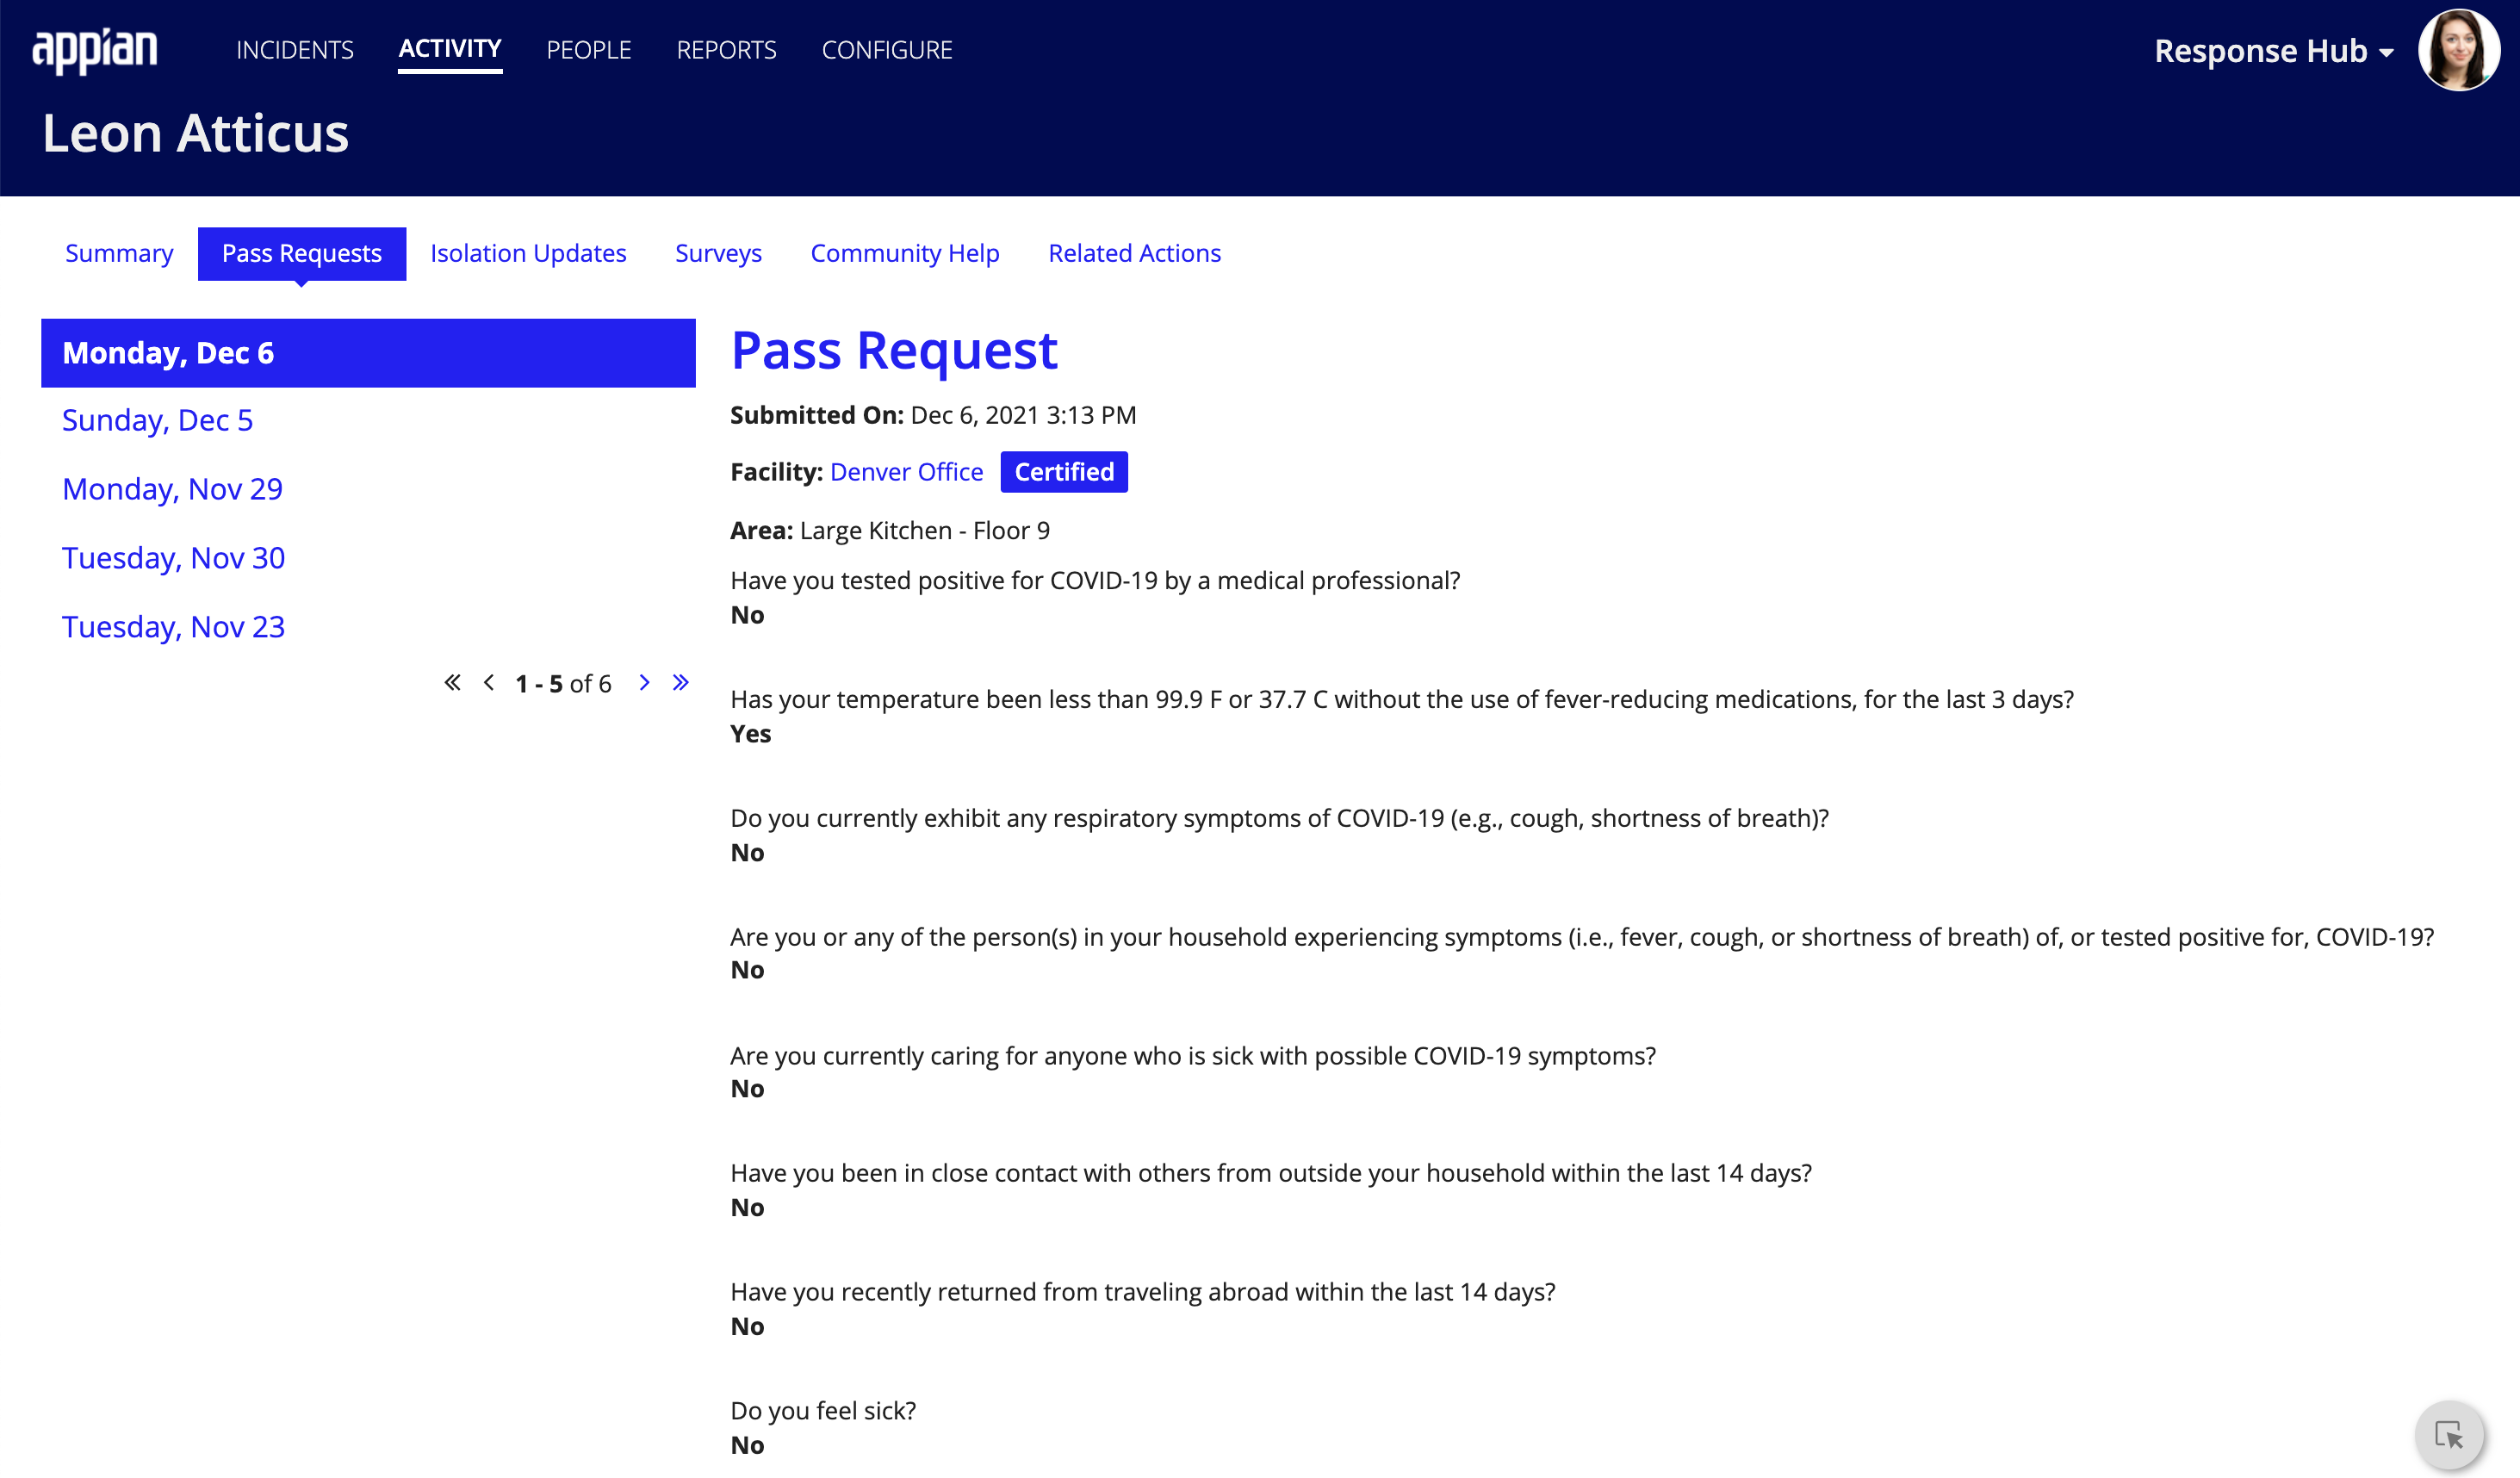
Access and view a user's pass requests details and history.
The SURVEYS tab displays all of the surveys that have been submitted for your organization.
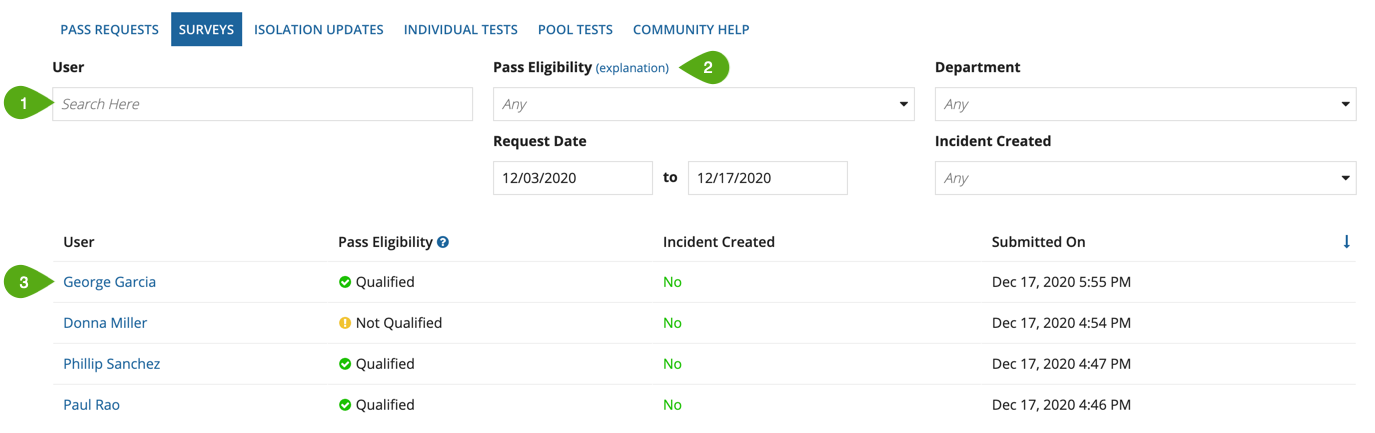
From this tab, you can:
The ISOLATION UPDATES tab displays all of the isolation updates that have been submitted for your organization.
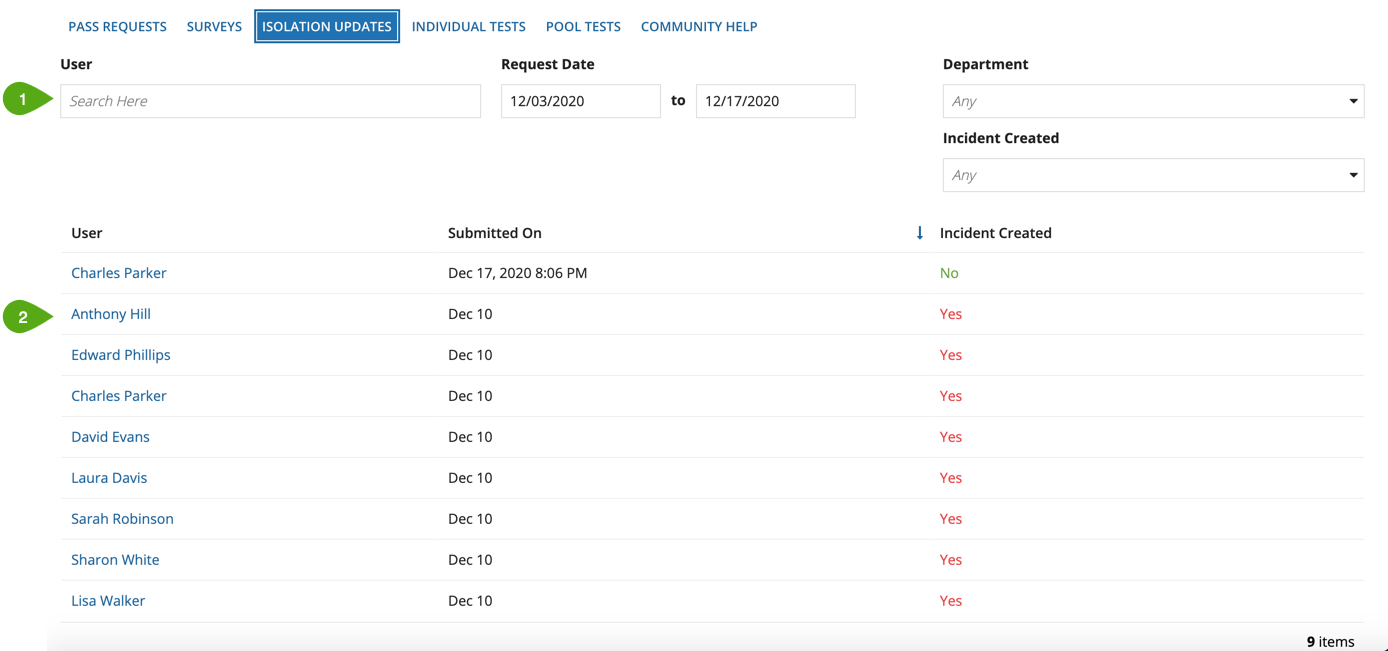
From this tab, you can:
There are two reports that contain all of the test requests in Workforce Safety: the INDIVIDUAL TESTS report and the POOL TESTS report.
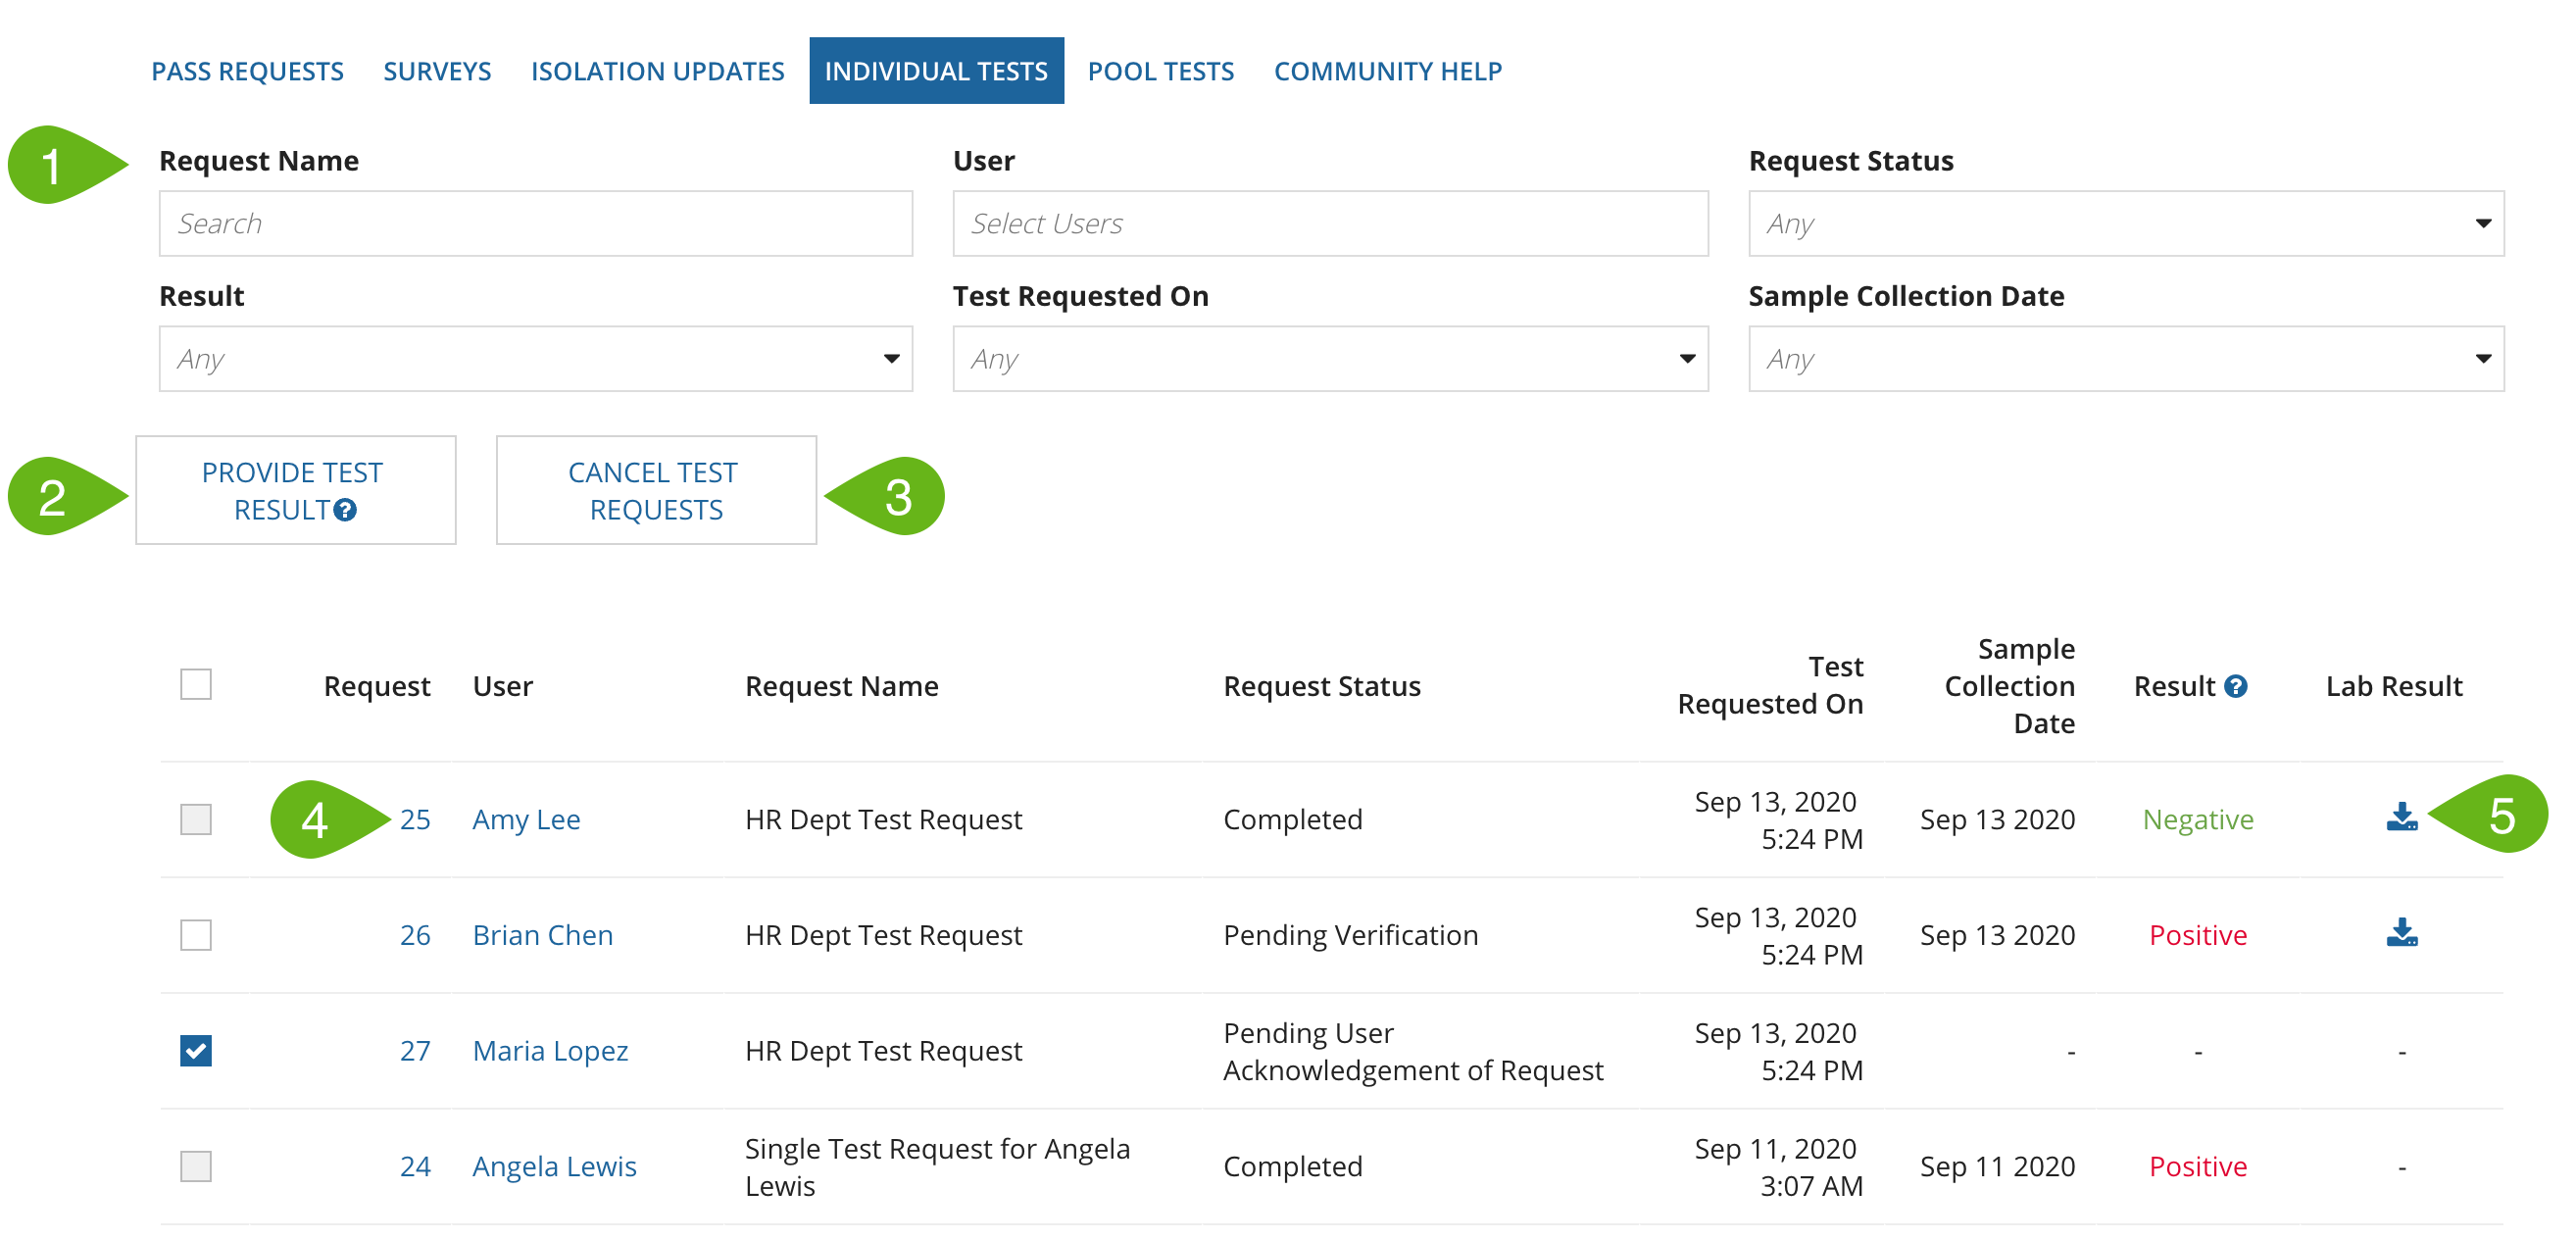
You can do the following on these reports:
COVID-19 test requests can be in the following statuses:
If the Community Volunteering and Help Requests feature is toggled on, you can use the COMMUNITY HELP report to help manage user help requests and volunteers.
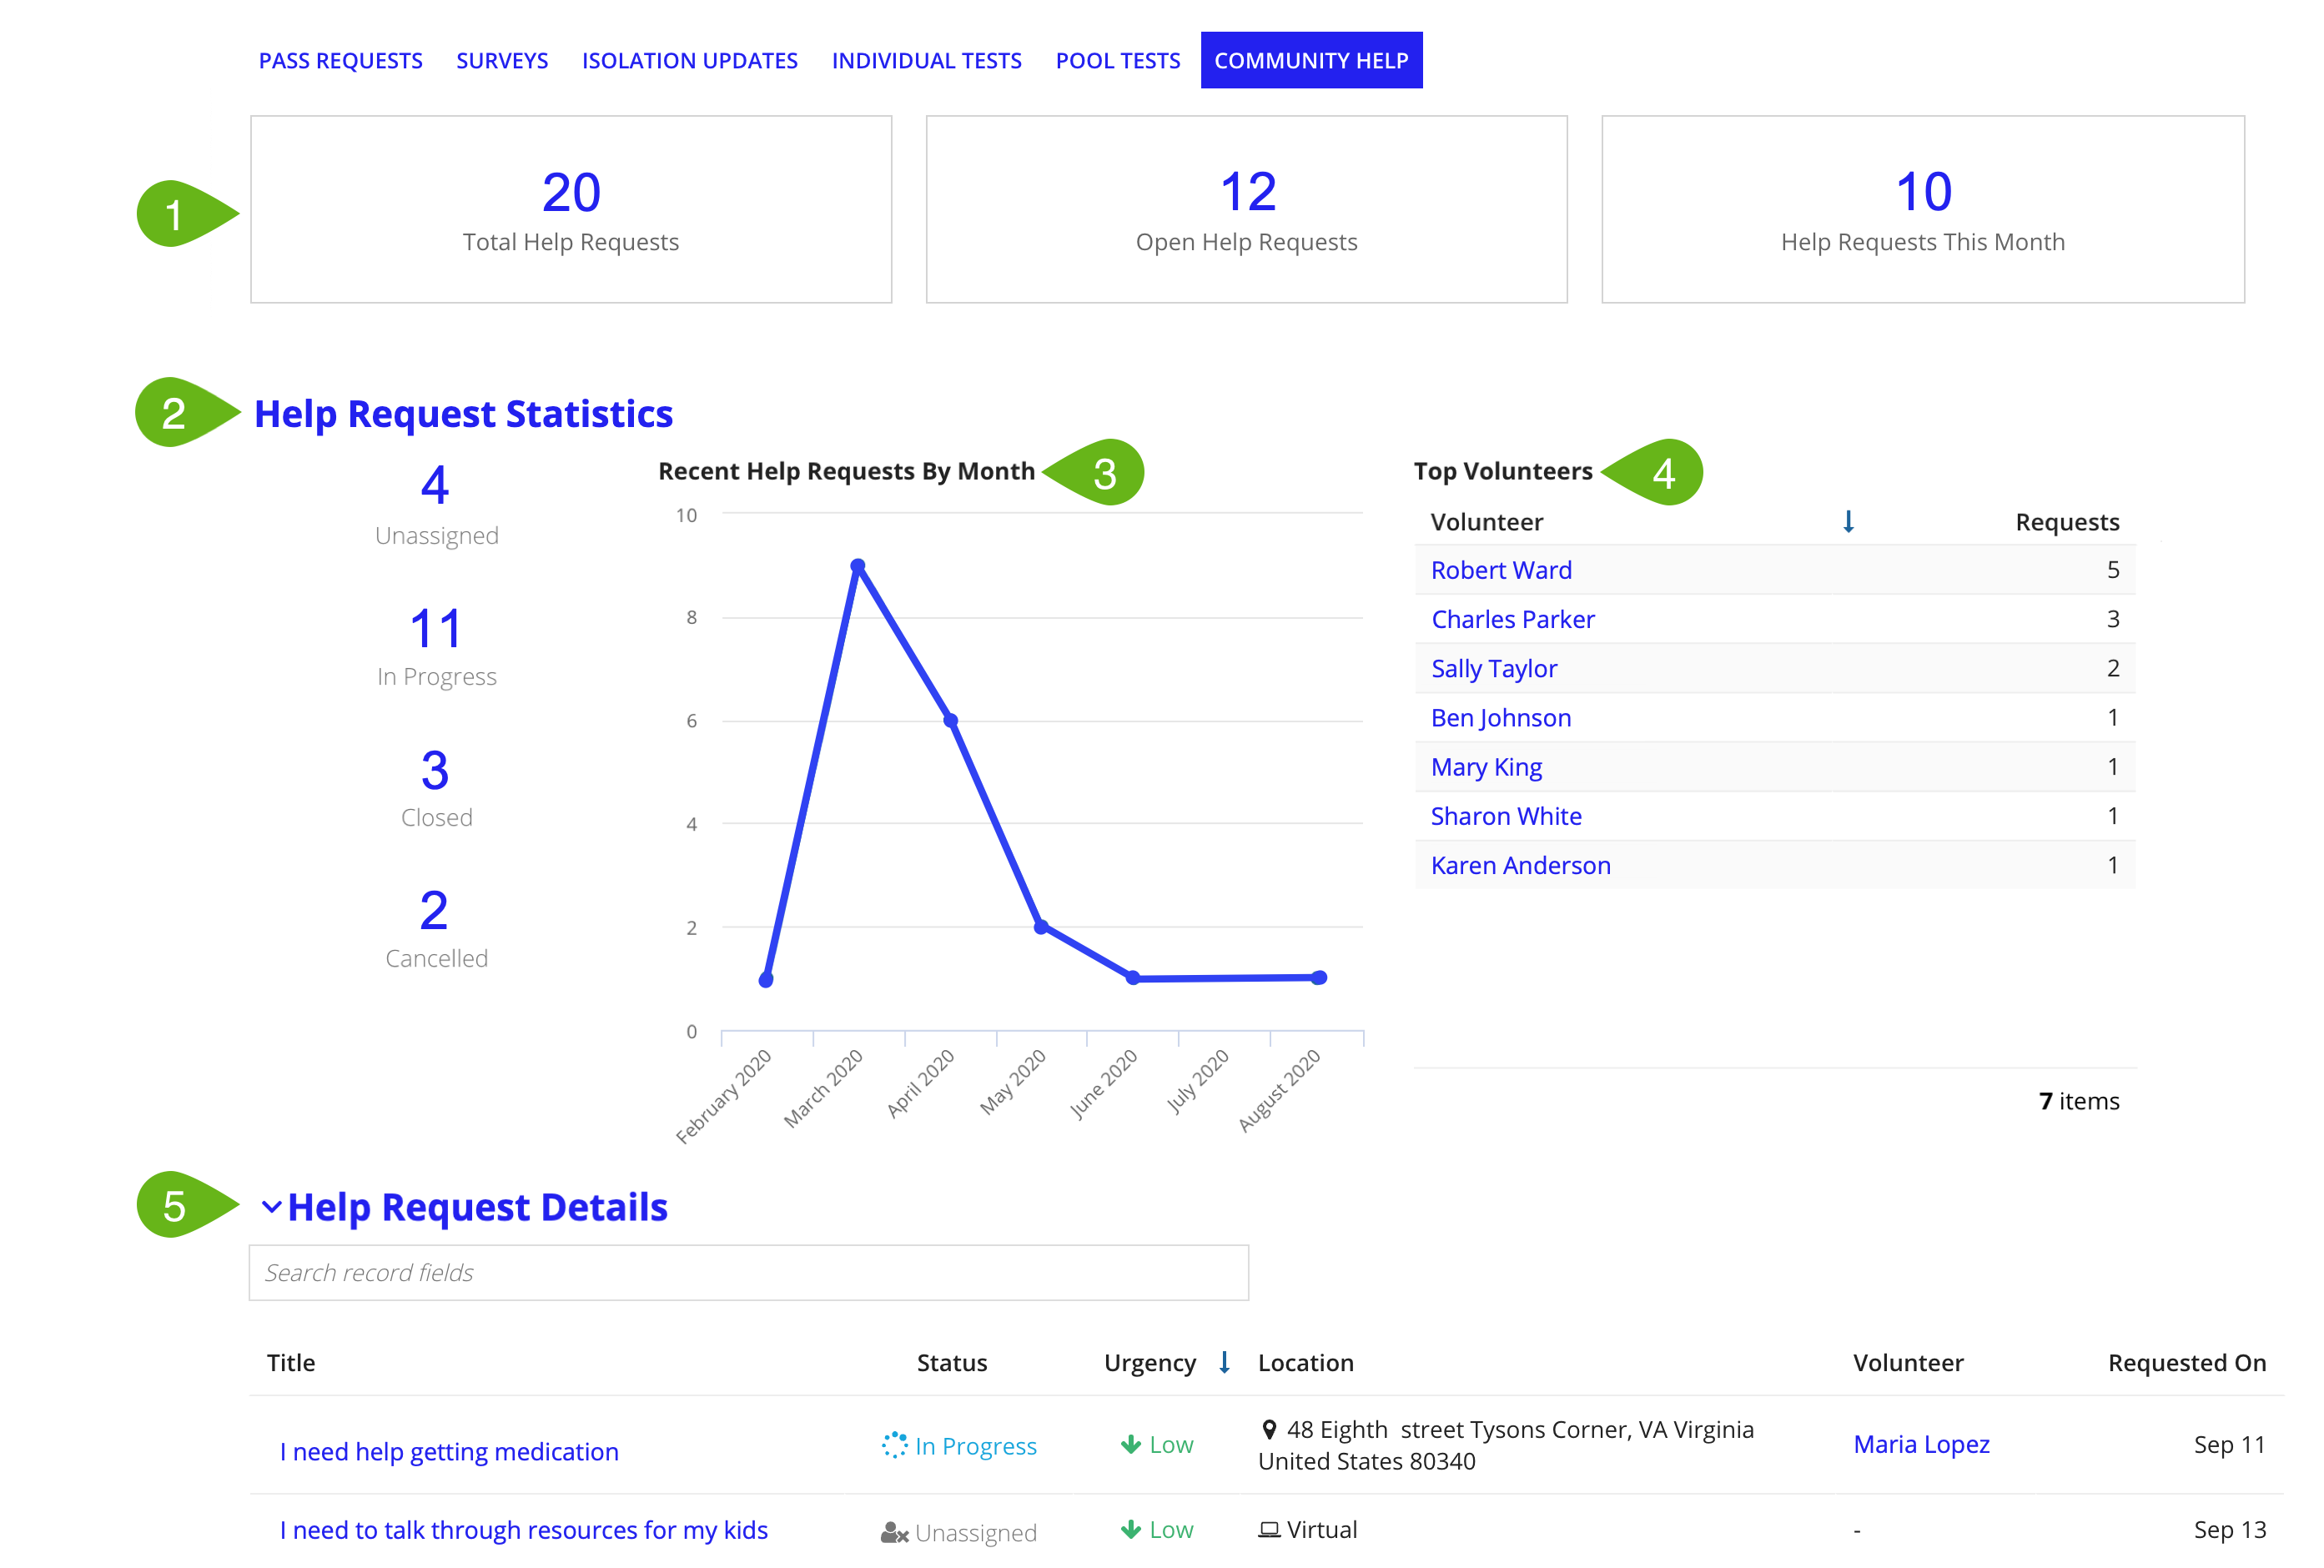
This report shows:
Clicking a help request title allows you to view the help request details.
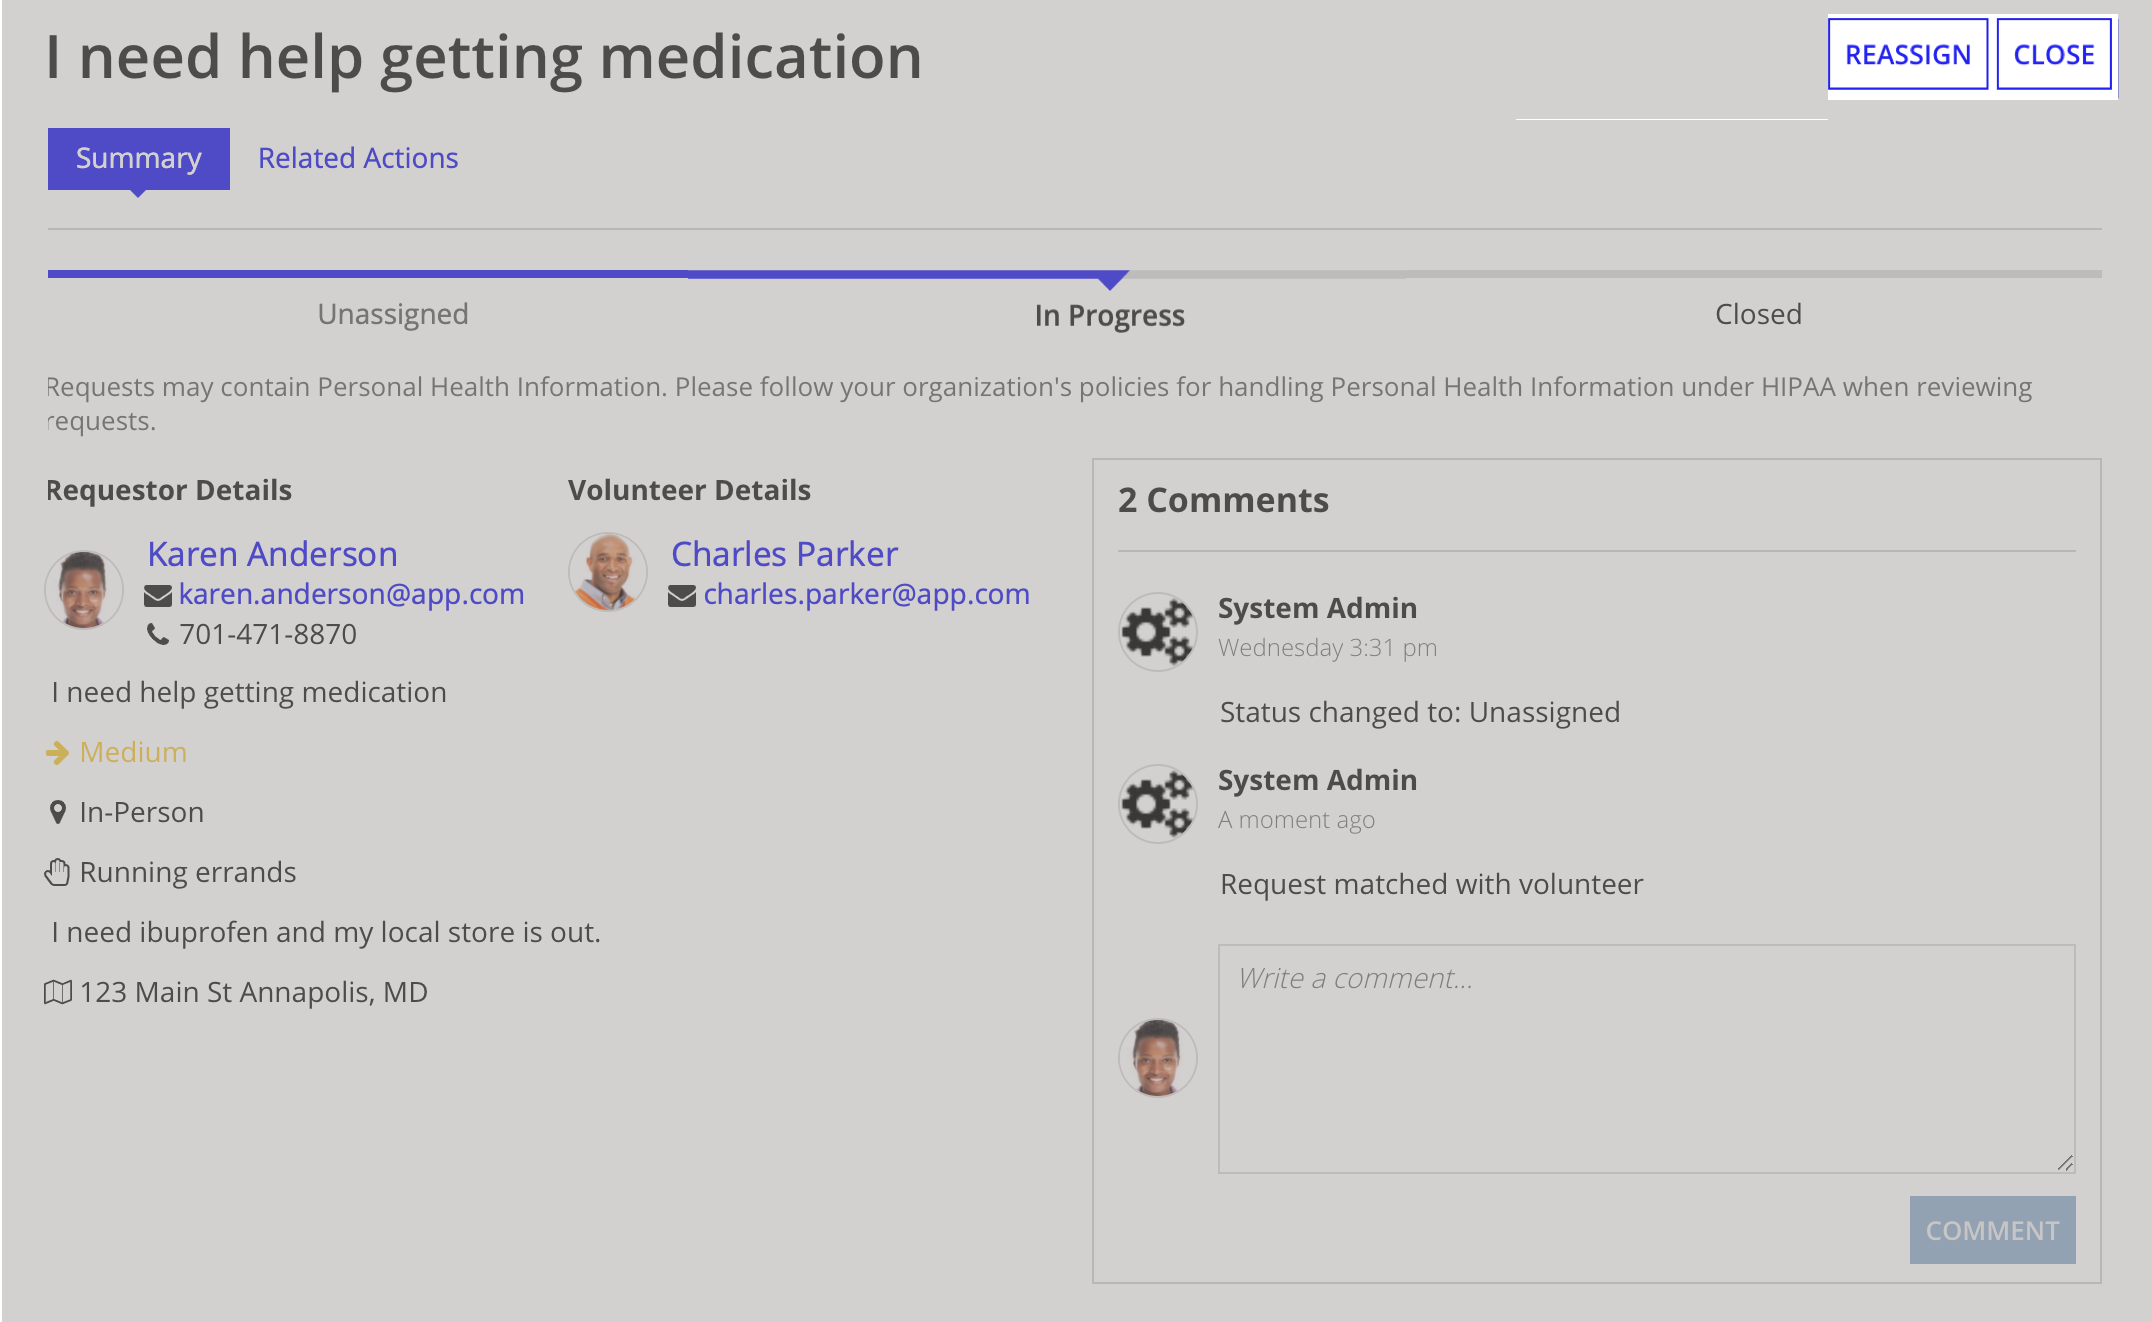
For each help request, there are several actions you can take:
Submitters of help requests, can UPDATE REQUEST, CANCEL, or CLOSE their own requests. A help request can only be updated or canceled by the original requestor.
The PEOPLE page displays all users in Workforce Safety.
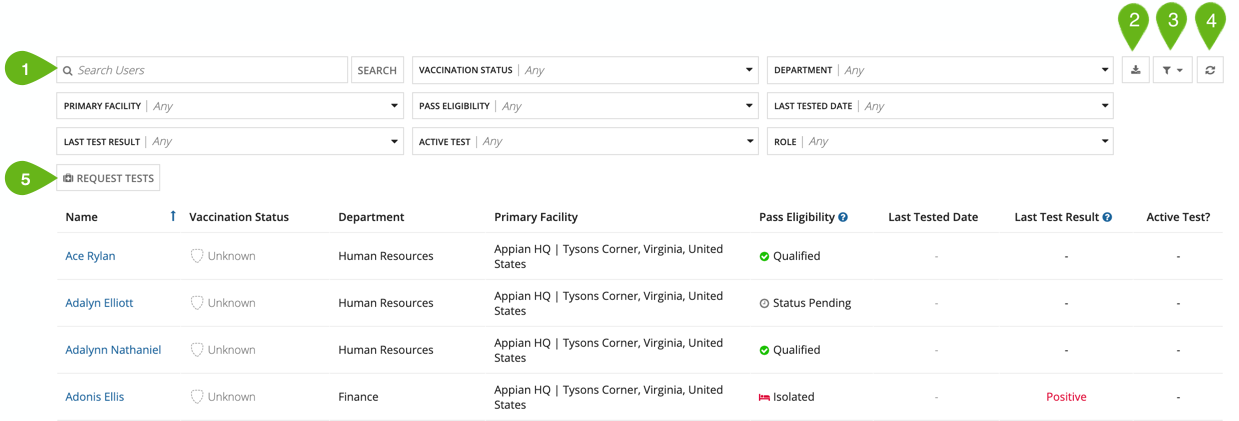
On this page you can:
You can also view the vaccination status and pass eligibility status of every user in Workforce Safety.
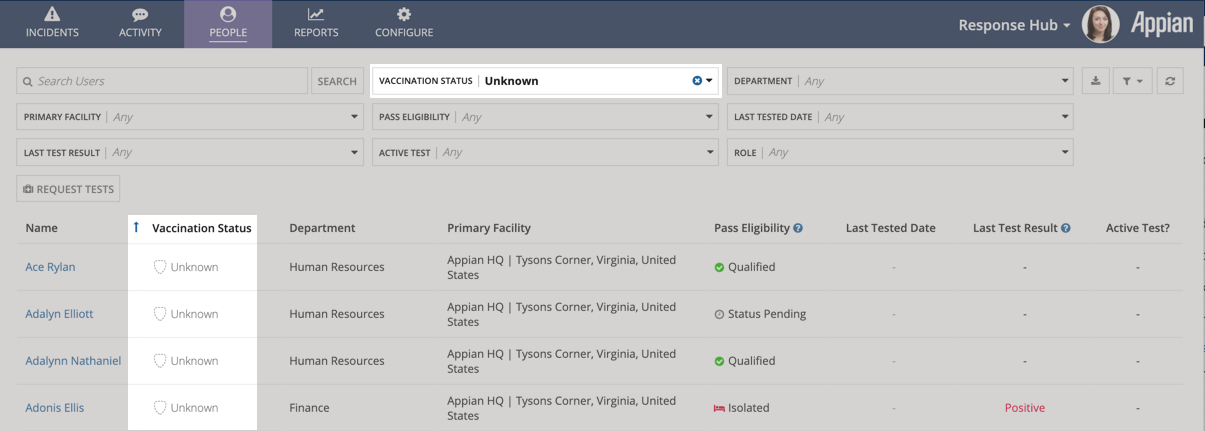
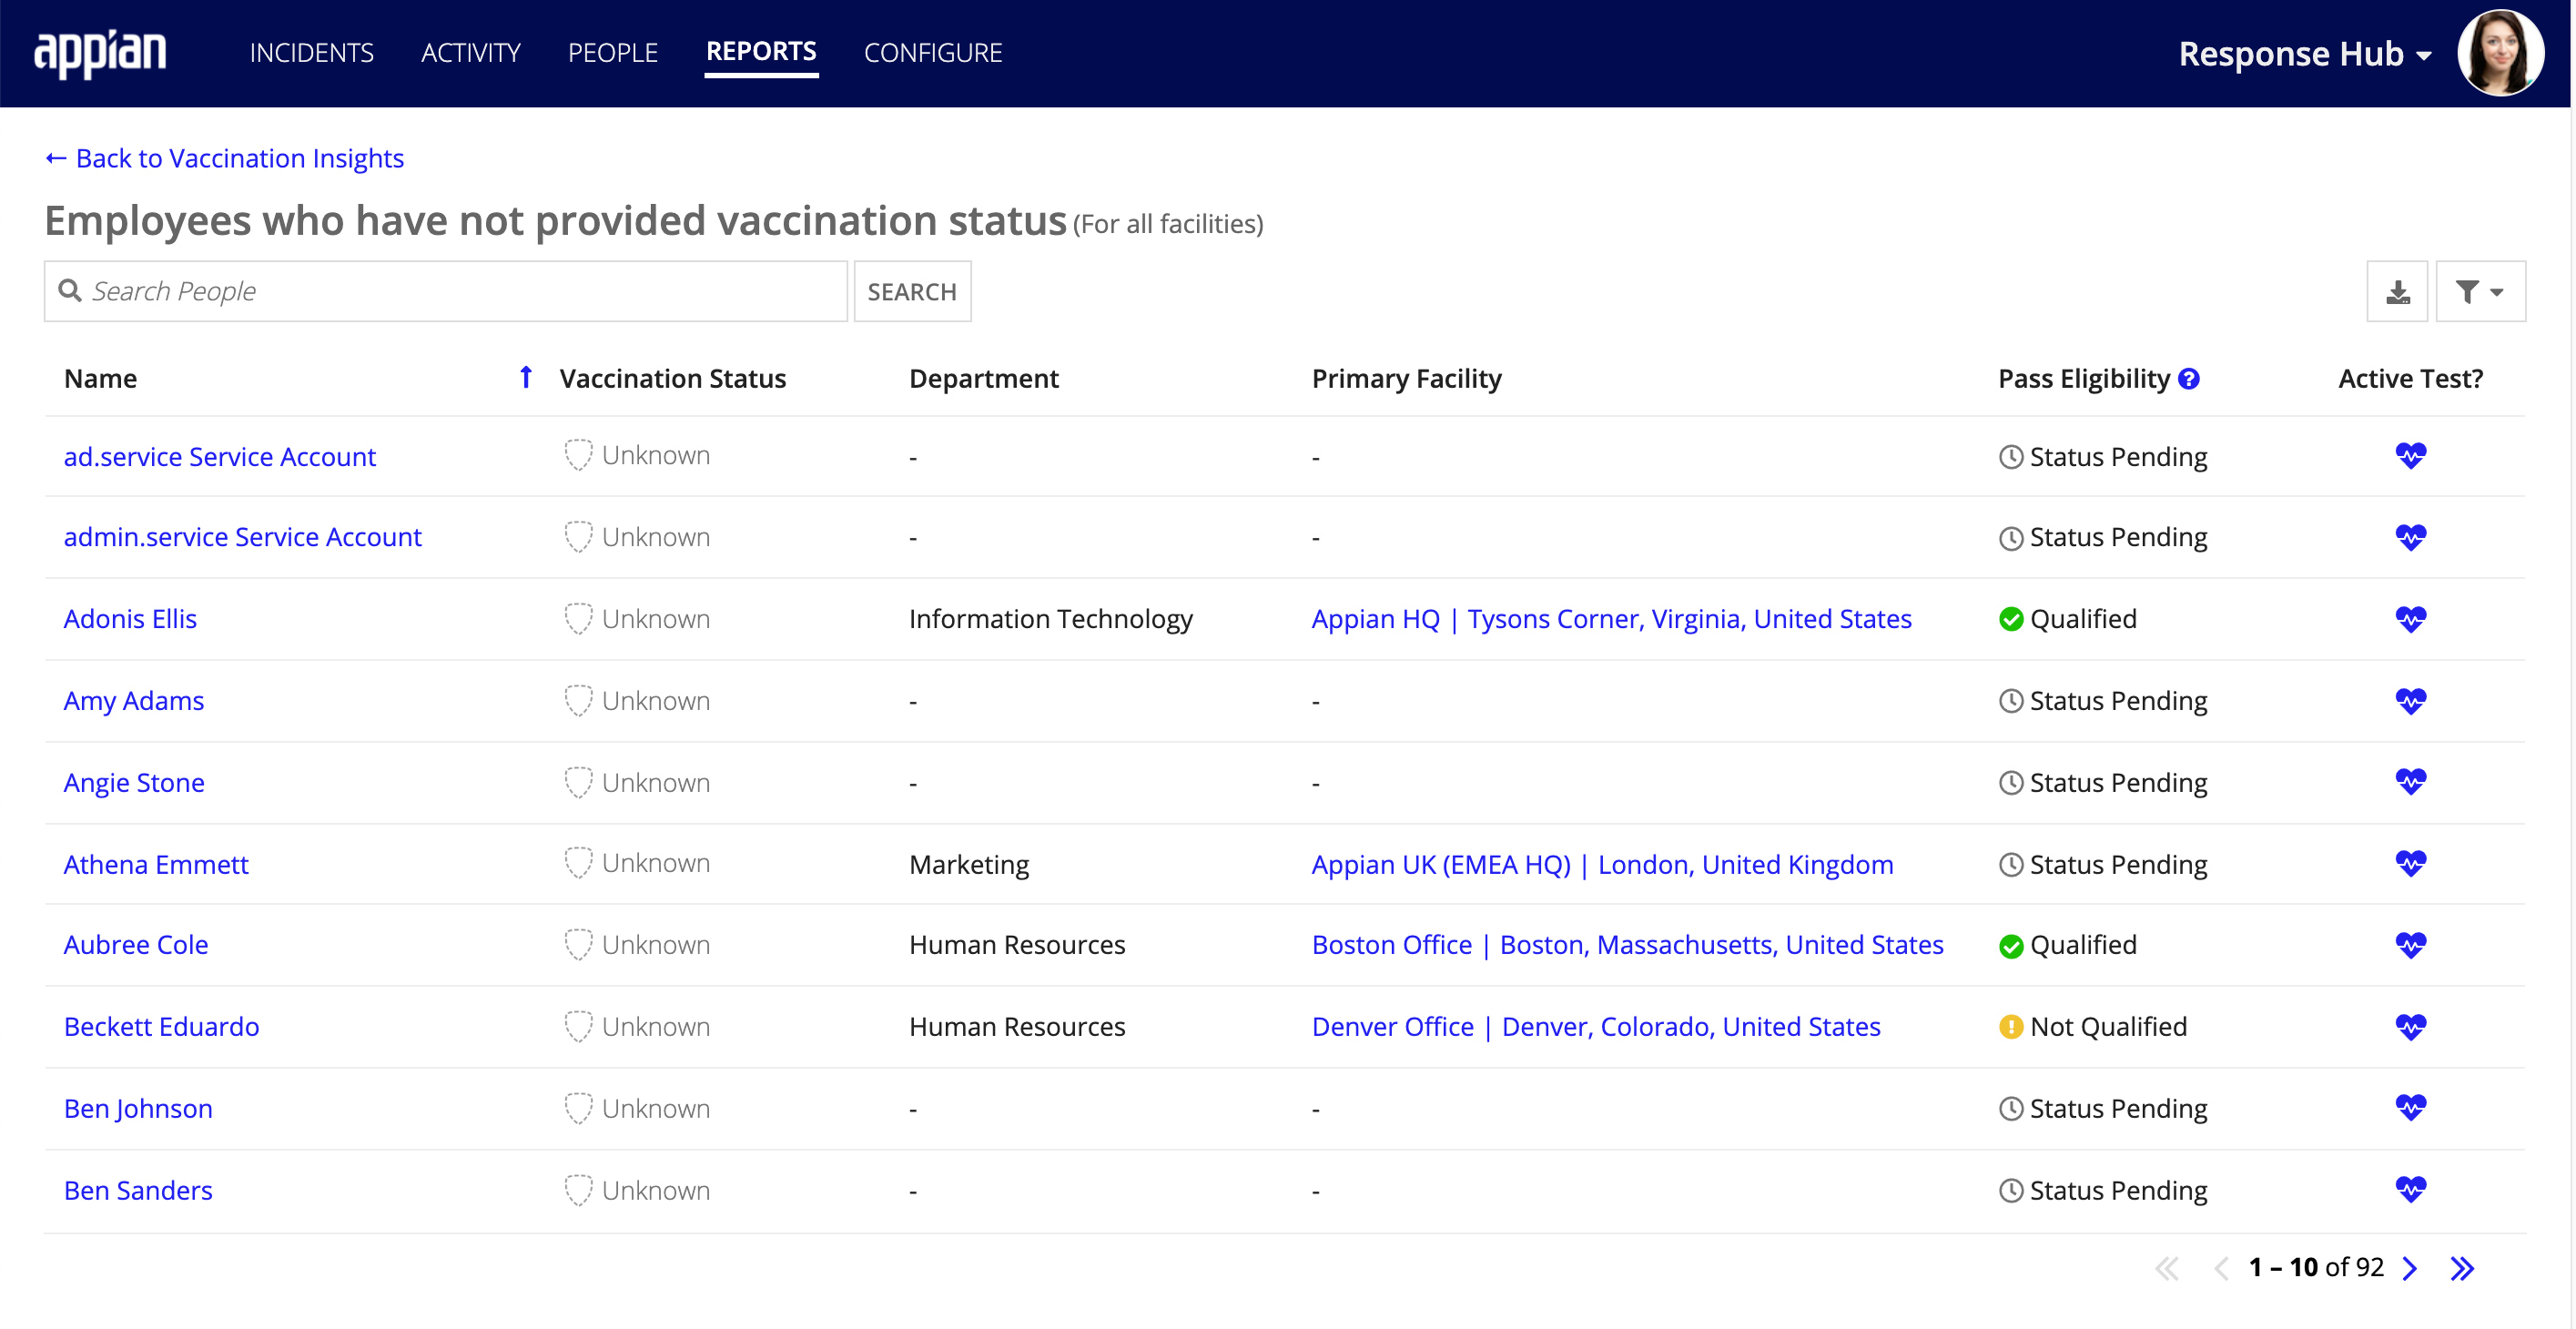
If you have VACCINATION INSIGHTS enabled and configured, the PEOPLE page allows you to filter employee by their vaccination status. You can use this data to determine which employee have been partially or fully vaccinated, as well as which employee are exempt, or have not received the COVID-19 vaccine or provided information about their vaccination status.
Employee can have the following vaccination statuses:
You can use the VACCINATION STATUS filter to filter the list of employee in Workforce Safety to display only the employee you want to see. For example, if you want to see a list of all employee who have not completed the vaccination status survey, select UNKNOWN as the vaccination status.
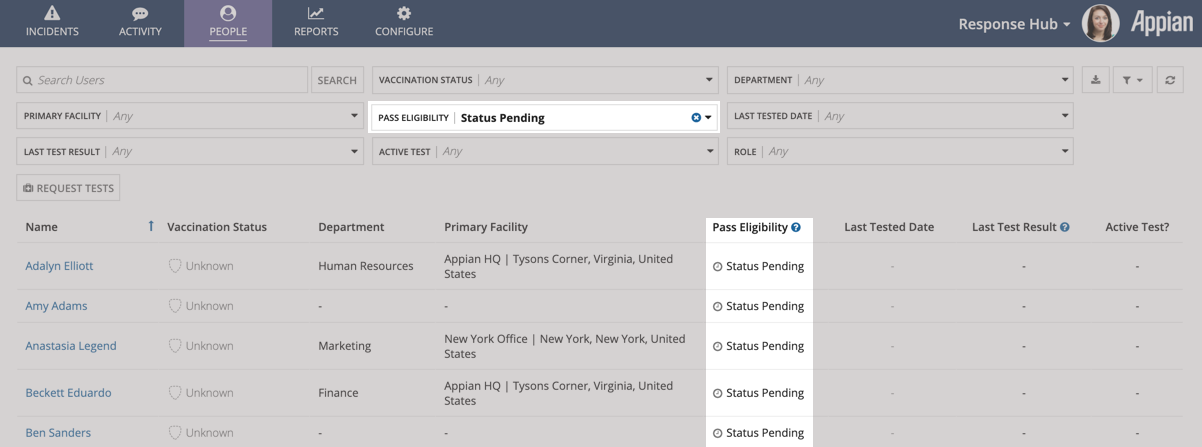
Employee can have the following pass eligibility statuses:
You can use these statuses to filter various lists in the Response Hub. For example, if you want to see a list of all users who have not requested a pass or filled out a survey, just filter the list of users on the People page by PASS ELIGIBILITY: Status Pending.
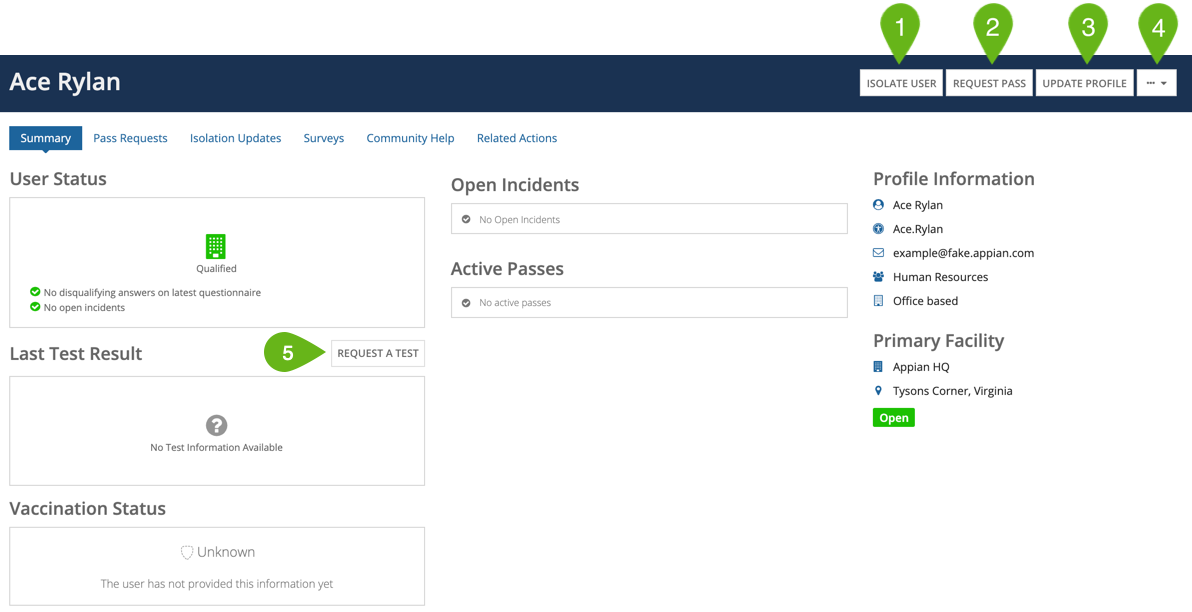
Clicking on a name from anywhere in the Response Hub opens their user summary.
The Summary tab contains various information about the user.
Note that while most groups that have access to the Response Hub can see this Summary tab for each user, the information that they see is different depending on which group they are in. Additionally, sections that aren't applicable to visitors do not display on user summaries for visitors.
From this tab, depending on the access that your group has, you can perform the following actions:
Update the user's profile, which includes the following fields:
Additionally, the Summary tab displays the user's pass eligibility status and the user's vaccination status. If the user's pass eligibility status is in a Disqualified state, the reason for their state displays in the User Status card.

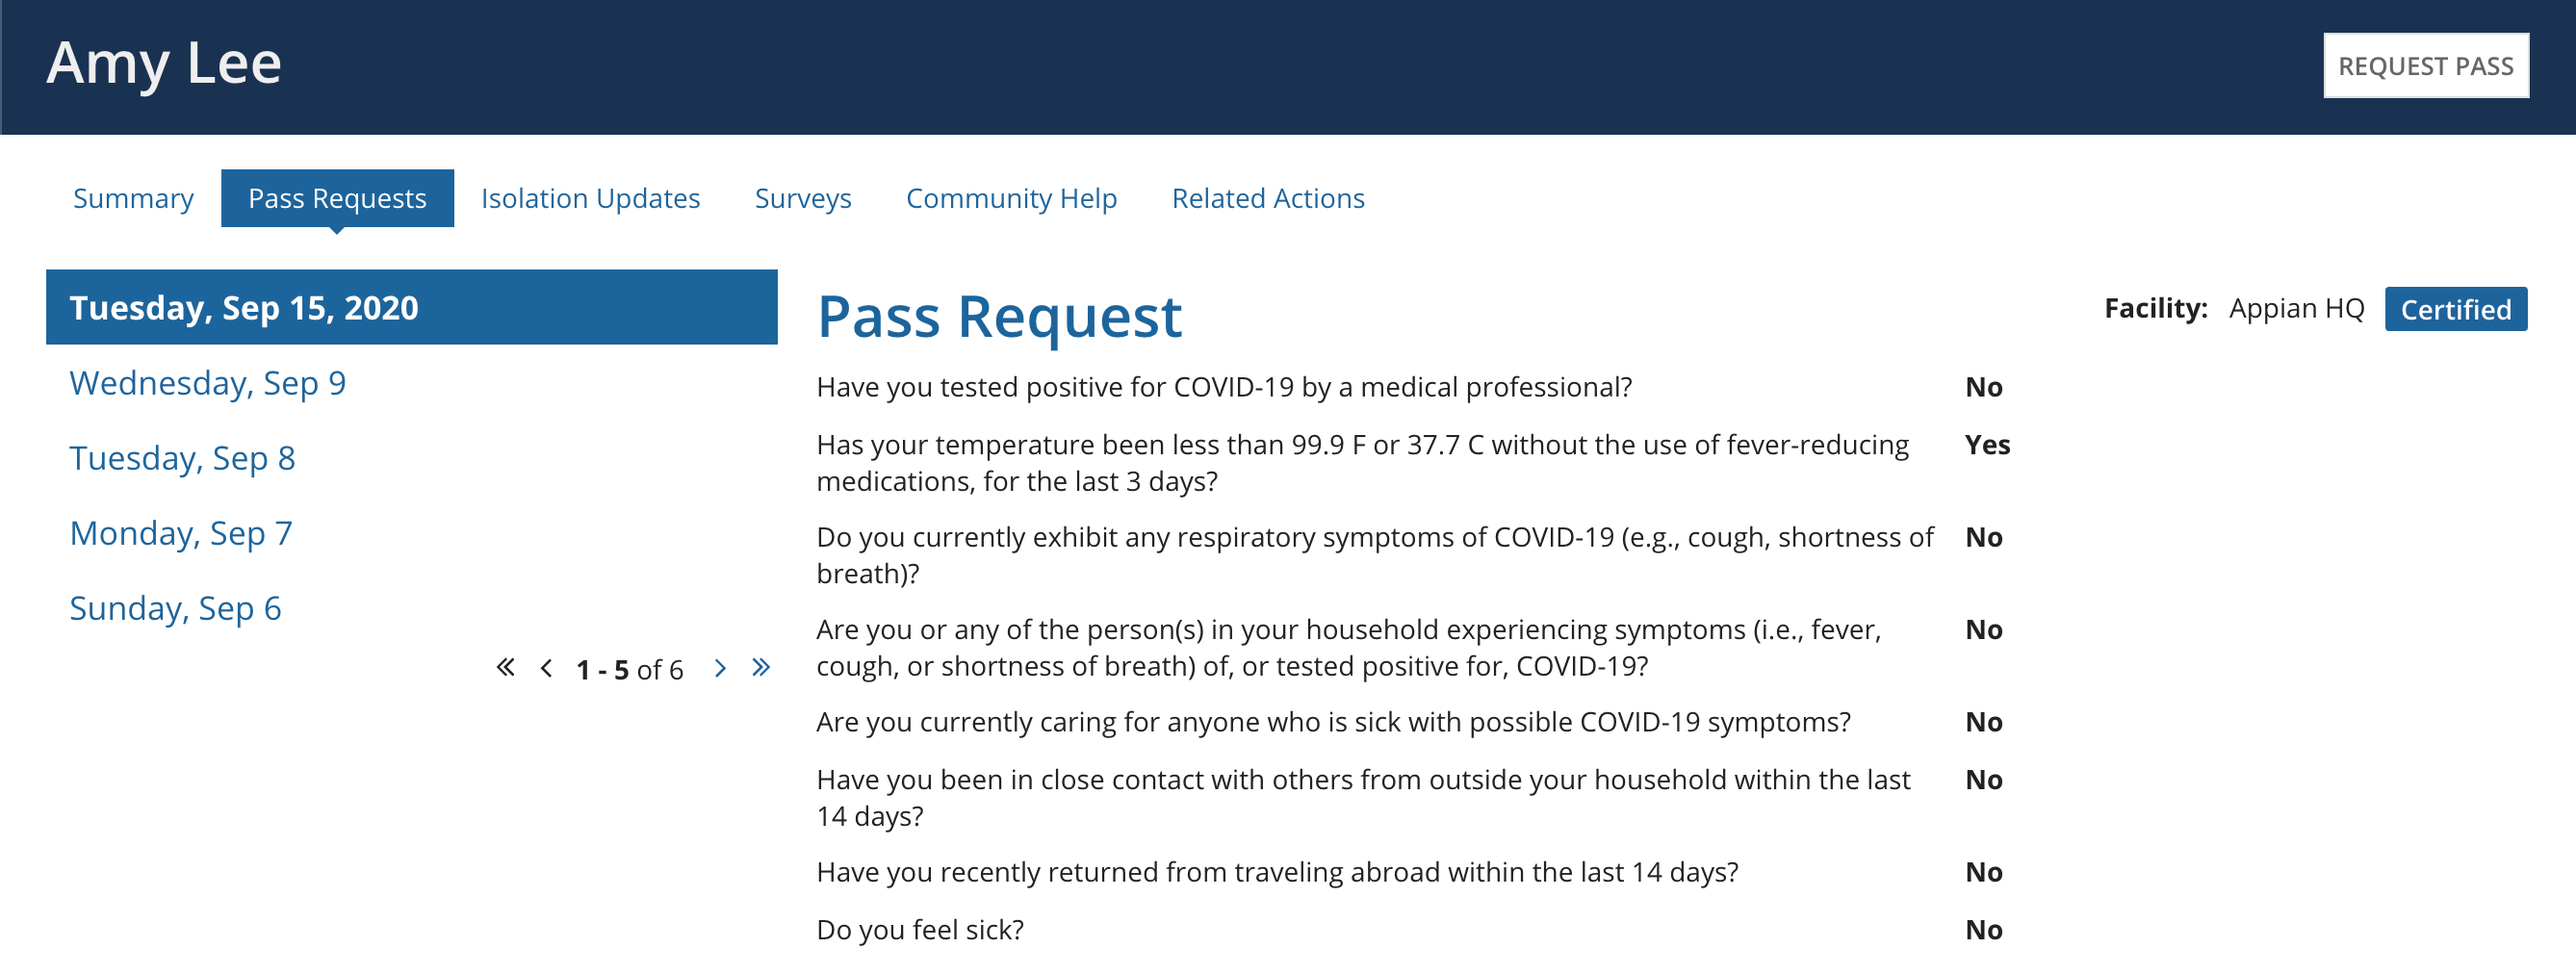
The user summary also has Pass Requests, Isolation Updates, and Surveys tabs that have records of each user's pass request, survey, and isolation update responses.
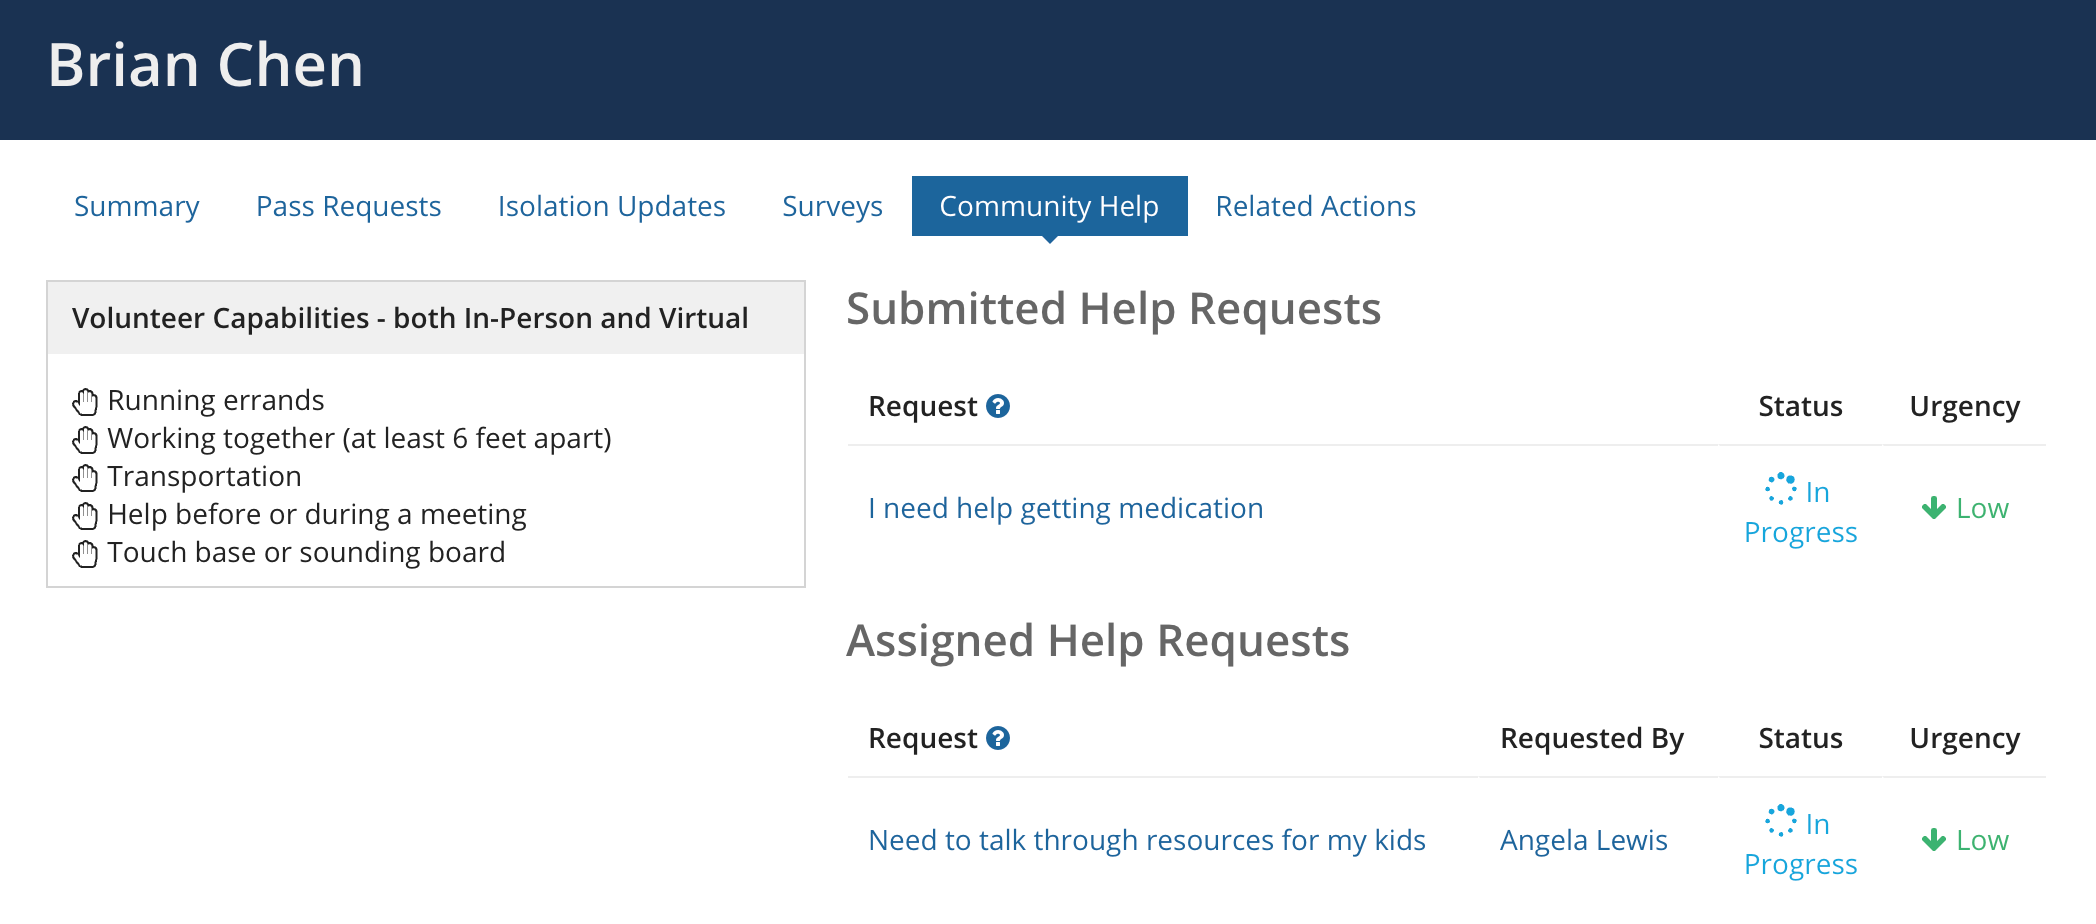
If the Community Volunteering and Help Requests feature option is toggled on, you will have access to the Community Help tab for each user.
If a user has signed up to volunteer, this tab displays the volunteer categories that they said they could help with along with any help requests that are assigned to them.
All help requests that a user has submitted will also display.
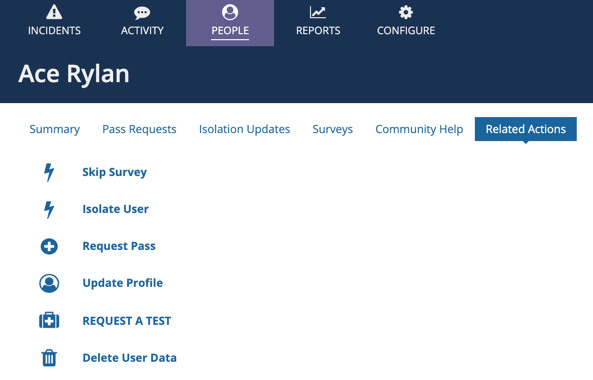
The Related Actions tab displays all of the actions that you can perform for a user.
The REPORTS page displays important insights and data about how COVID-19 incidents are impacting the health of your people and your facilities. The data on this page is divided into three tabs:
Go to the Reports tab to analyze this data and use it to help you make important decisions about facility closures and reopenings. You can also use the report data to help you identify any operational adjustments you need to make to ensure your organization’s COVID-19 response keeps your employees safe.
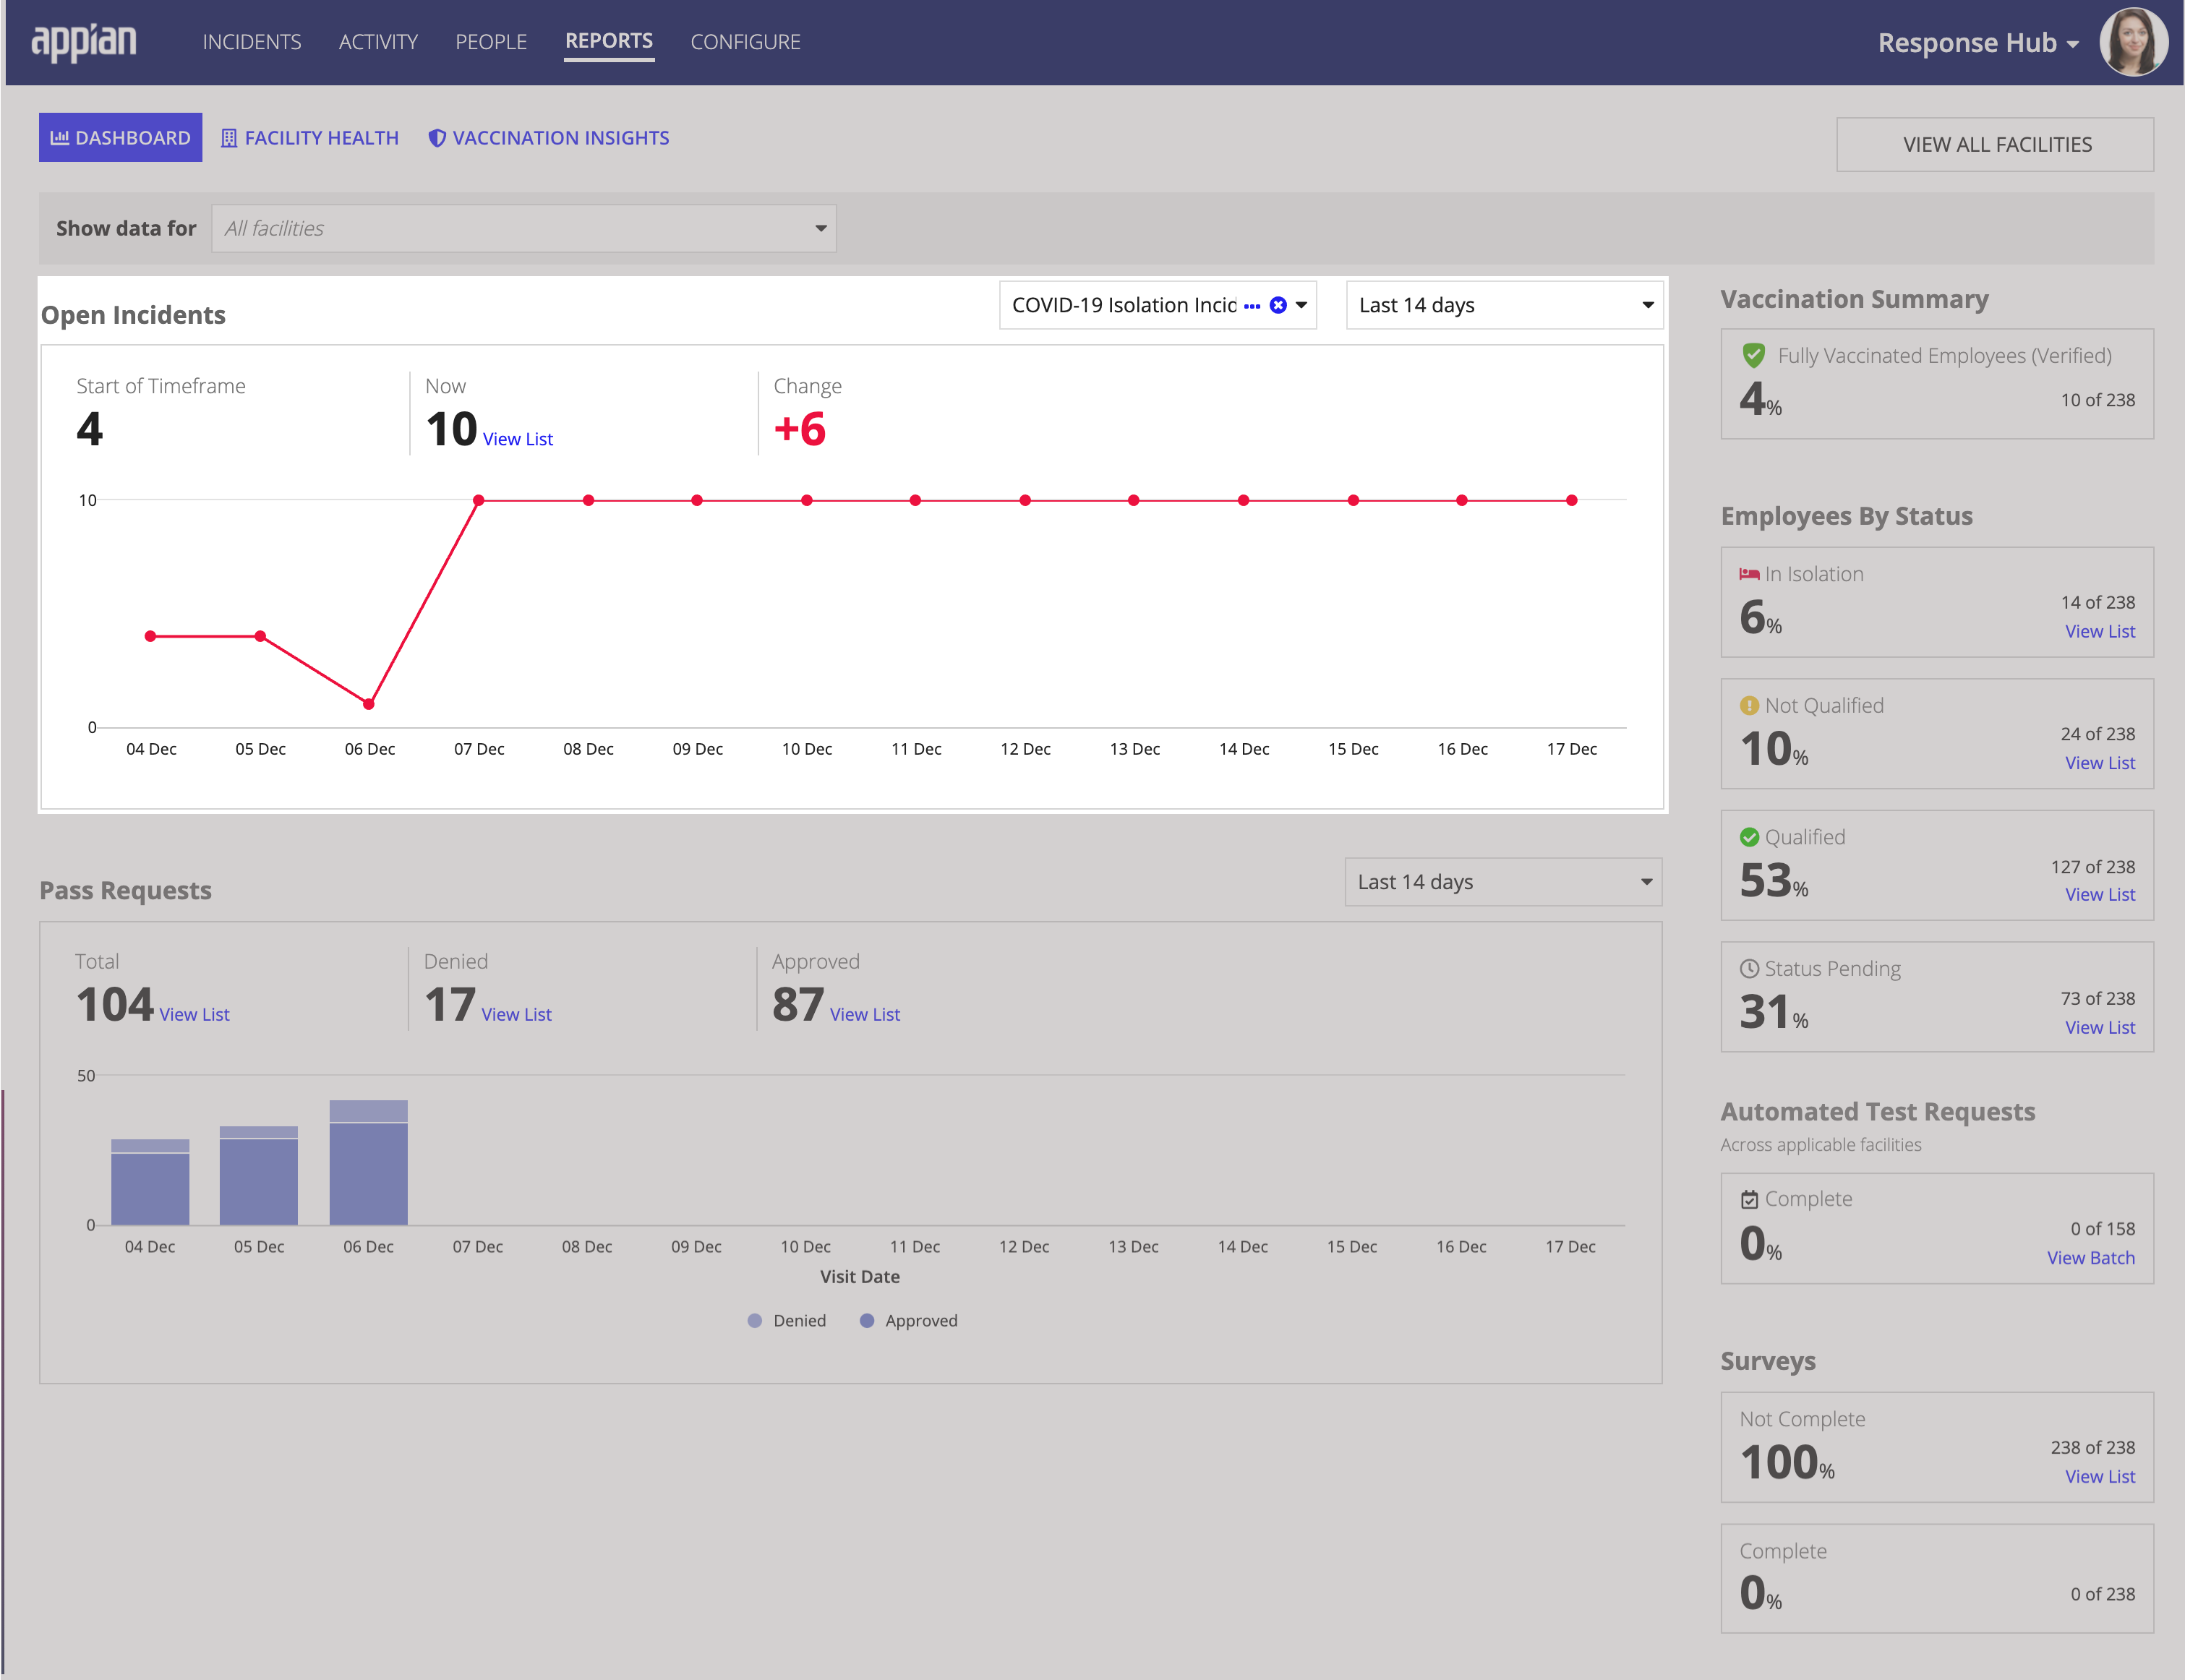
The Dashboard tab reports provide real-time people and activity data across five critical areas in your organization: Open Incidents, Vaccination Summary, Employees By Status, Pass Requests, Automated Test Requests, and Surveys, and Surveys.
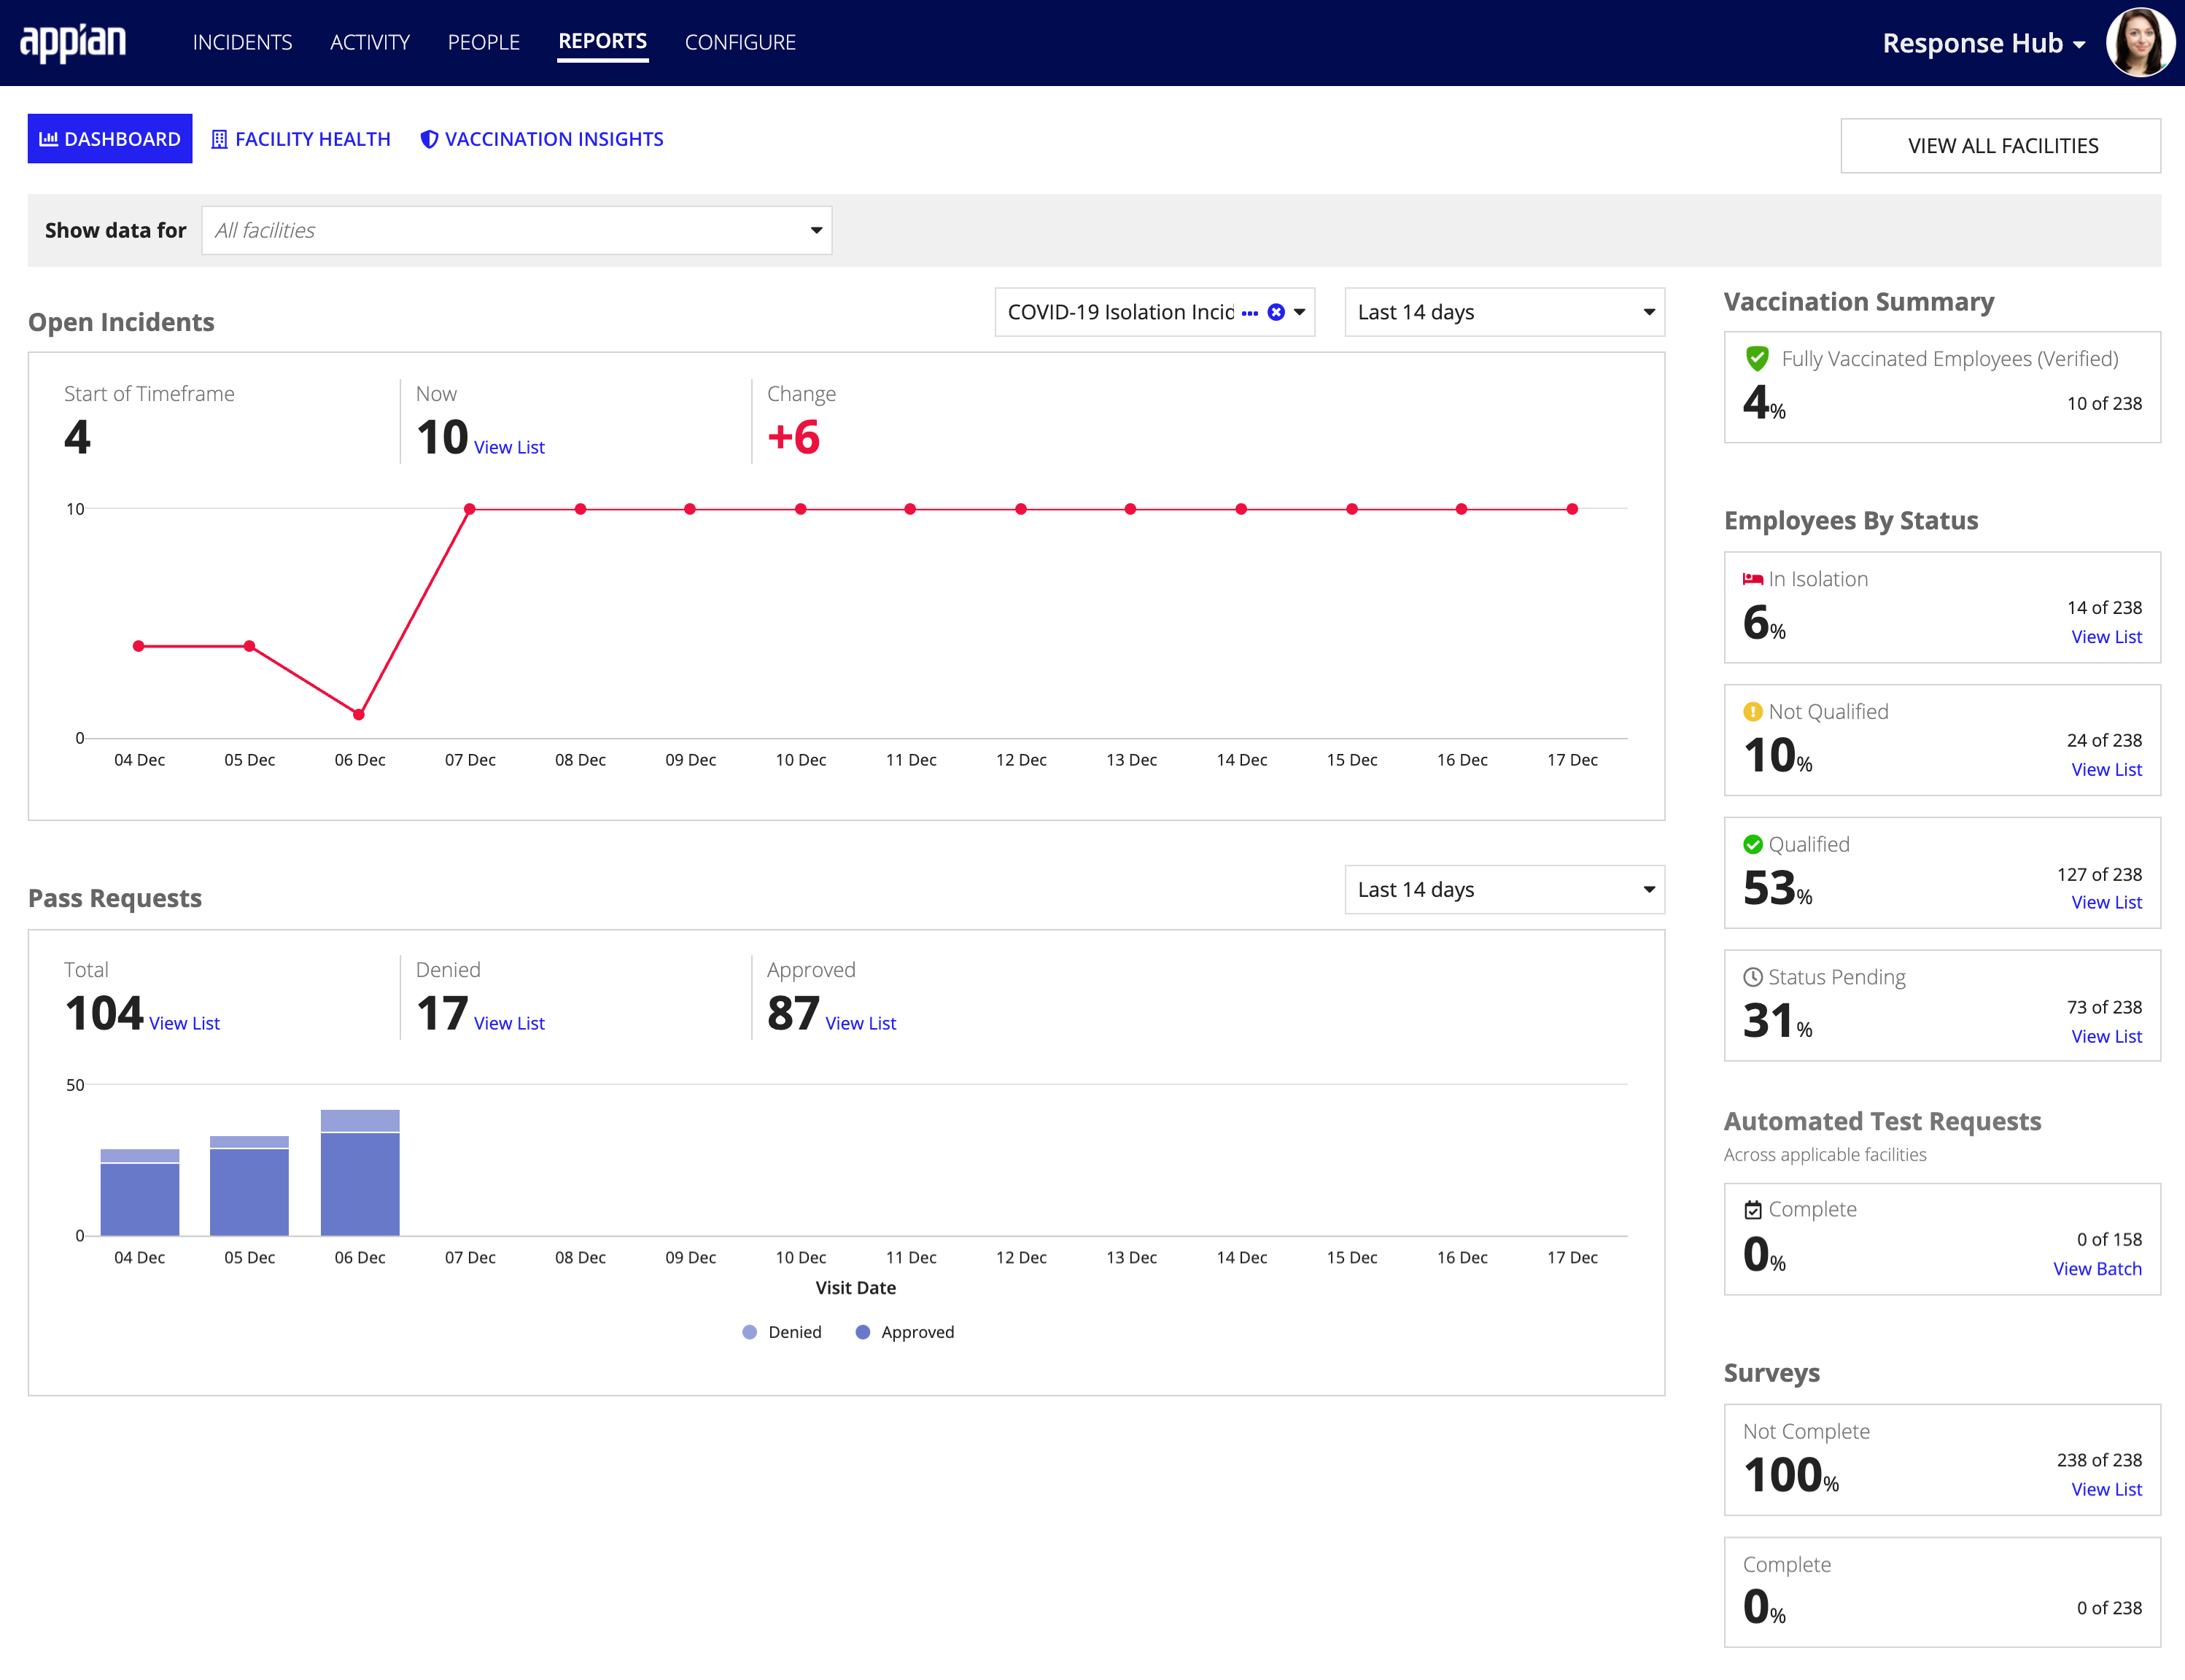
The Open Incidents report displays key indicators that show how open incidents are trending across your organization over a specific period of time. In this section, you can view statistical data and changes in the number of open incidents for one or more facilities.
Use this report to quickly analyze and understand:
View only the data for the facilities you want to see by selecting one or more facilities in the Show data for dropdown. Use the Incident Types dropdown to filter the Open Incidents report and track different incident types. Use the Date Range picker to filter the report and display only the open incident data you want to view for a specific period of time. Valid ranges include:
When you need to see more details about your organization's current incidents, simply click View List in the Current incident count section to access a list of incidents behind the open incident count.
Note: This open incidents data will only begin to populate after you upgrade to Workforce Safety version 8.0.
The Vaccination Summary report only displays if you have VACCINATION INSIGHTS enabled. This report provides summary data for the total number of employee in your organization that have been verified as fully vaccinated.
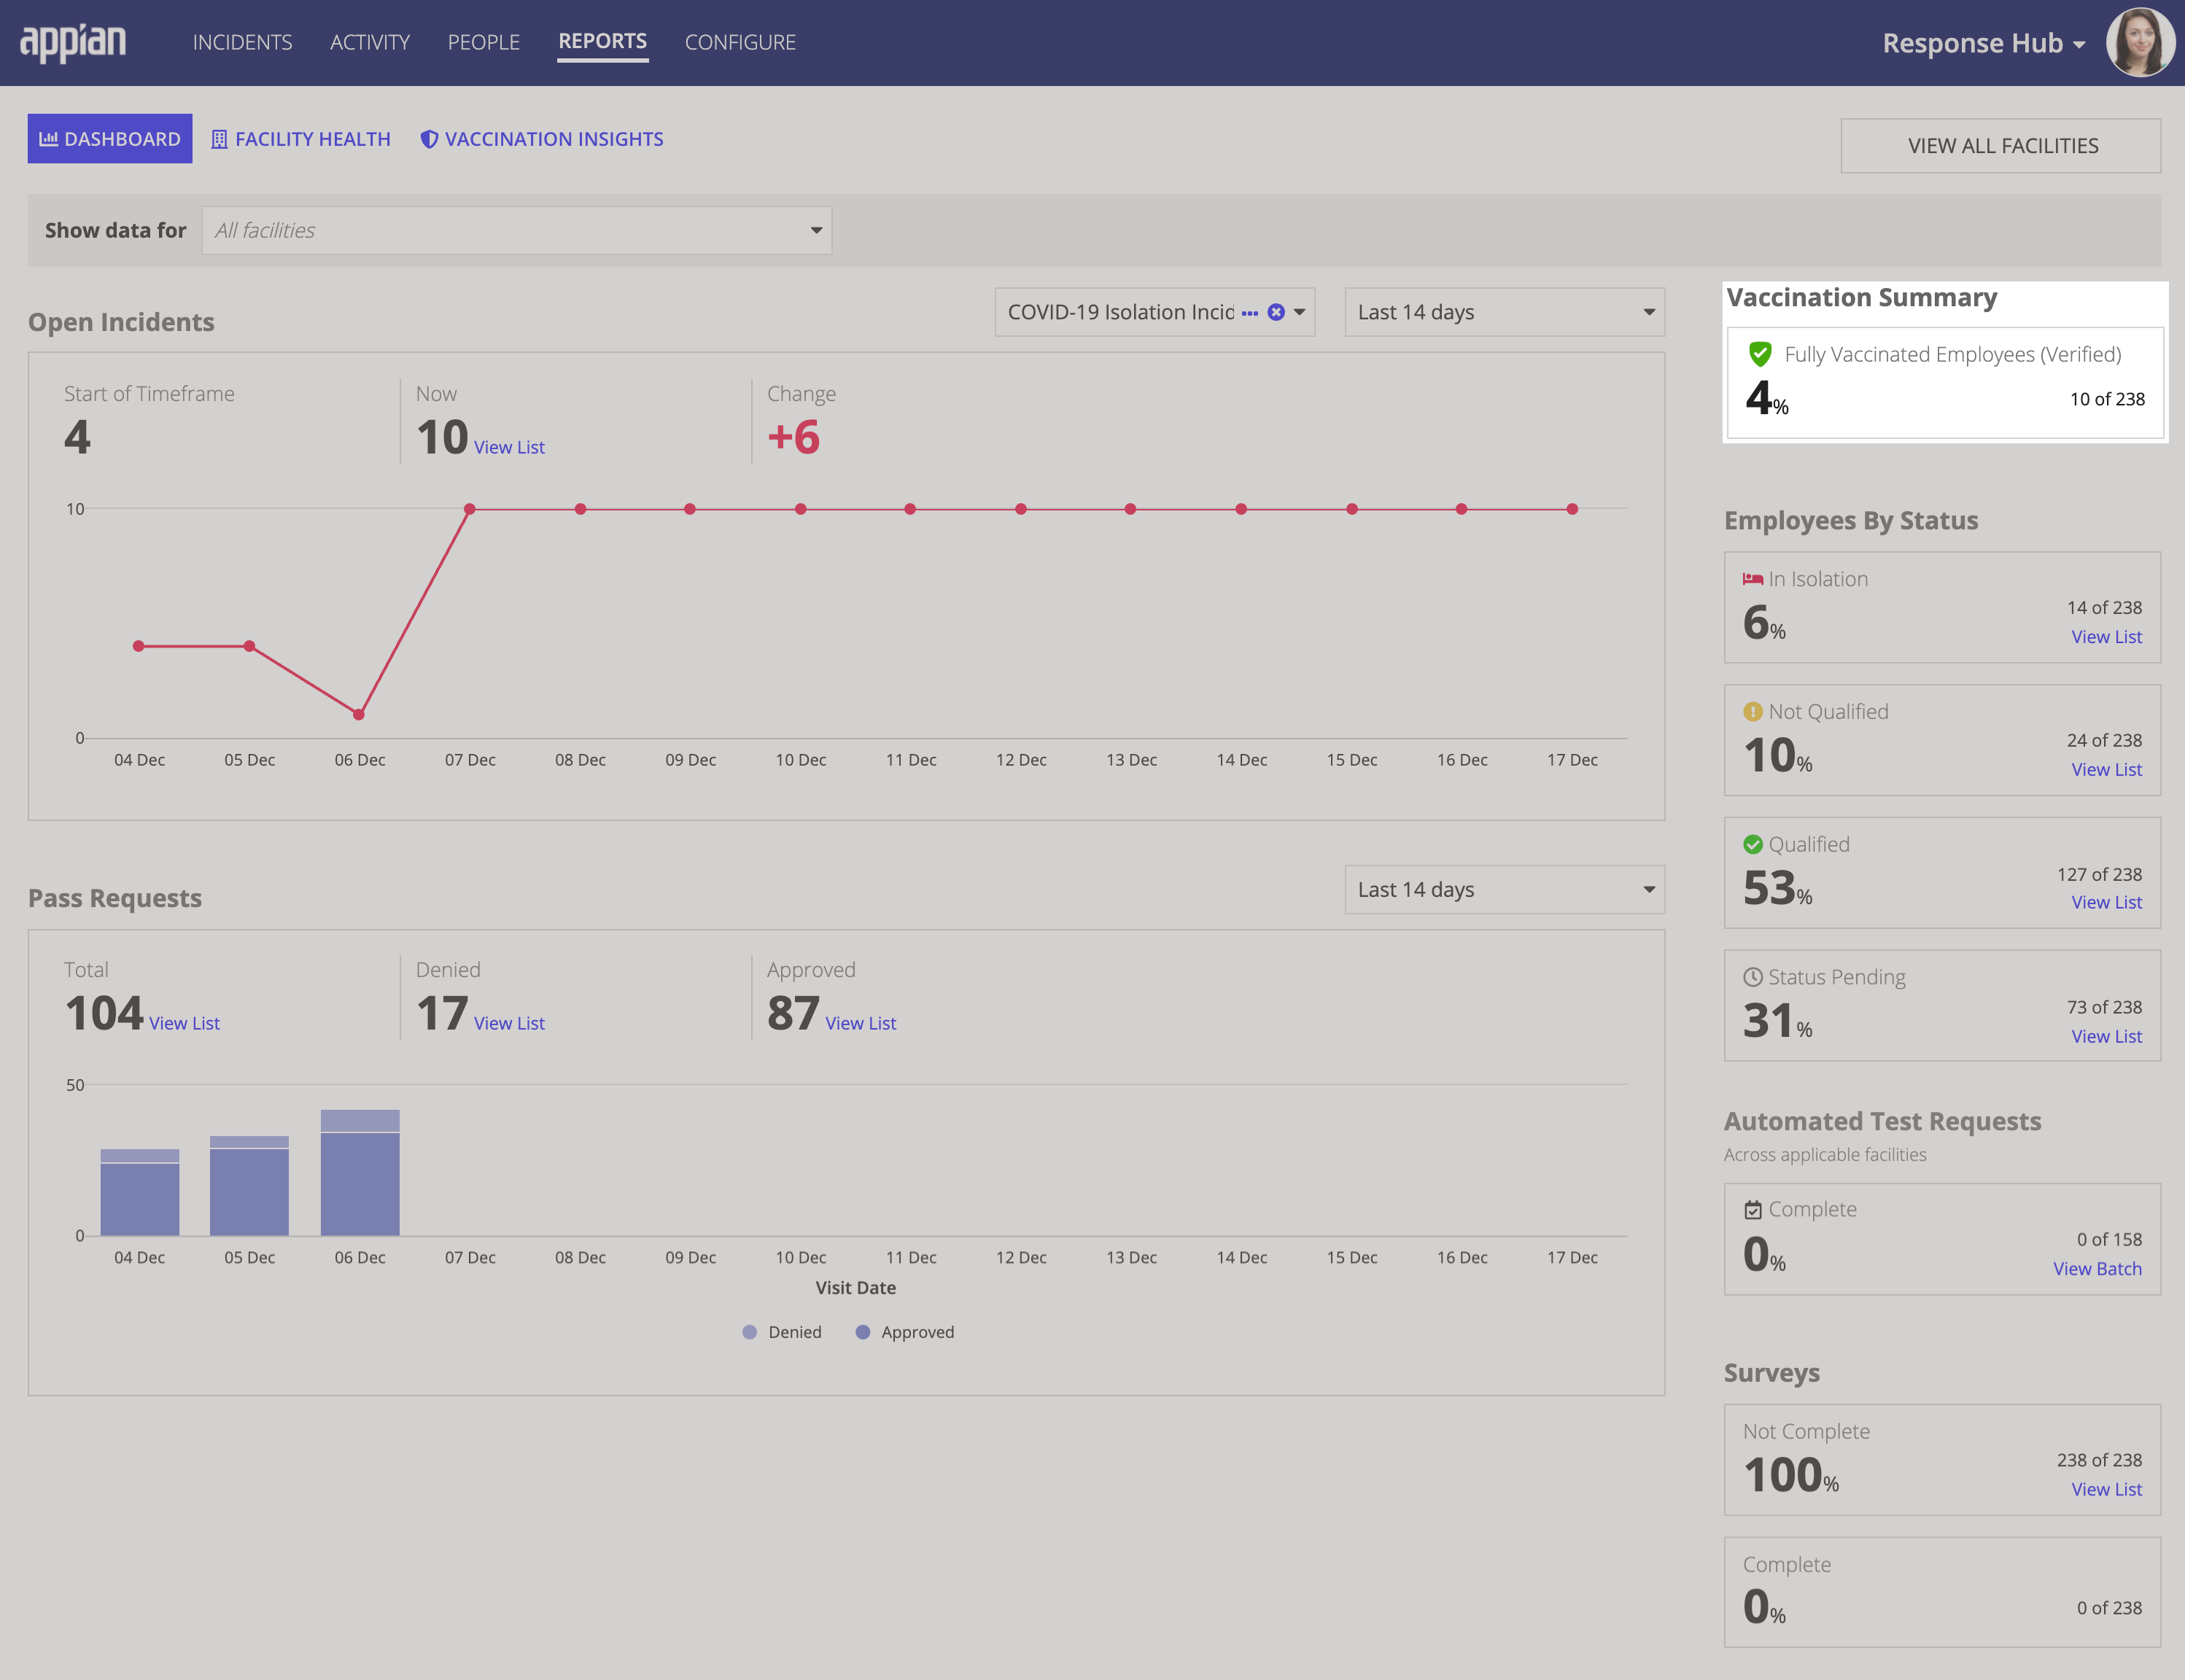
You'll use this report when you want to quickly assess the percentage of employee in your organization that reported a Fully Vaccinated status, that was verified by a response manager.
The Employees By Status report allows you to see a breakdown of all of your employee by their pass eligibility status, excluding visitors.
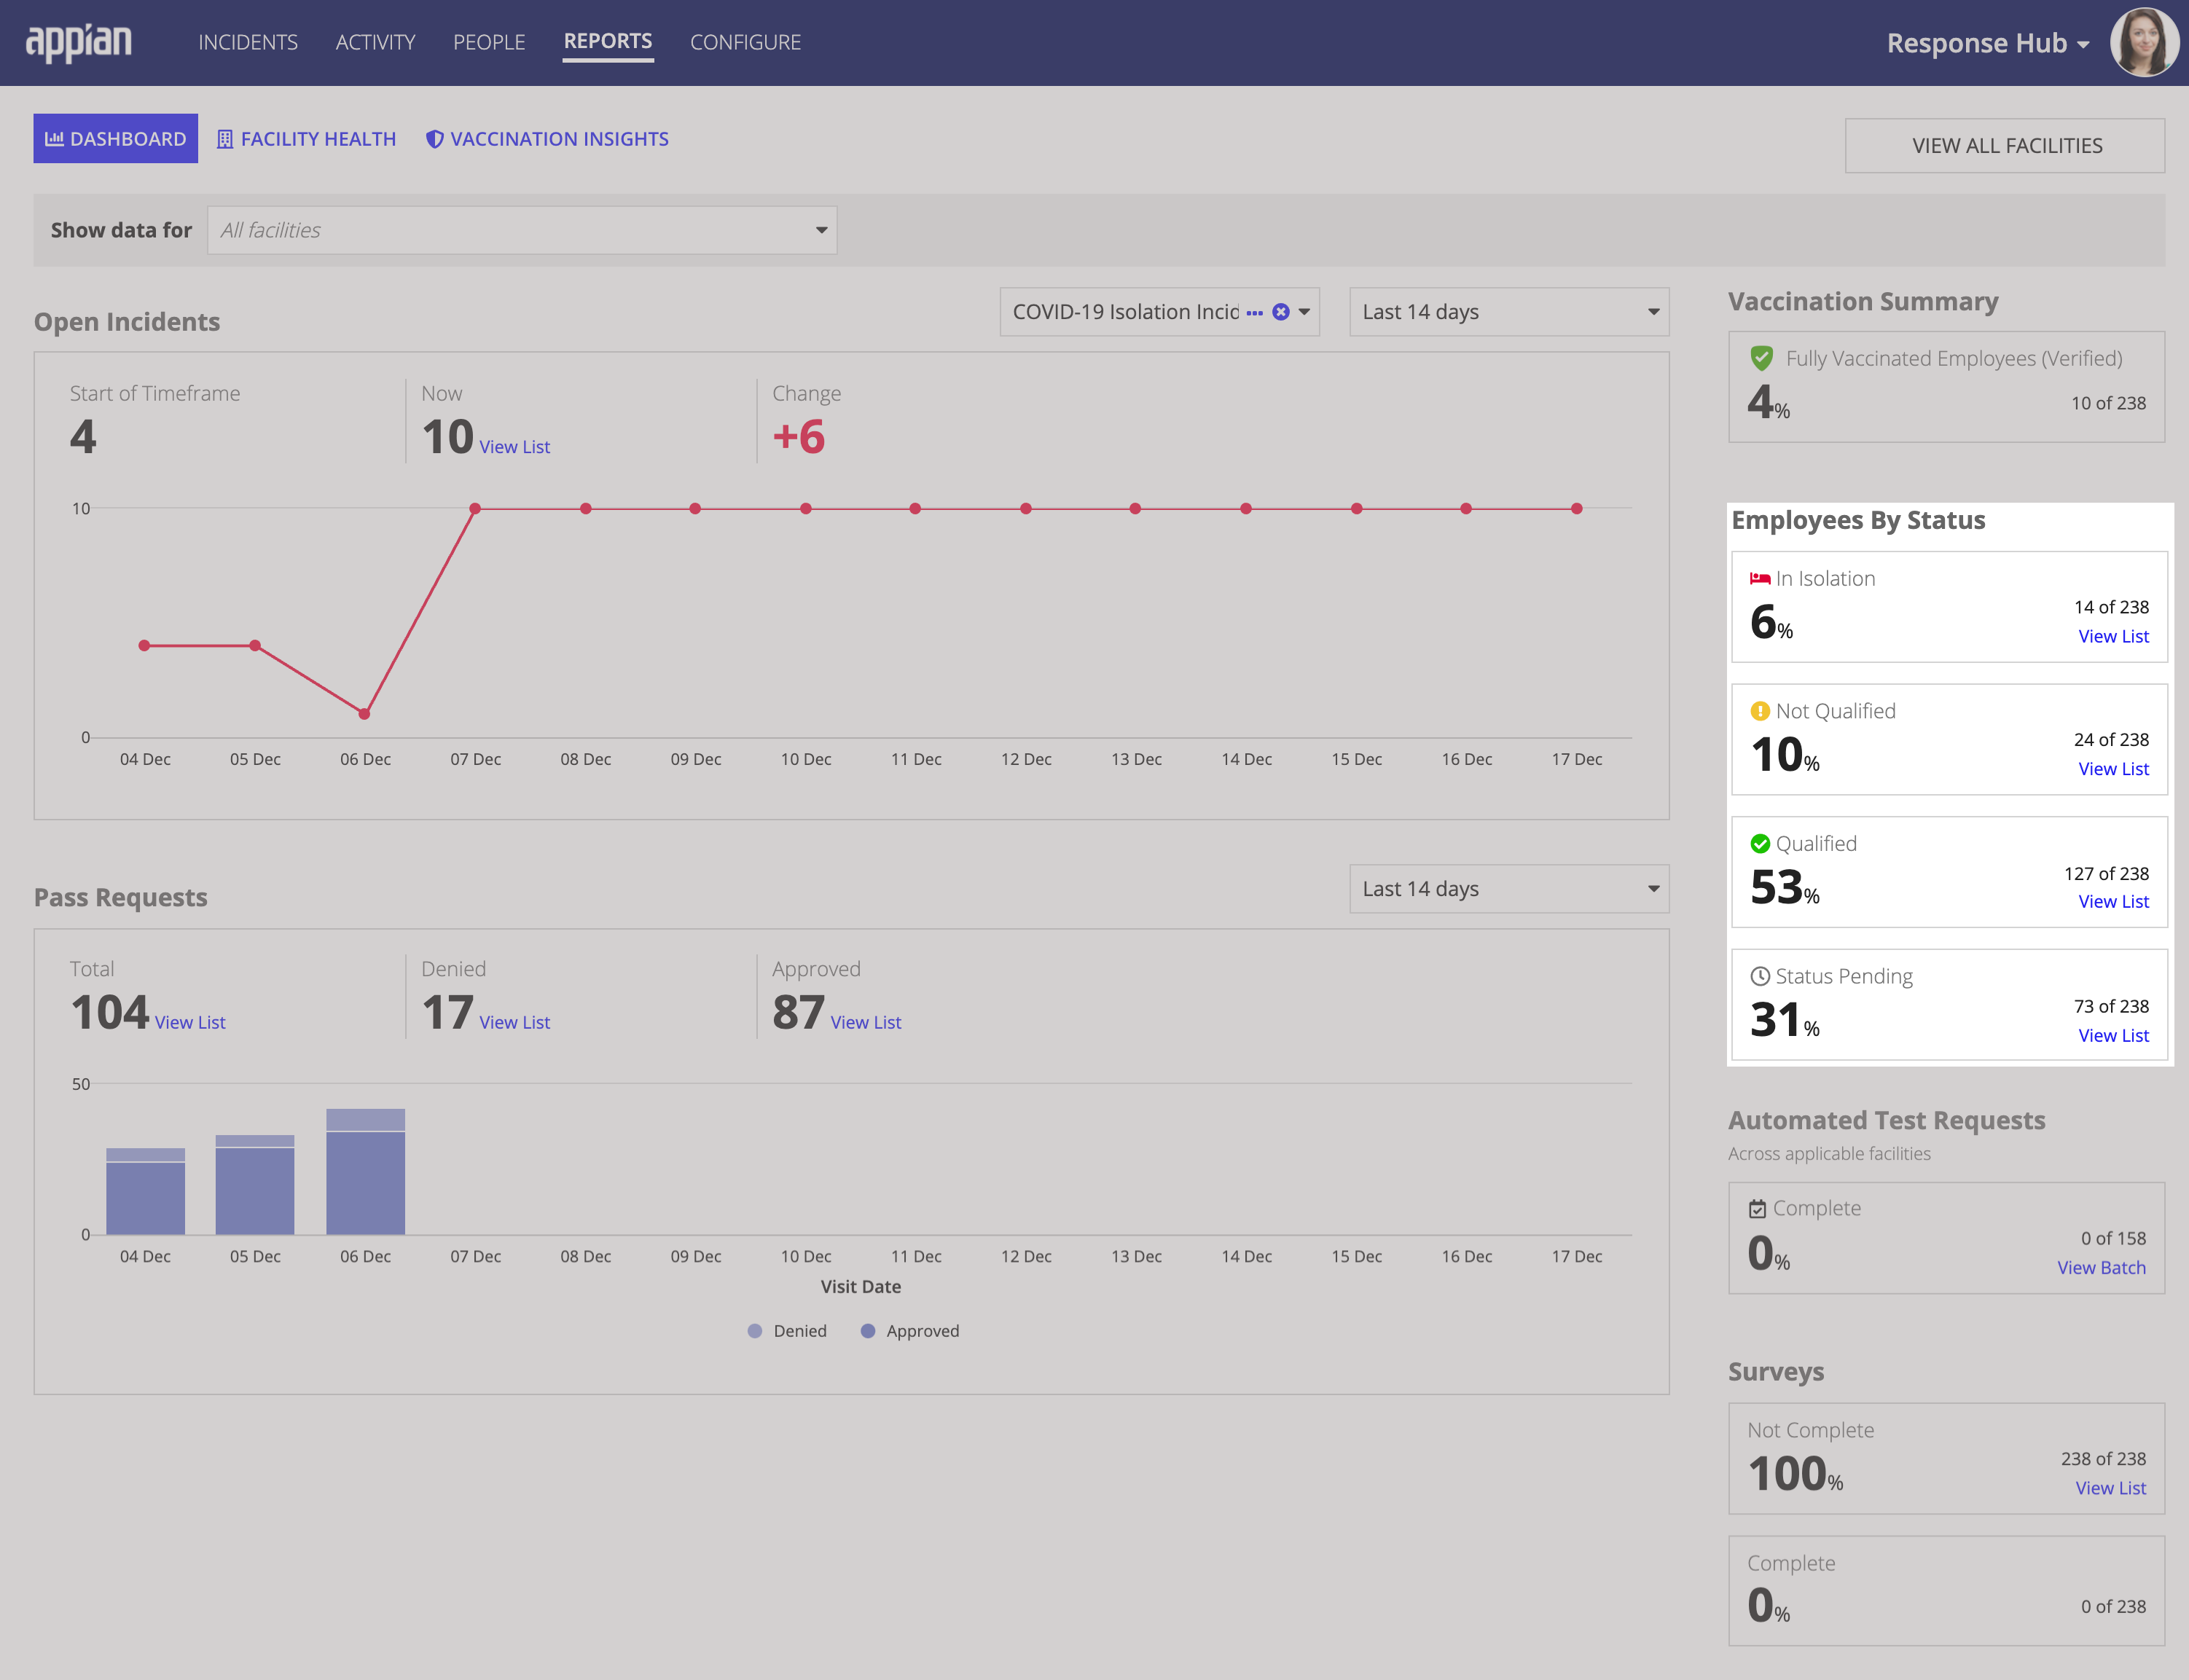
Quickly assess the percentage of employee by pass eligibility status: In Isolation, Not Qualified, Qualified, and Status Pending. To view more details about the eligibility status of your employee, simply click View List to see an exportable list of employee behind each number. You can filter the data in this section using the Show data for filter at the top of the page, which allows you to view the data for a single facility or multiple facilities in your organization.
The Pass Requests section displays relevant data for all pass requests that have been submitted across your organization for a specific period of time. This data allows you to quickly see increases and decreases in the number of pass requests, which allows you to adjust your operational response based on need.
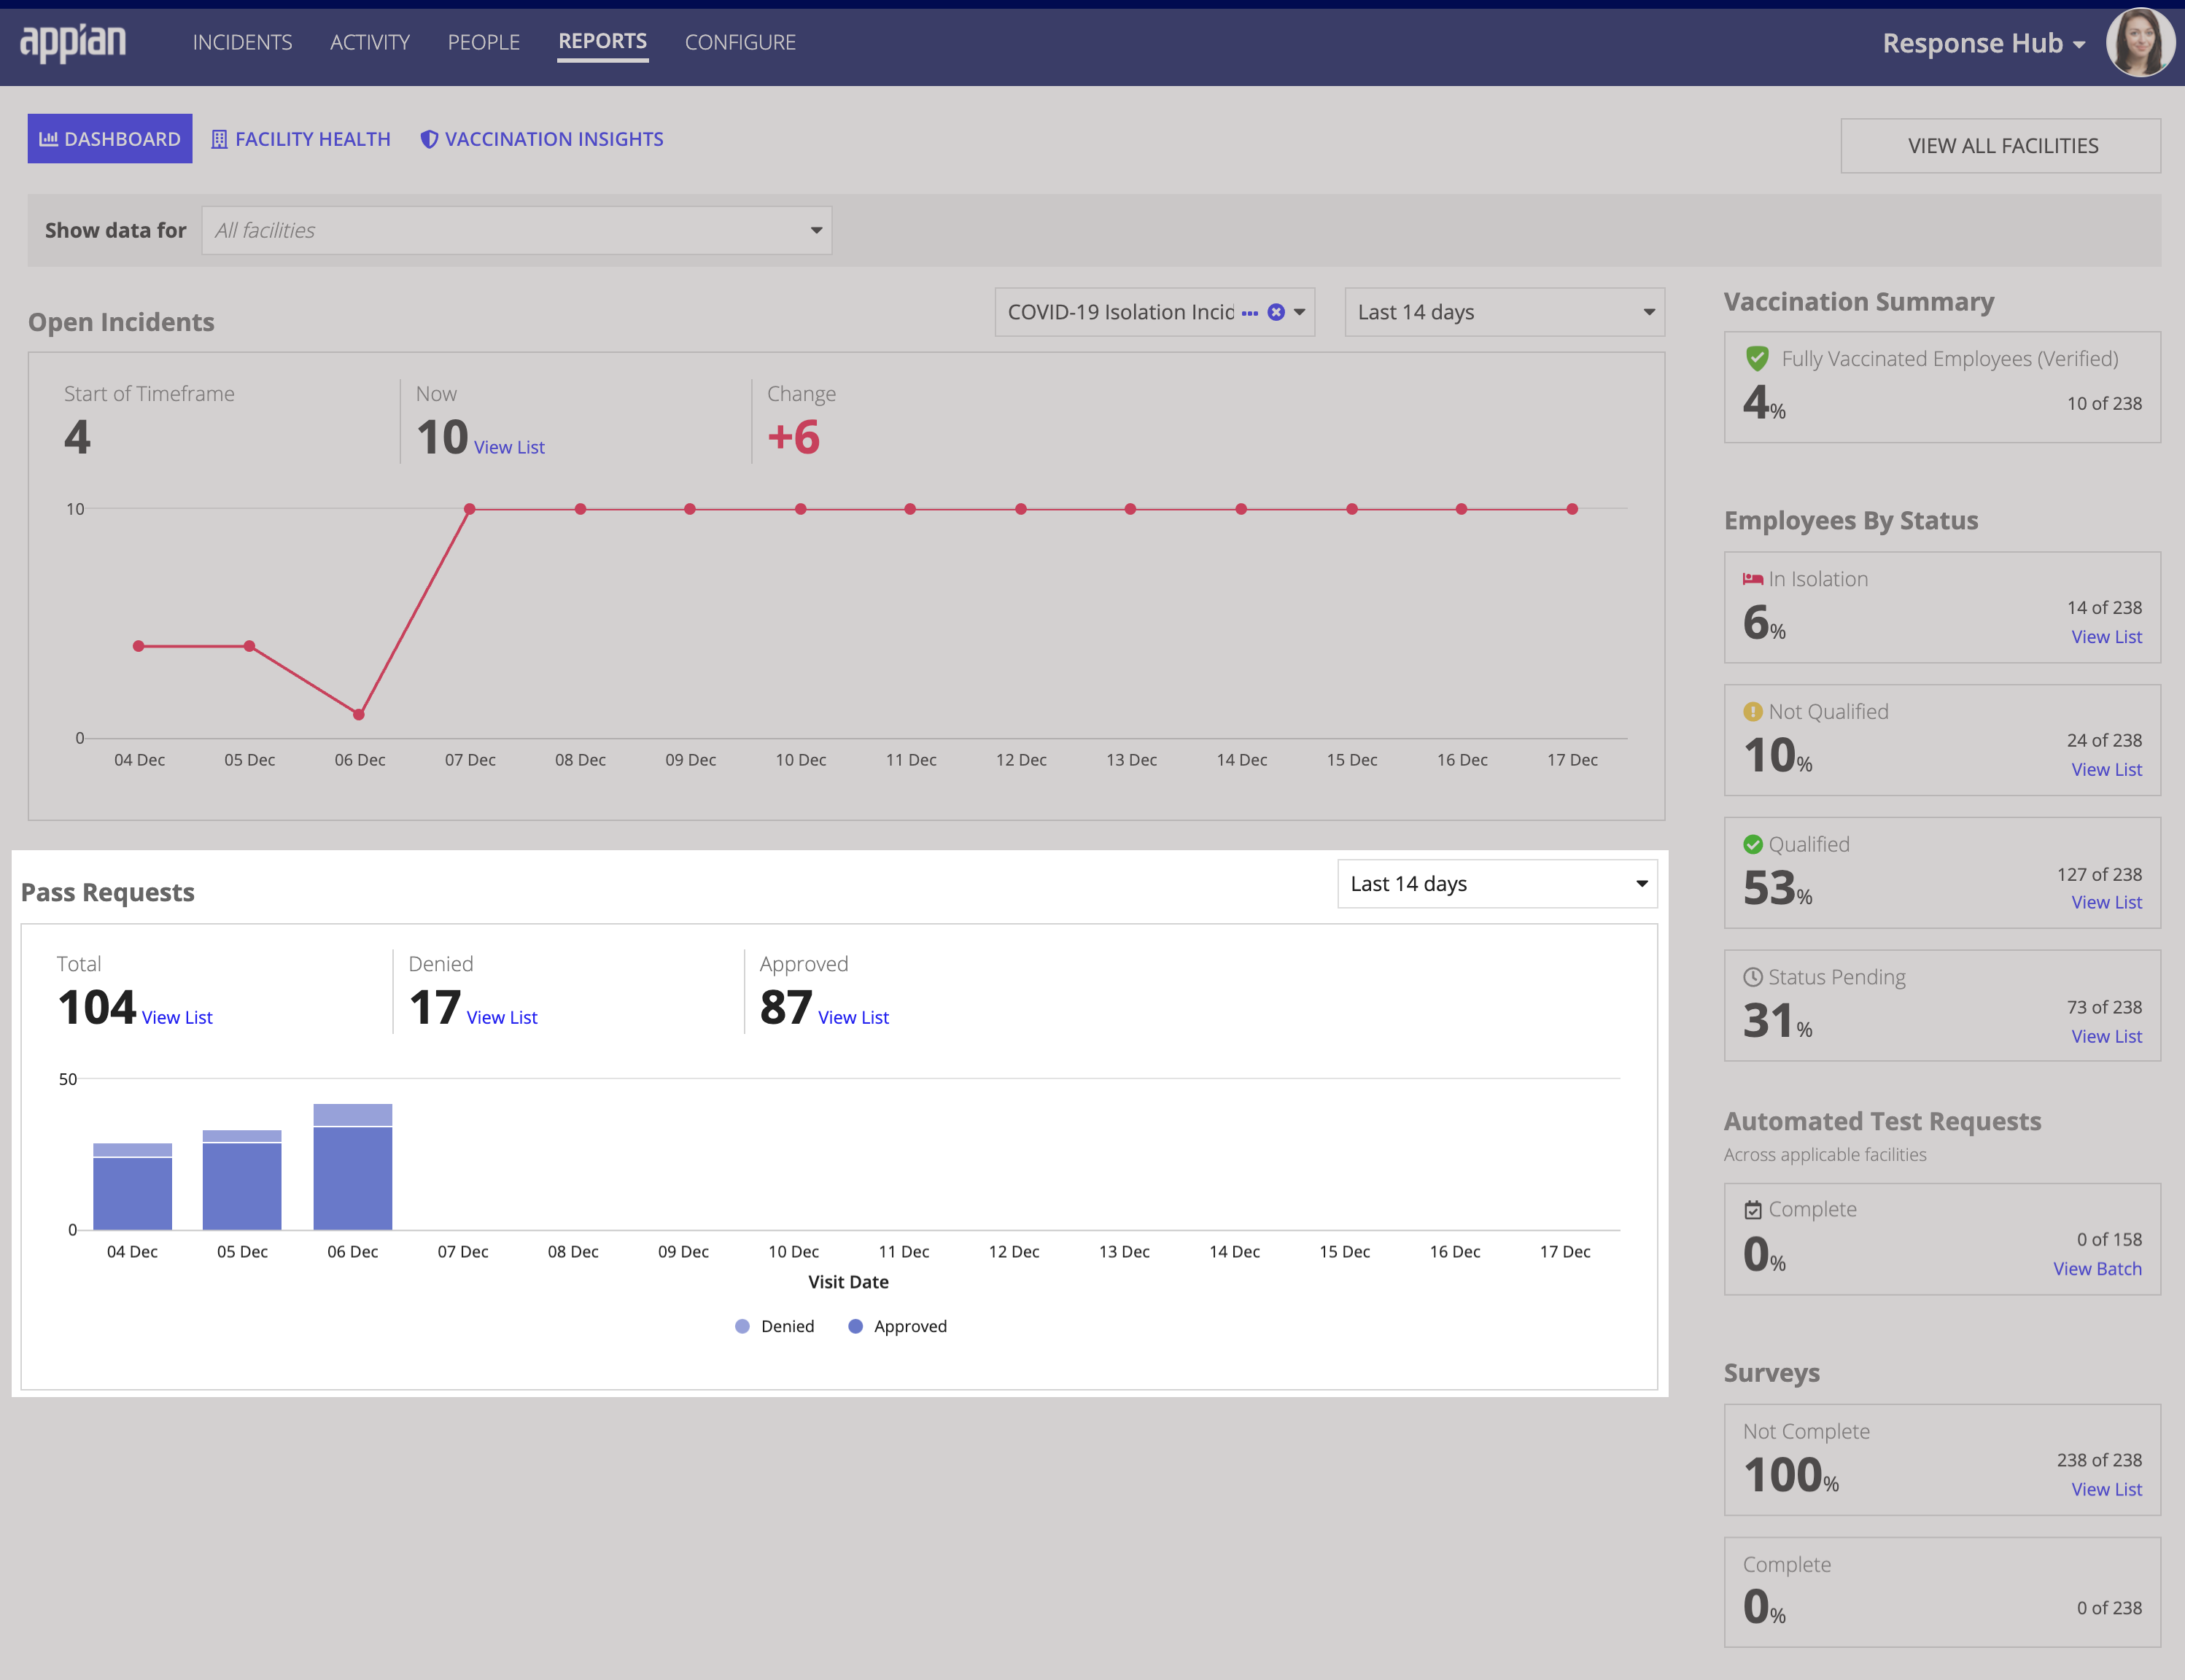
From this section, you can:
The Show data for filter at the top of the page allows you to filter this data to see only the pass request data for the facilities you want to see. You can also use the Date Range picker to filter this report and display pass request data for a specific period of time.
Take a look at the Surveys section when you want to identify the percentage of employee in your organization that have completed the active survey. This report displays only when you have enabled and configured surveys for your organization.
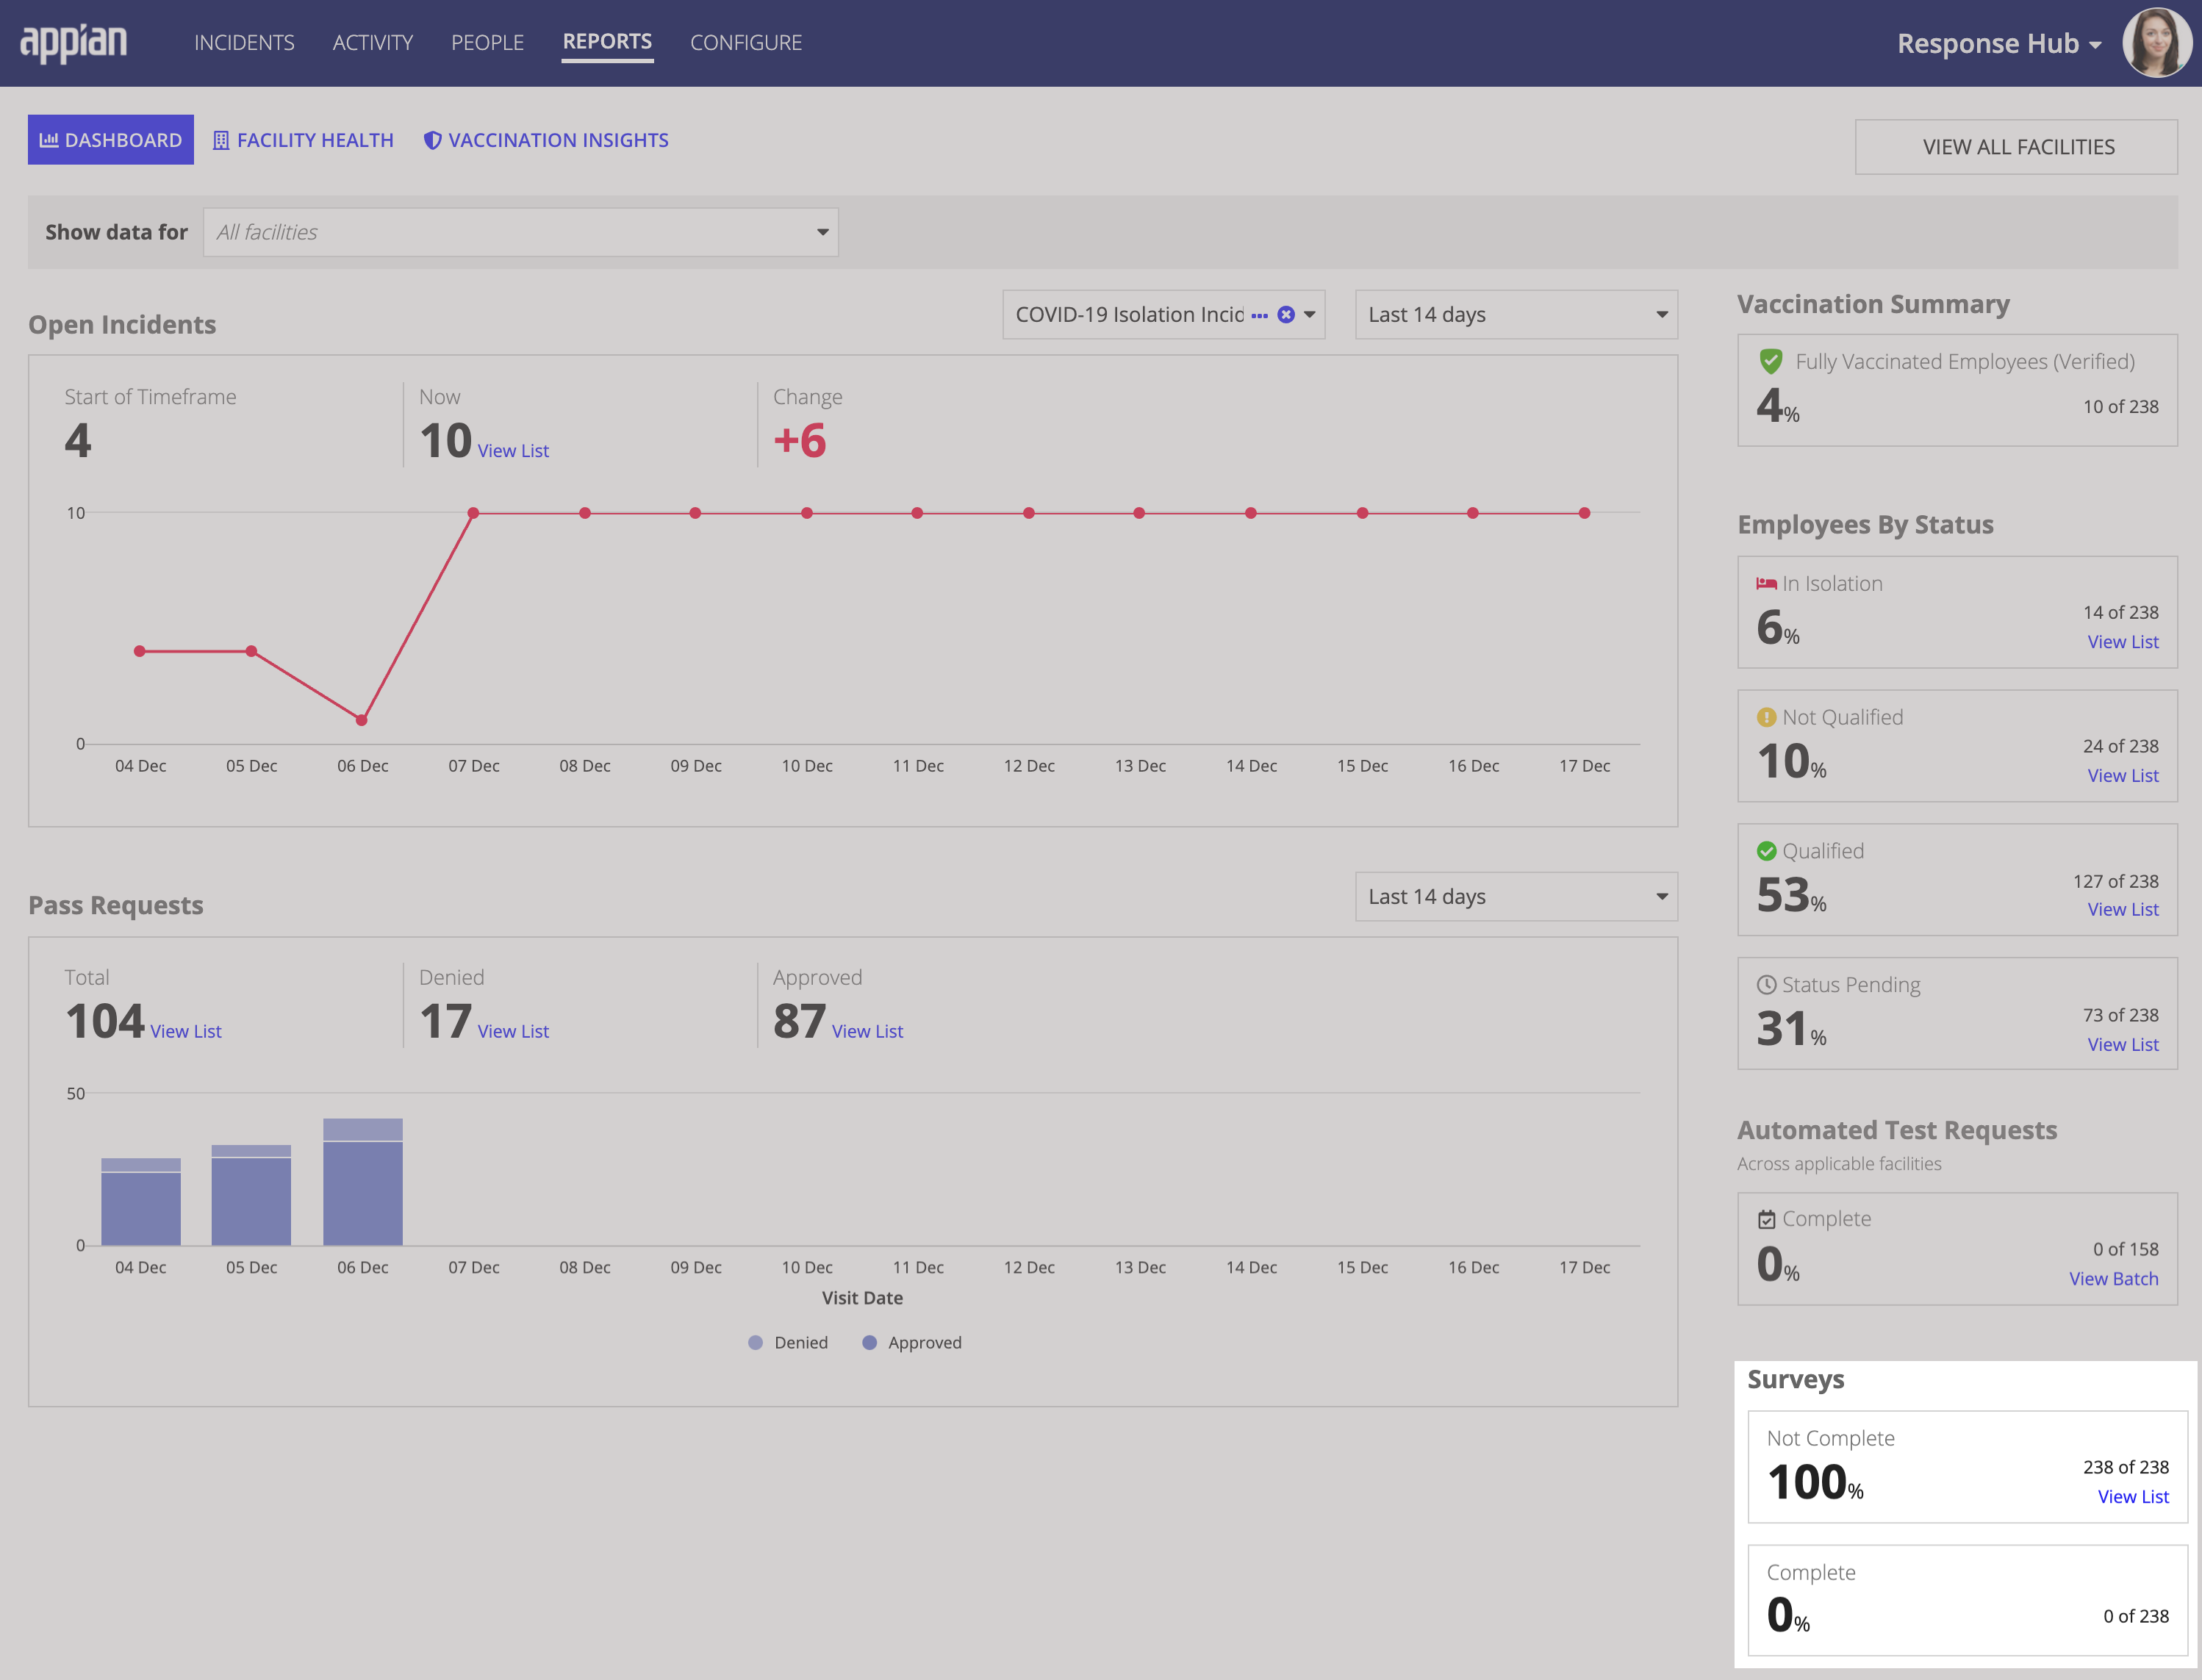
Use the Show data for filter at the top of the page to filter the data in this section by facility and click View List to access an exportable list of survey data.
Note: This section is only visible if your organization has an active survey.
The REPORTS page has a Facility Health tab that allows you to monitor incident trends across facilities. This data helps you identify potential hotspots in your organization for COVID-19 isolation incidents as areas that may need your immediate attention.
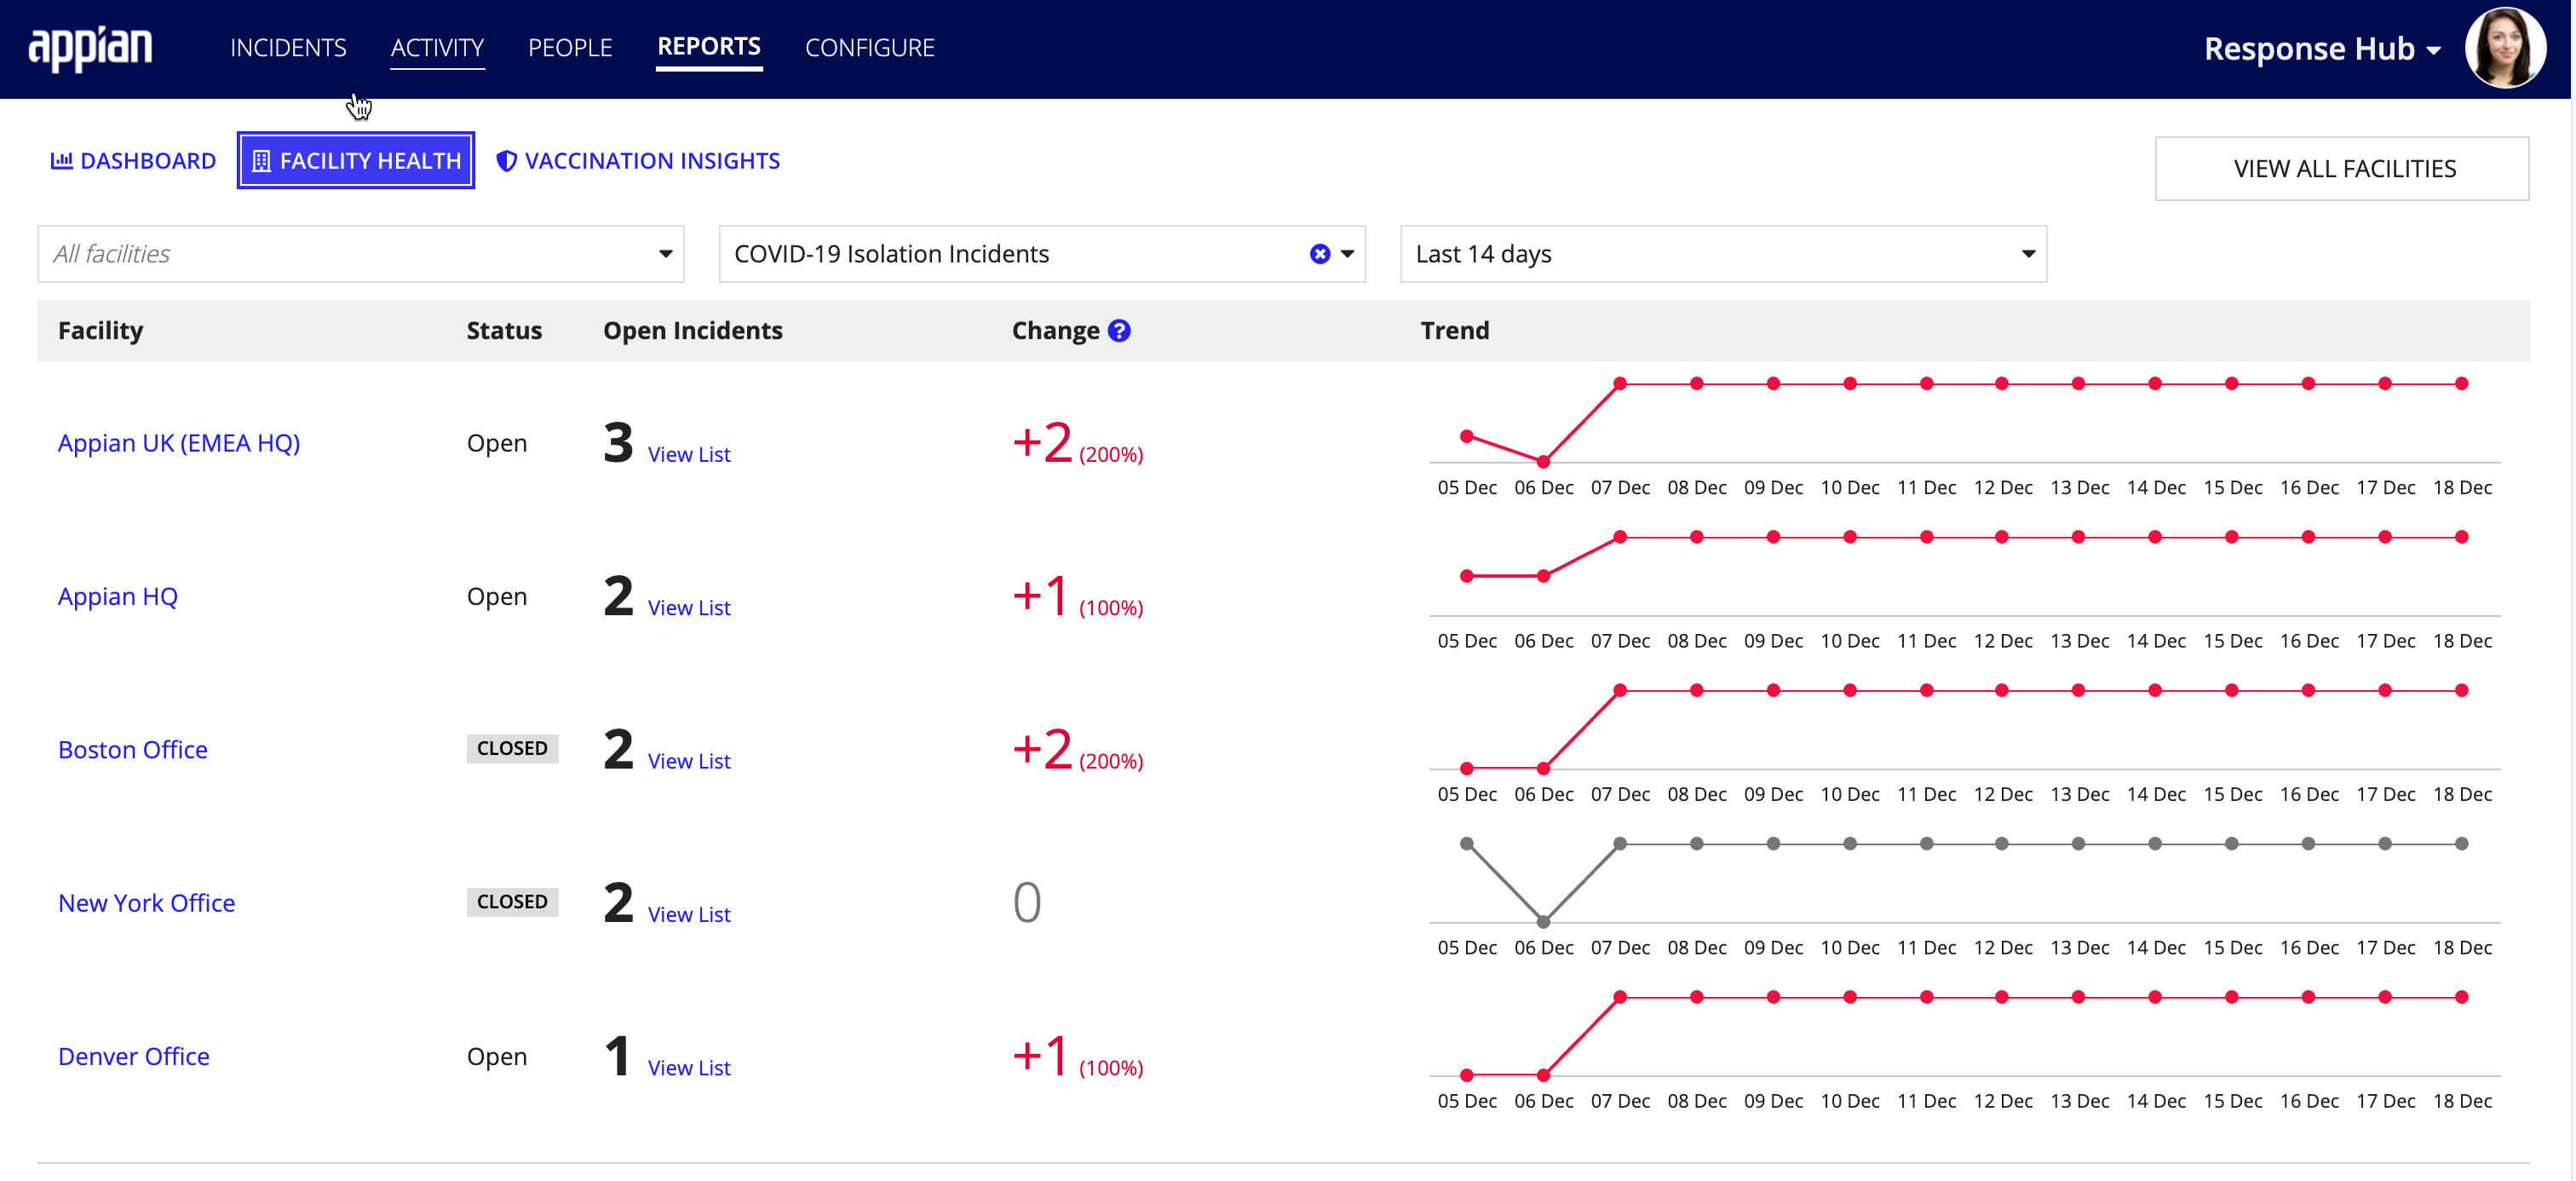
This report ranks your facilities by the number of open incidents, and lists each facility with the following information:
Use the Facility filter to analyze and compare incident trends across specific facilities in a region. Use the Incident Type filter to see the trends for a specific incident type. Use the Date Range filter picker to see trends for a specific period of time.
Additionally, you can click View List to view an exportable list of incidents behind the open incident count.
From the REPORTS page, you can also manage your facilities by adjusting the operating hours for a specific facility, updating visitor arrival instructions, and adding a location from your organization's facility list.
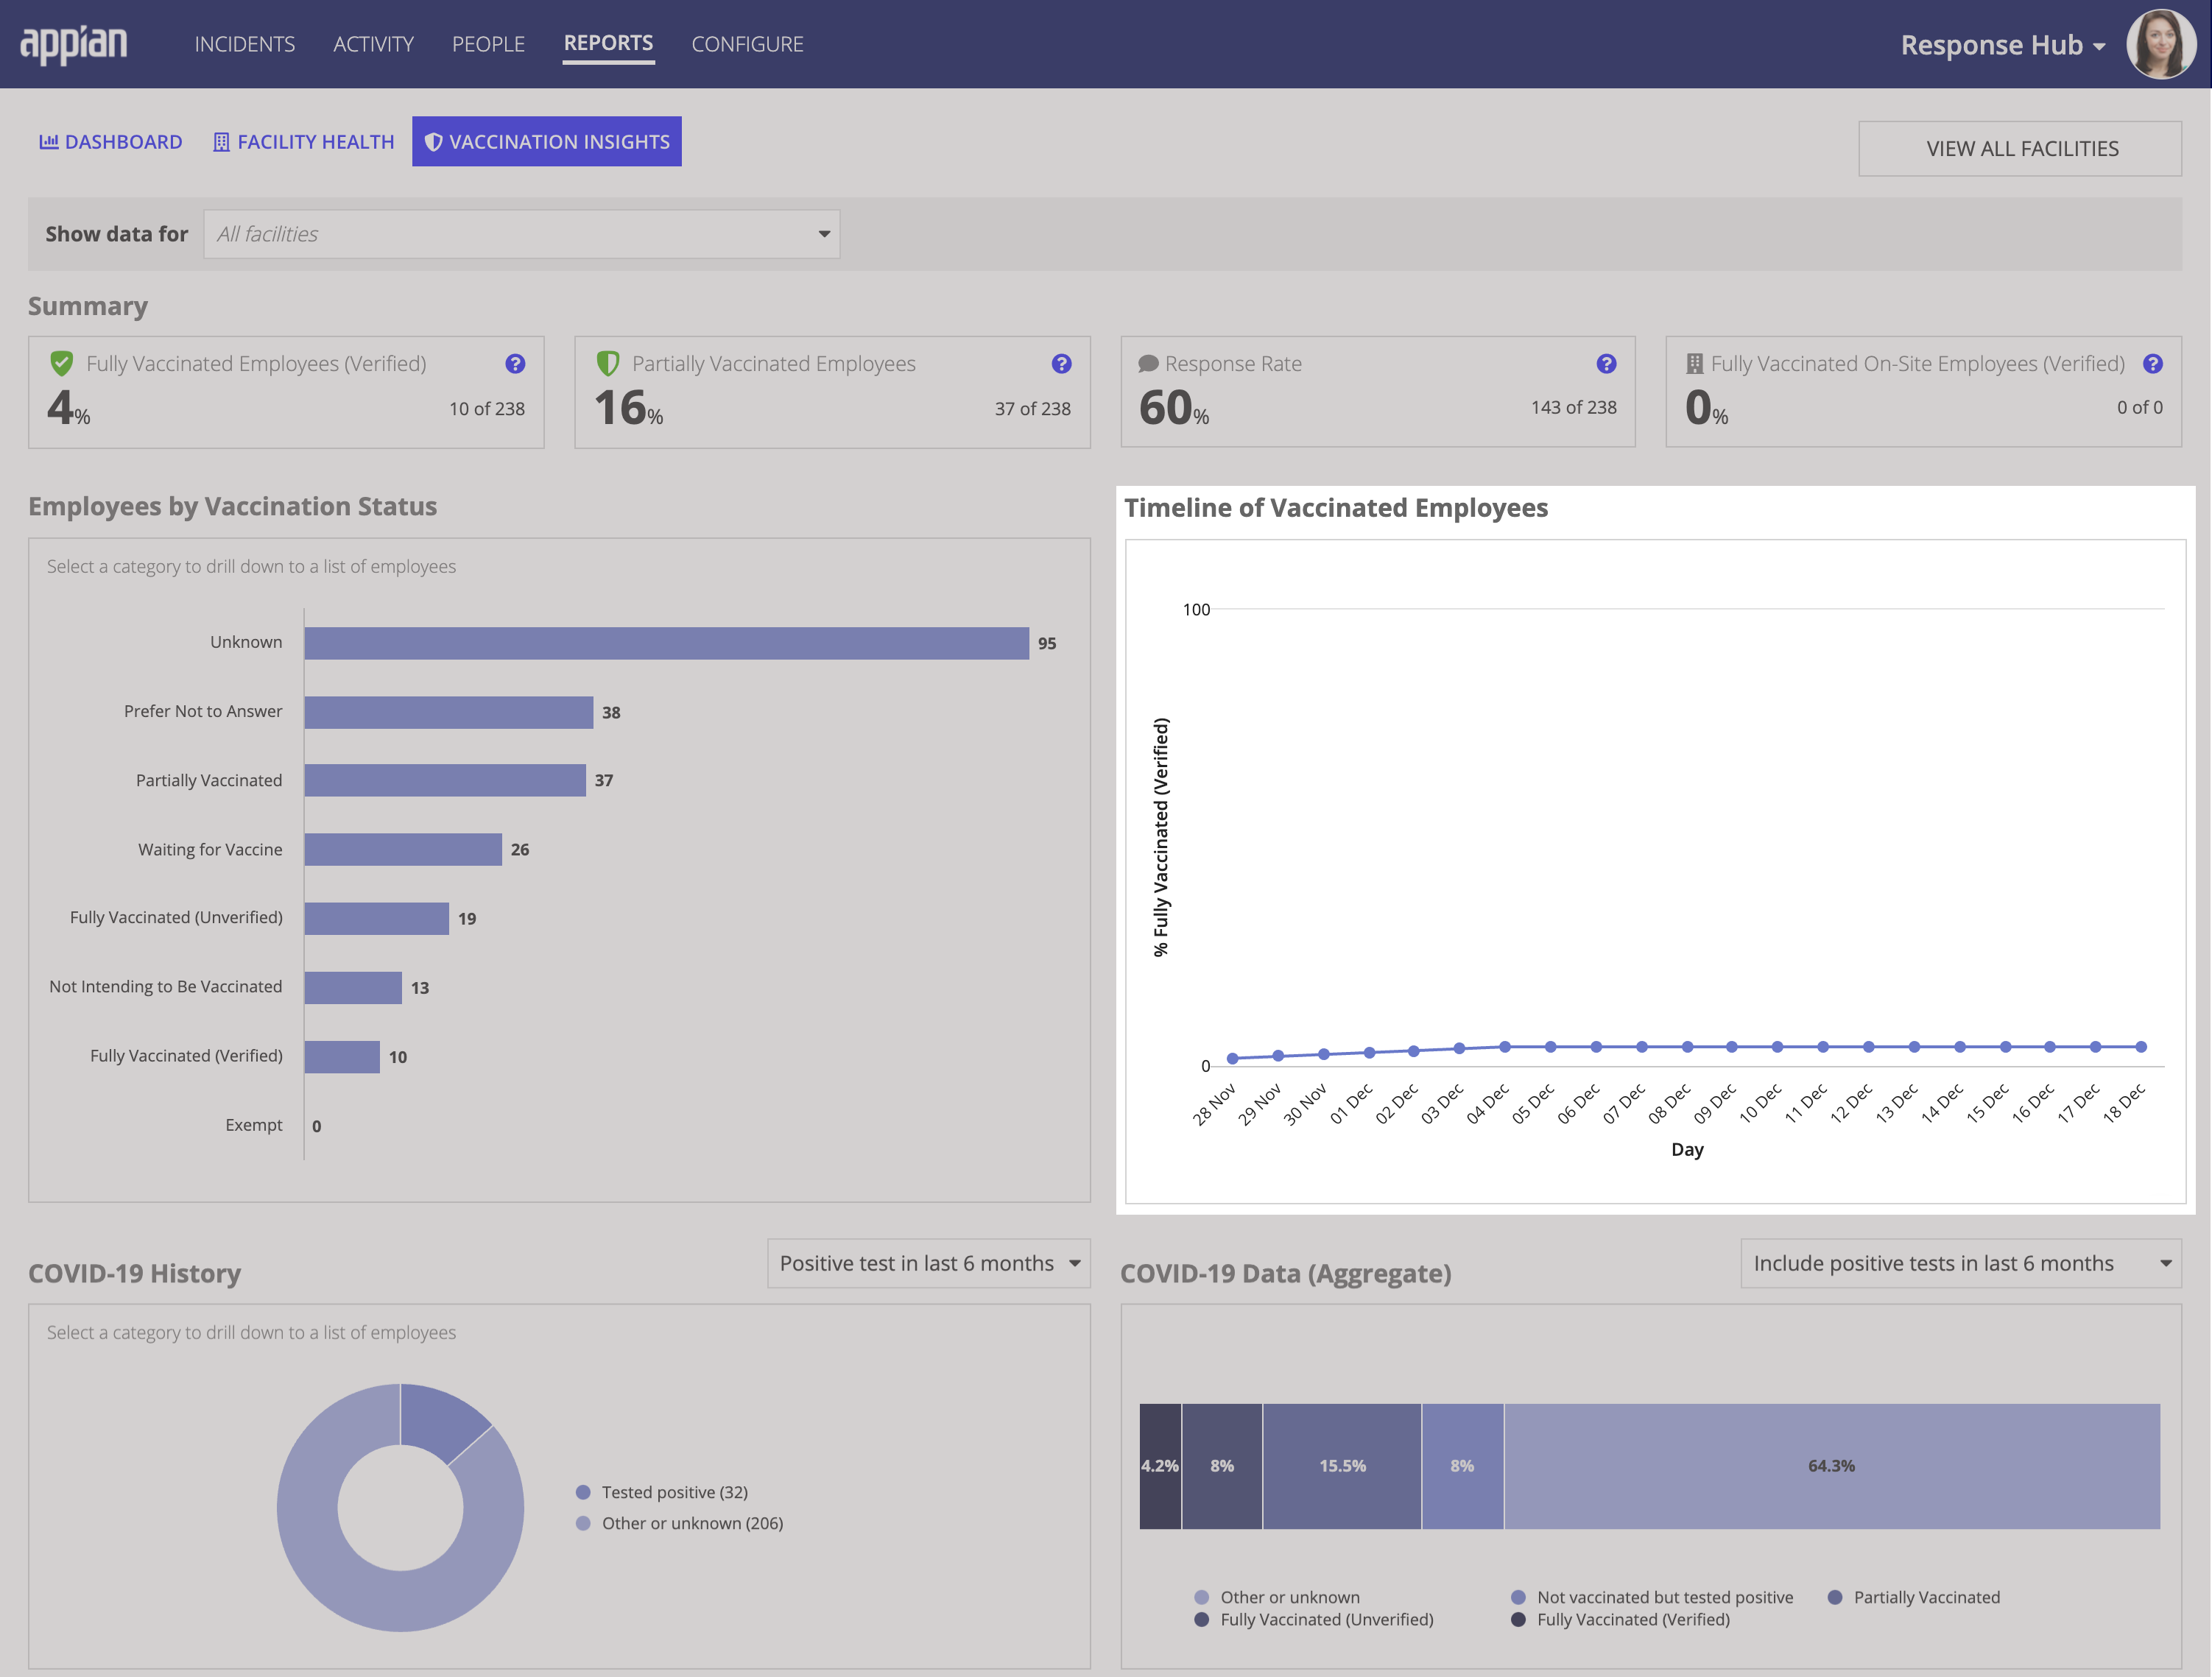
The VACCINATION INSIGHTS tab on the REPORTS page allows you to monitor the health of your organization as it relates to COVID-19 and vaccination data collected from your employees.
As your employees submit their COVID-19 history and their vaccination status, Workforce Safety compiles this data into various reports that display what percentage of your employees have been vaccinated and what percentage have a history of COVID-19 infection. The health data on this tab is displayed in the following reports: Response Rate KPIs, Employees By Vaccination Status, Timeline of Vaccinated Employees, COVID-19 History, and COVID-19 Data (Aggregate).
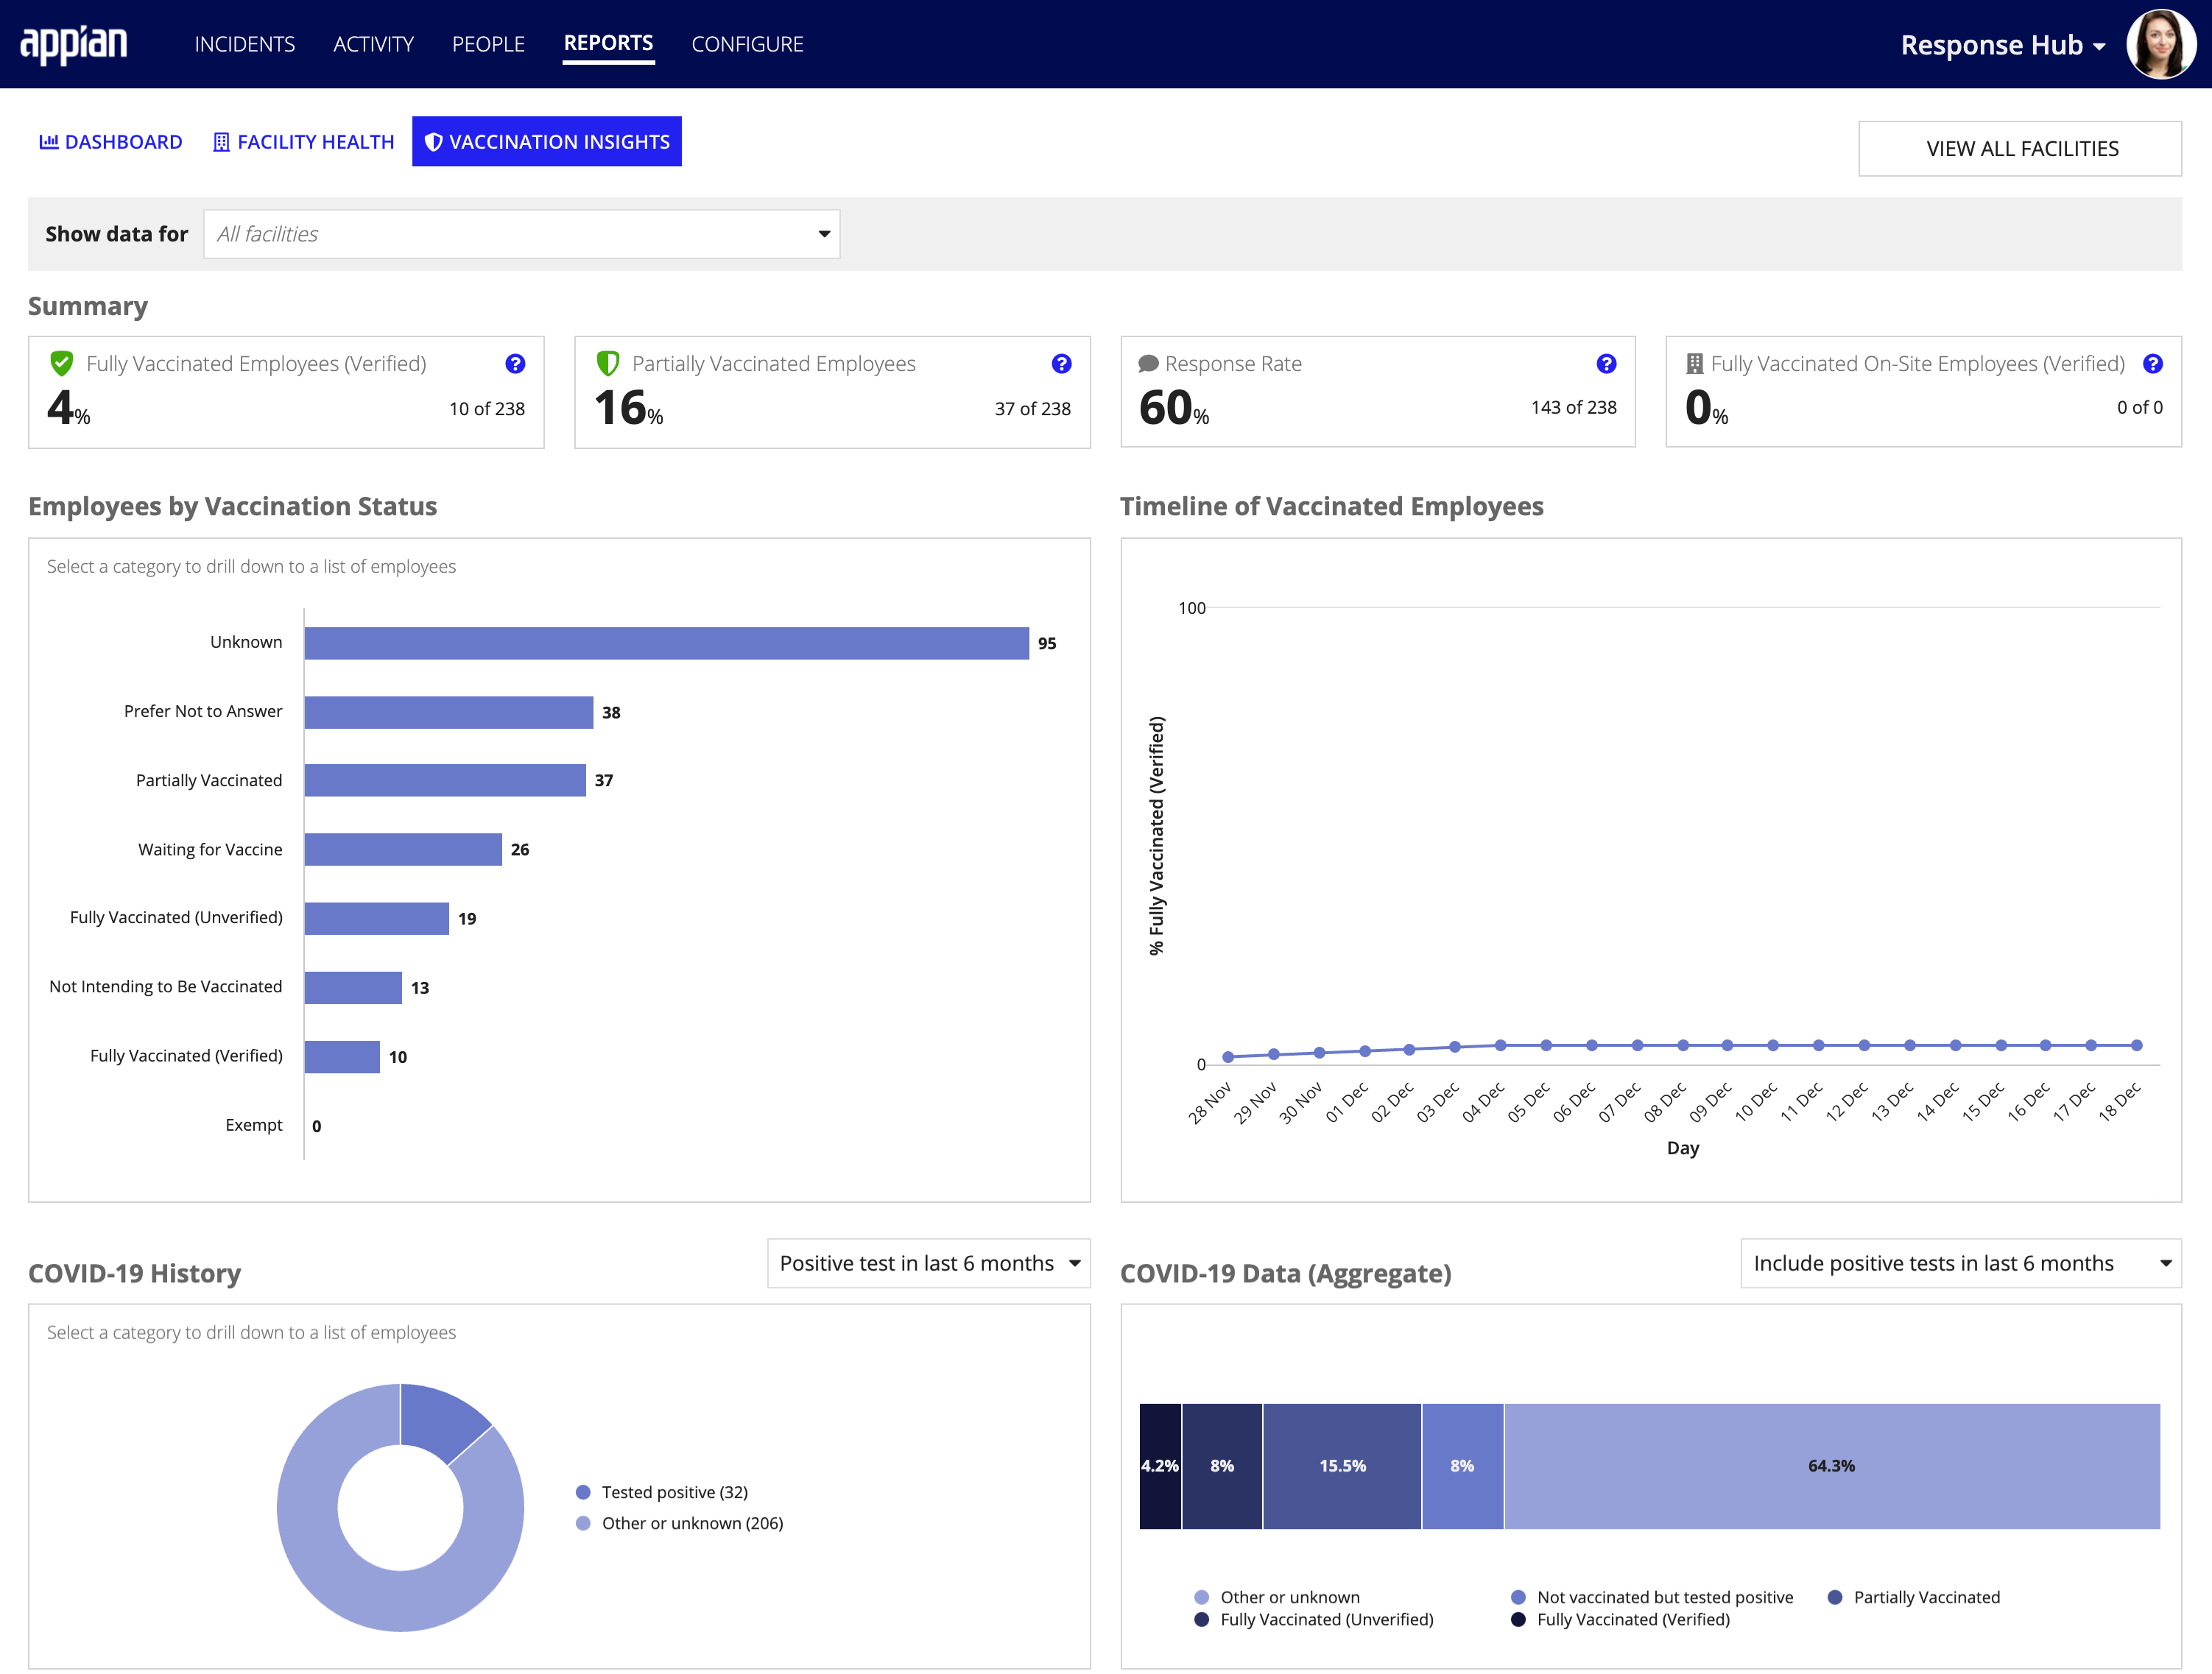
Collectively this data provides you with a clearer understanding of your community’s possible functional immunity levels as they relate to the COVID-19 infection. The reports, which are filterable by facility and timeframe, are only available when you enable the Vaccinations Insights feature in the Configure tab.
The health data displayed at the top of the page shows several KPIs that represent the percentage of employees who have reported their vaccination status in their profile form. Quickly see the percentage and the total number of employees who reported that they are Fully Vaccinated, Partially Vaccinated, and Fully Vaccinated and On-site. You can also see the Response-Rate KPI, which shows the percentage and number of employees from the selected facilities who have reported their vaccination status.
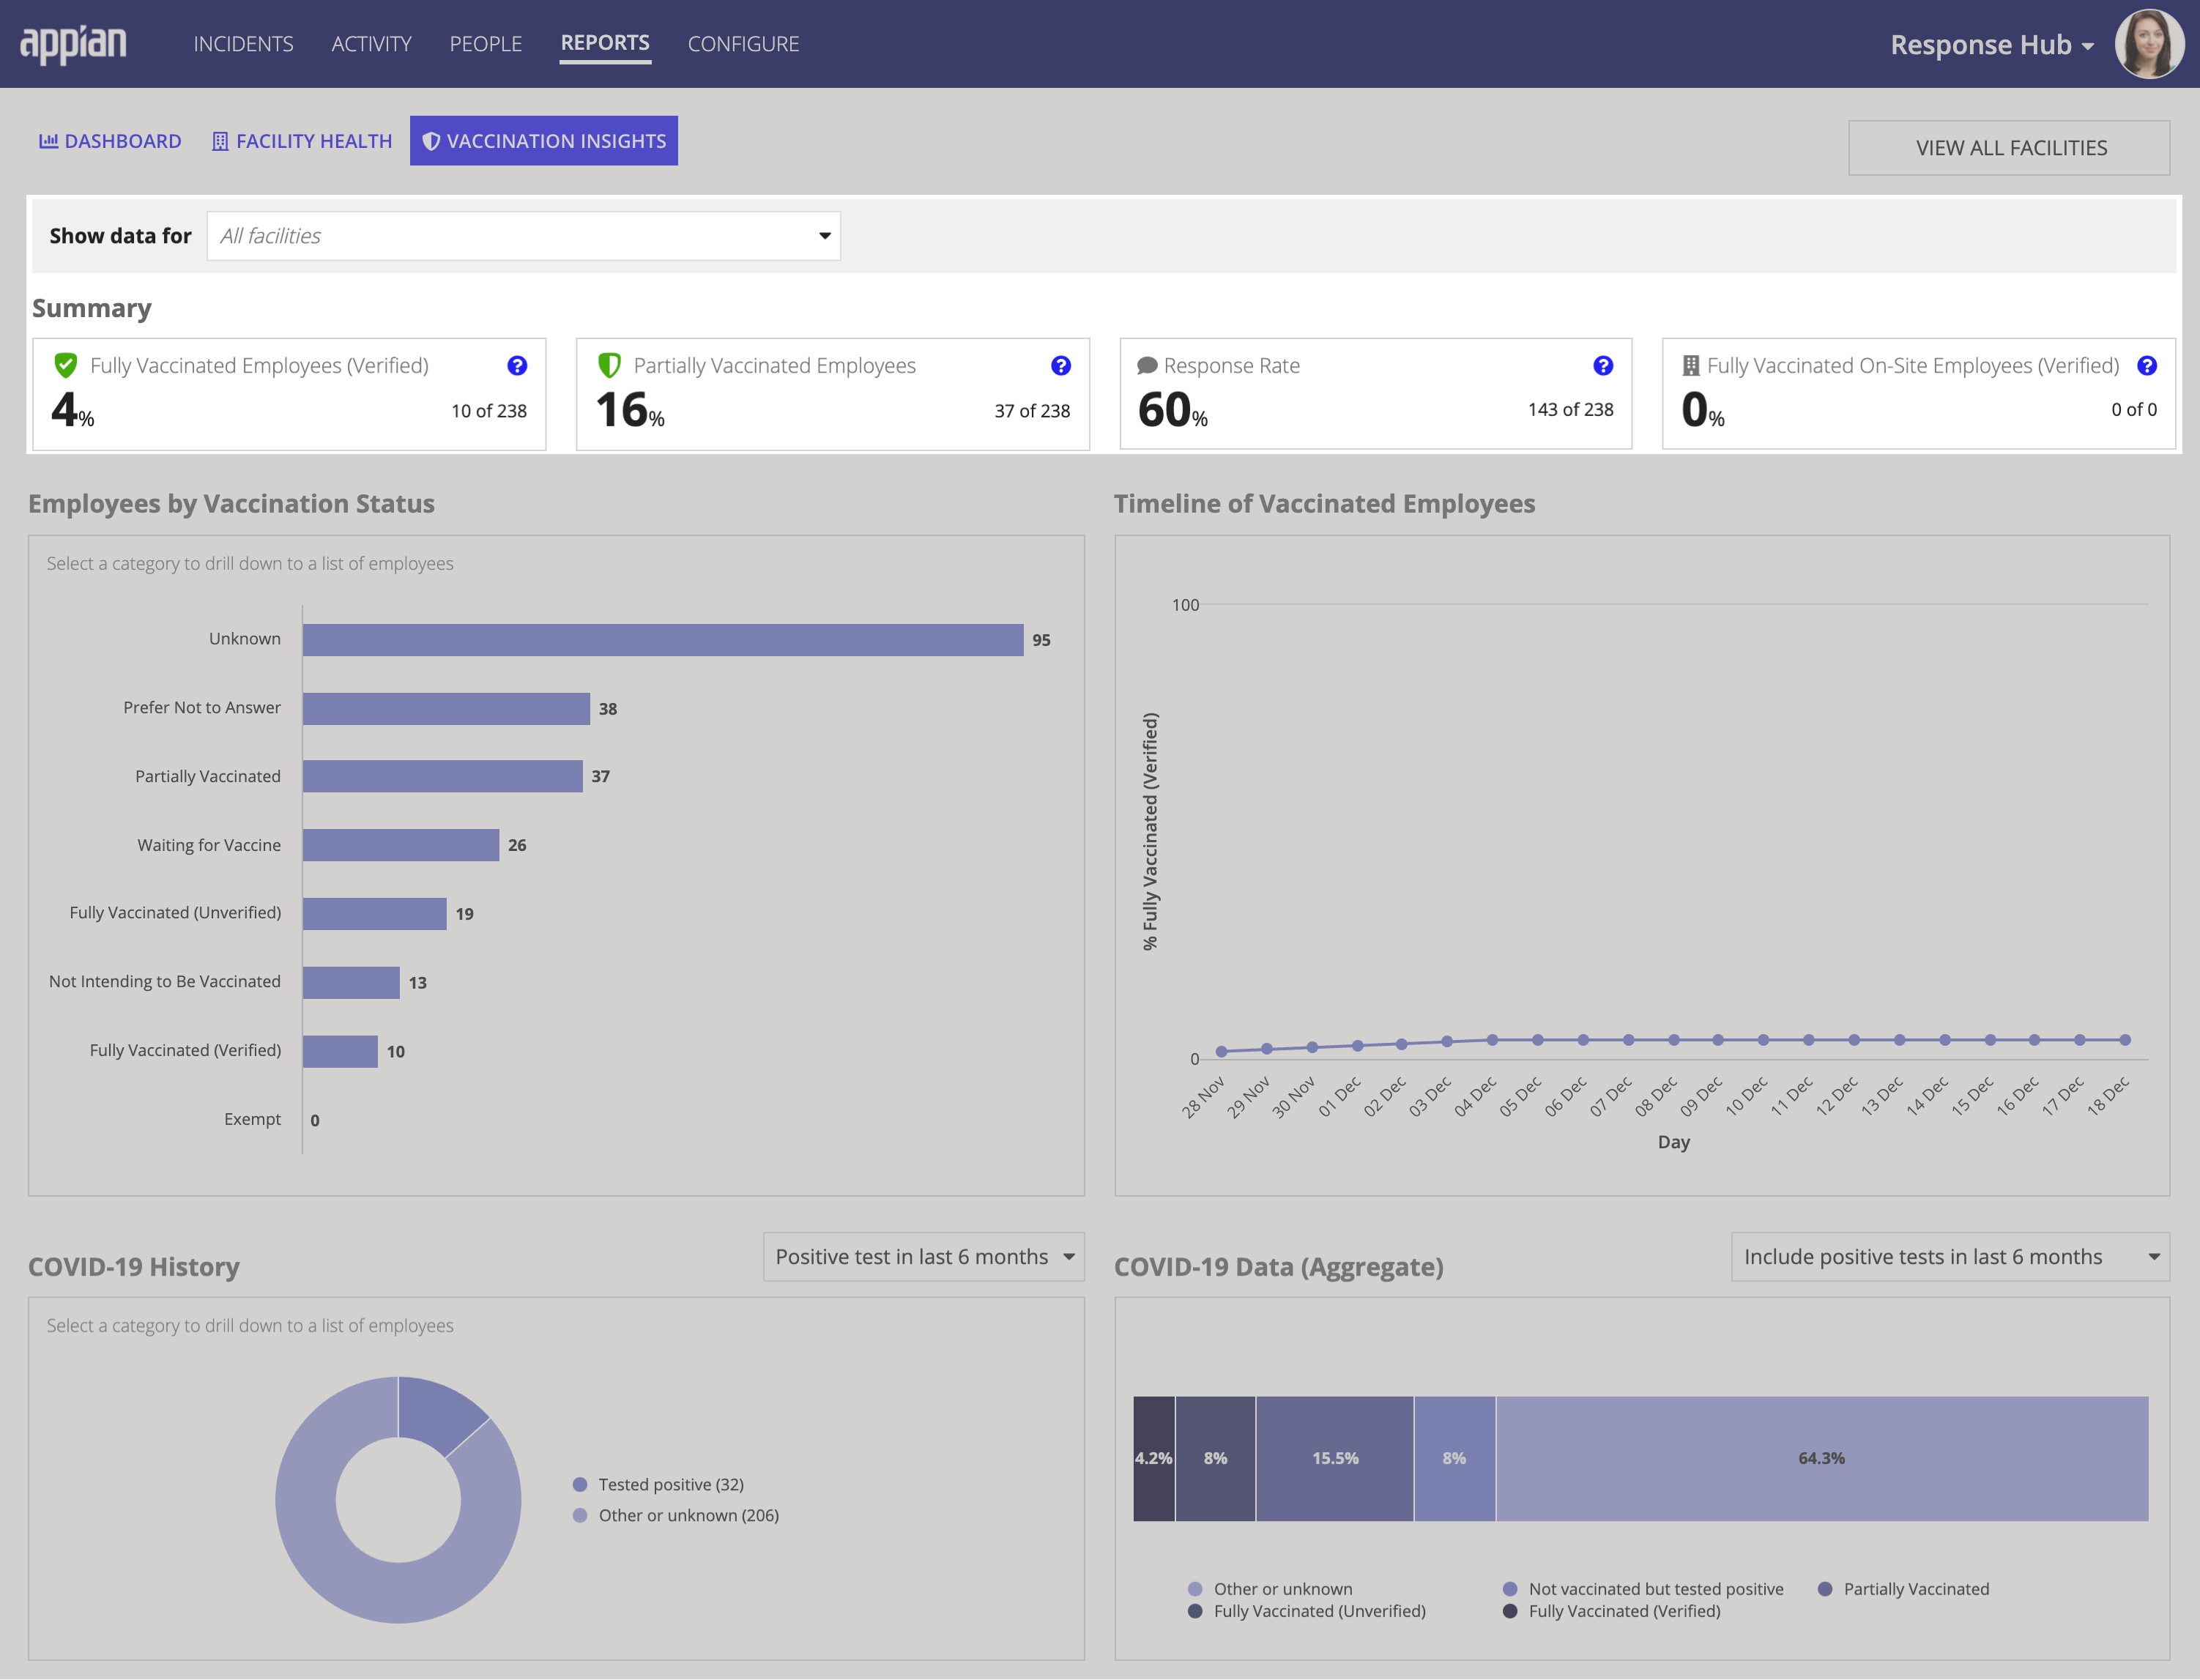
The Fully Vaccinated On-Site Employees metric shows what percentage of the employees have reported a fully vaccinated status, and have also received a pass in the last seven days to one or more of the selected facilities in the facility filter.
This chart displays employees by vaccination status. You can view the data for all of your facilities or you can filter the data to show only selected facilities. Hover over a specific bar in the chart to see the number of employees with that status. When you click a specific bar in the chart, it shows an exportable list of employees with that status.
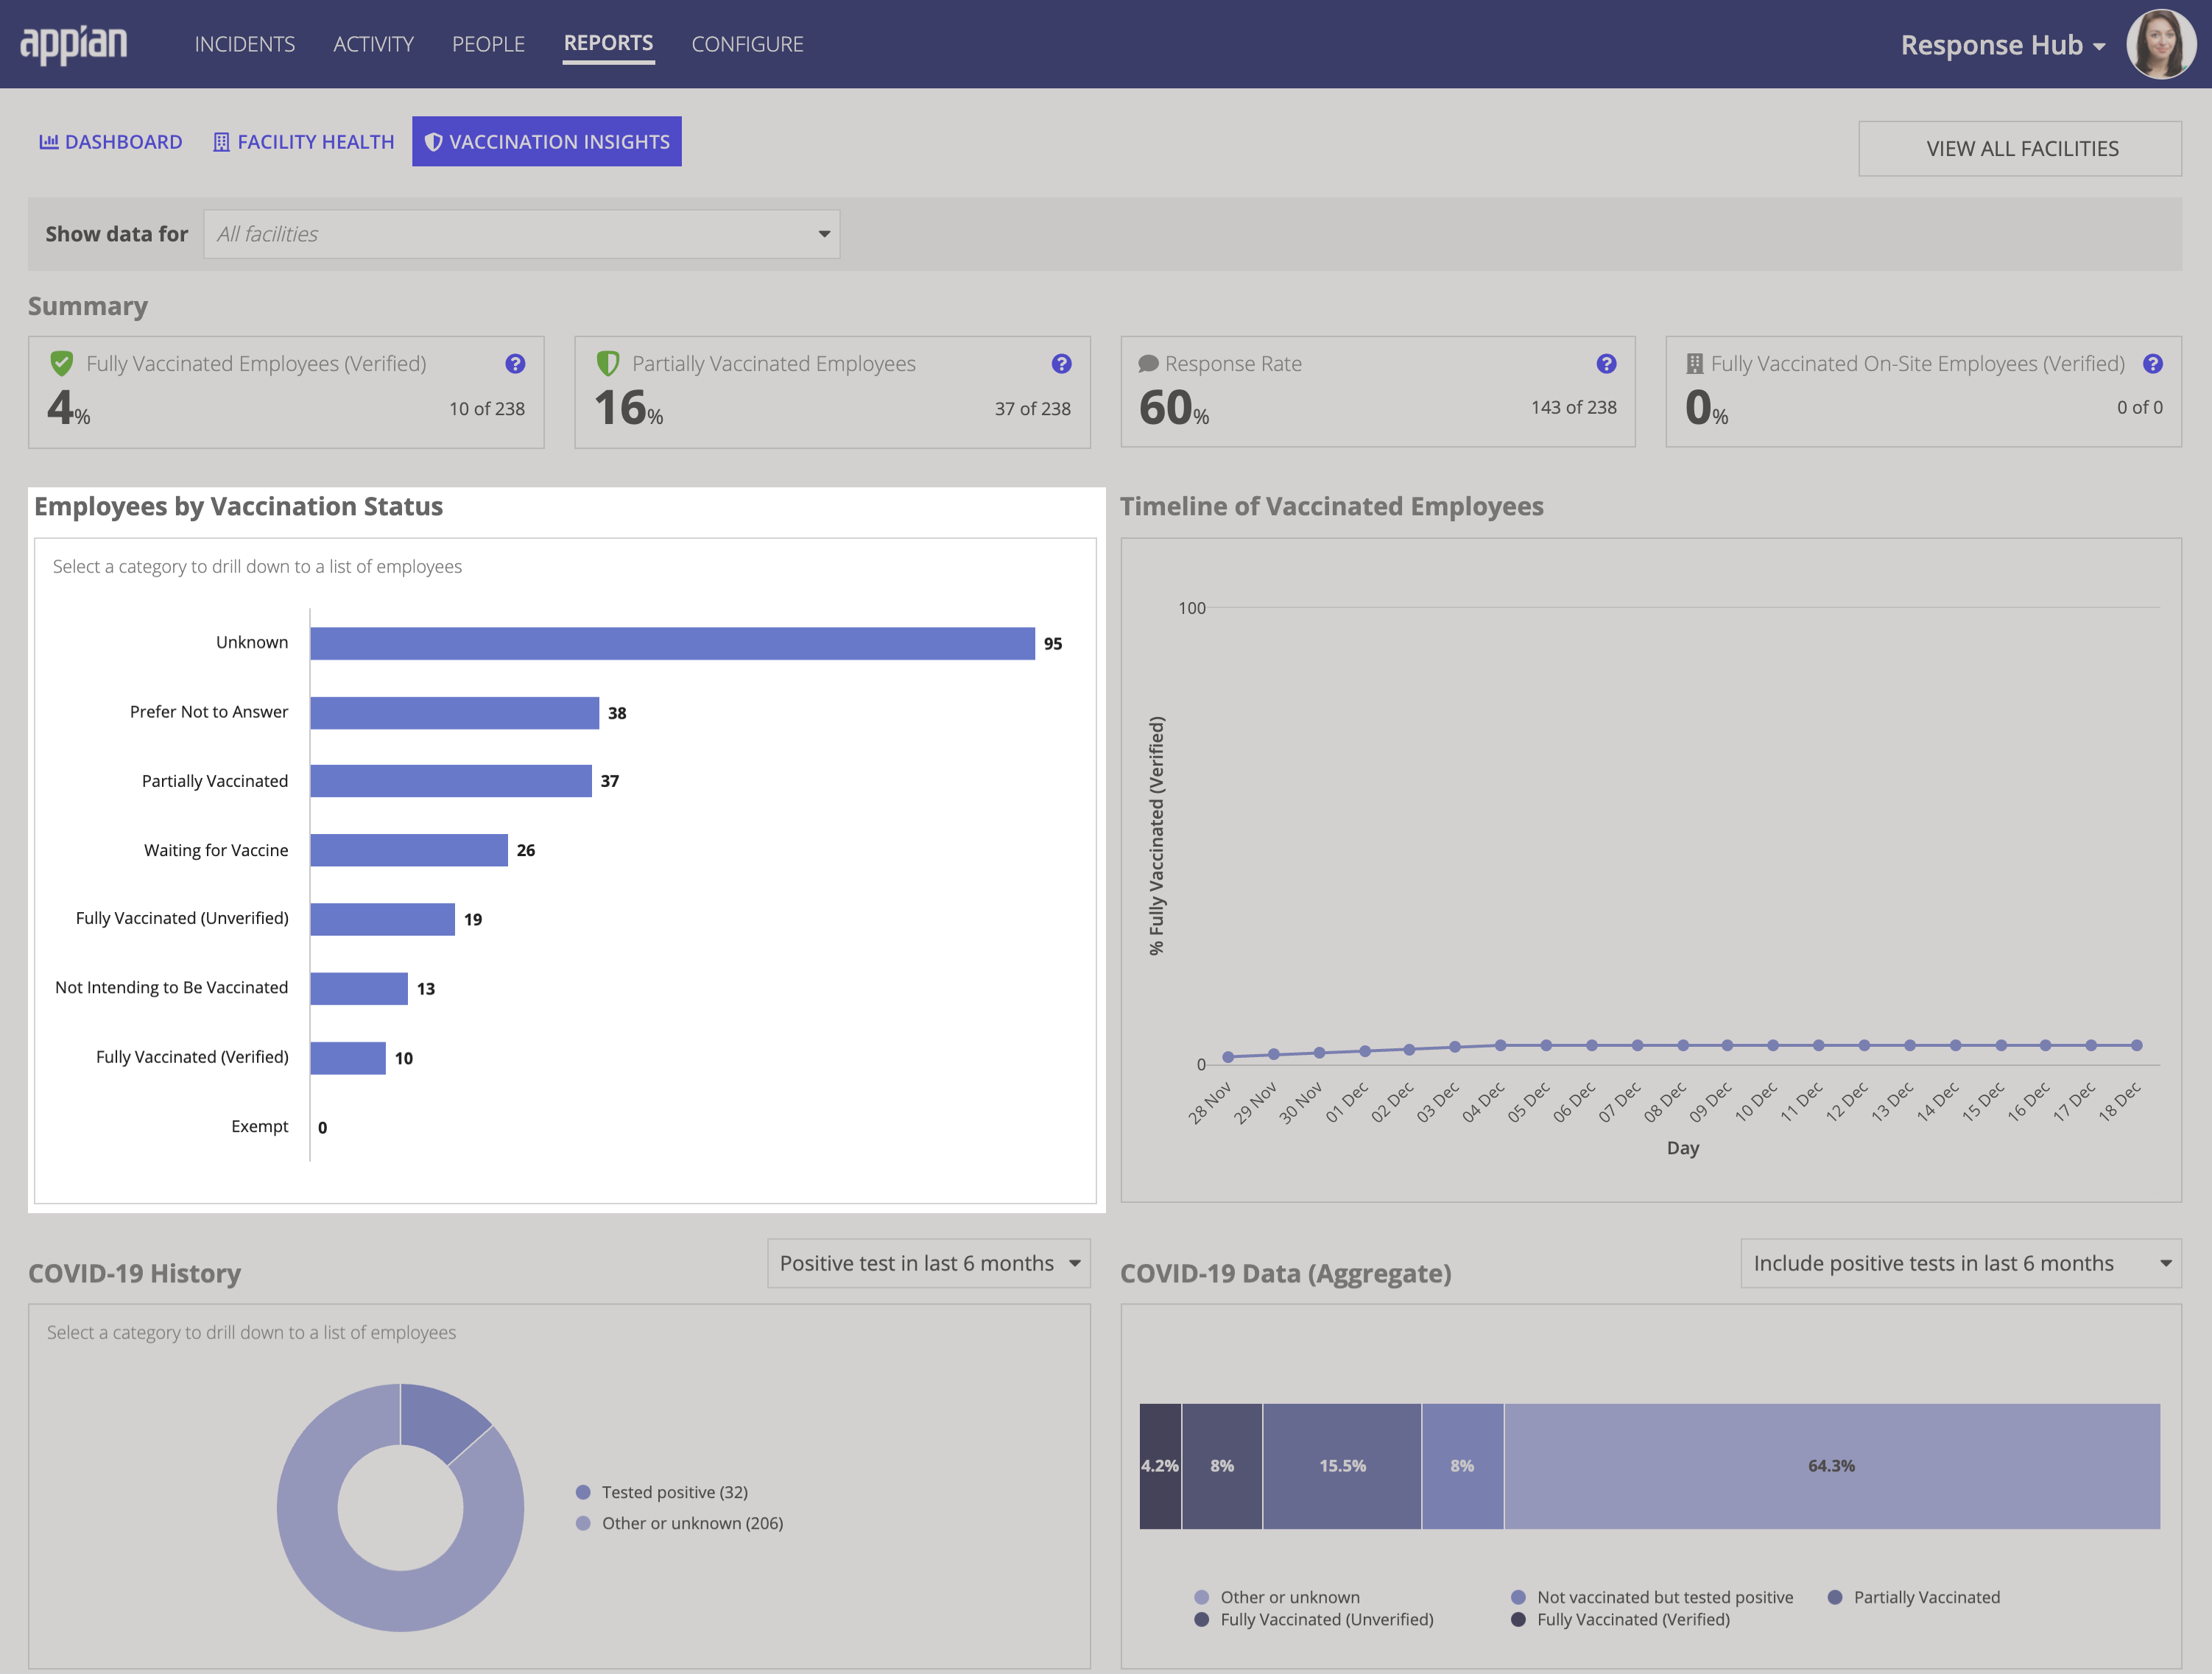
You can view a list of employee by their vaccination status by clicking the bar for a specific vaccination status on the Employees by Vaccination Status bar chart. For example, to view a list of employees who have been marked as exempt, click the employees by Vaccination Status bar chart.
This line chart displays the total population growth of vaccinated employees for all of your facilities or for selected facilities over time. It is only shown if the Vaccination Dose Date question is active.
This pie chart illustrates the percentage of employees who have reported a positive COVID-19 test result within the selected timeframe. A user can report these positive test results may be reported via their profile, a test request, or a COVID-19 isolation incident.
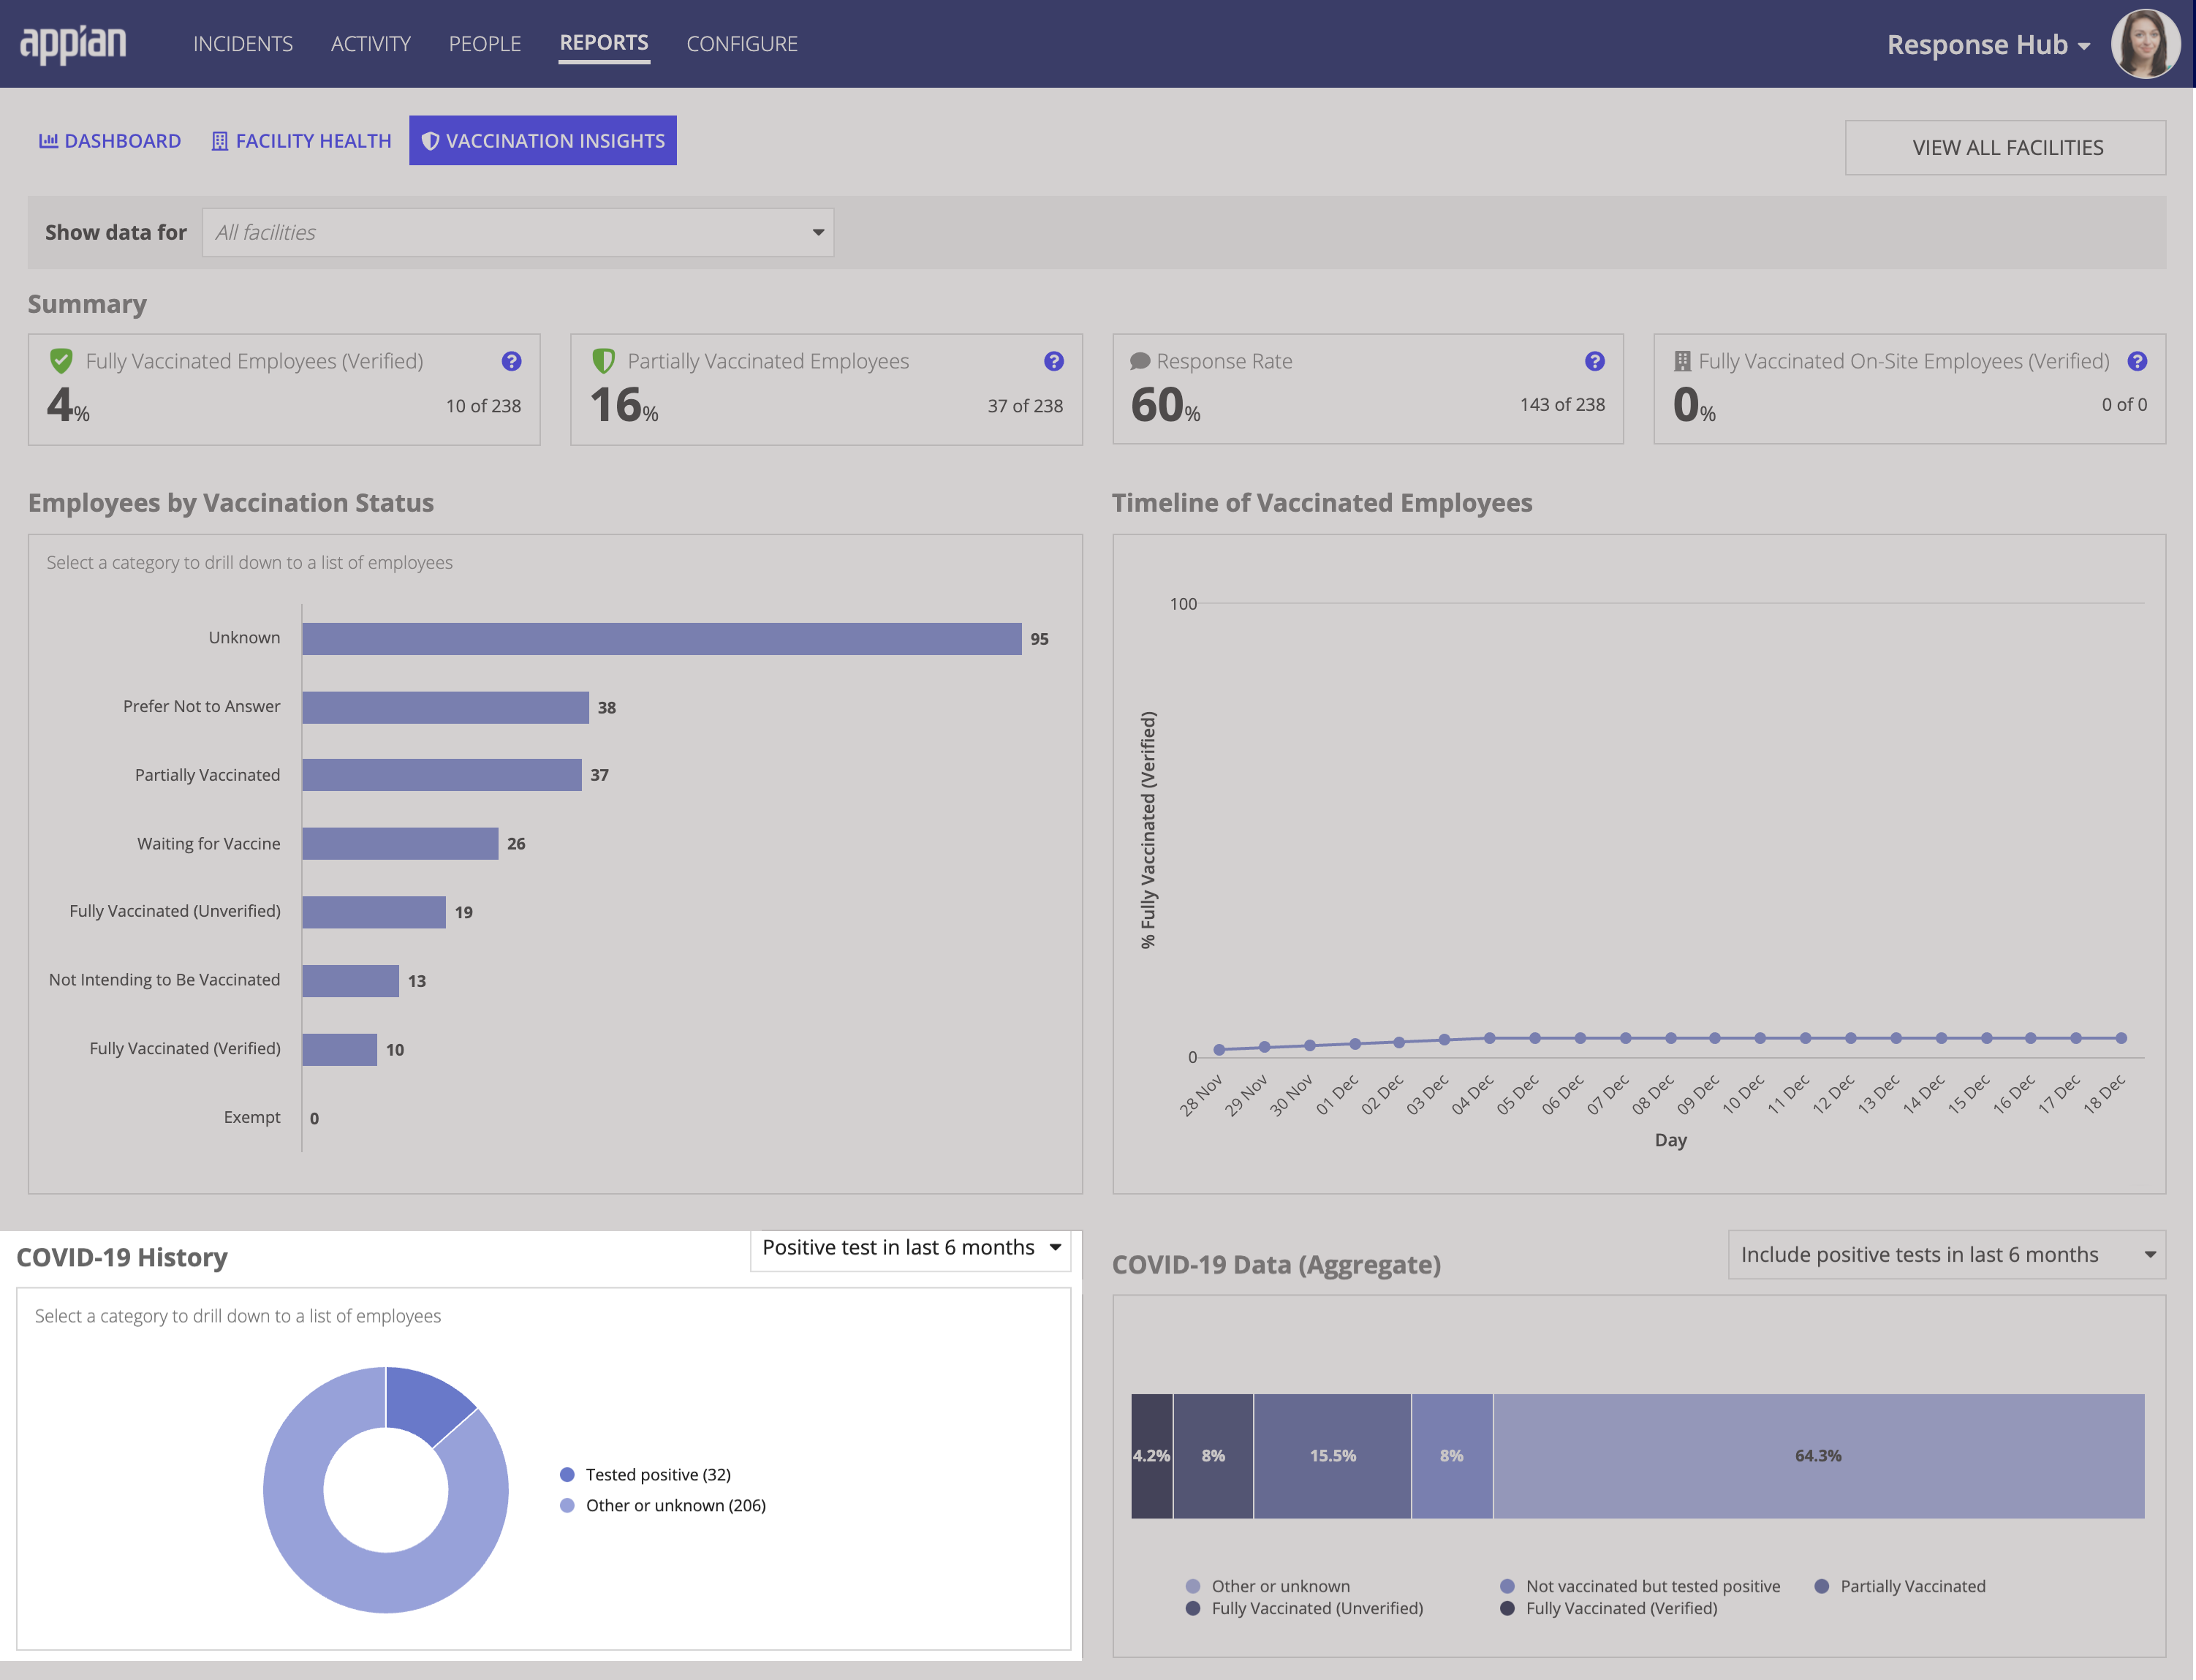
This chart is only available if the COVID-19 History question is active.
This stacked chart combines the vaccination data and COVID-19 history data to illustrate your organization’s broader COVID-19 health. With this chart you can see the percentage of employees who have been fully vaccinated, partially vaccinated, and employees who reported testing positive for COVID-19 in the selected time frame.
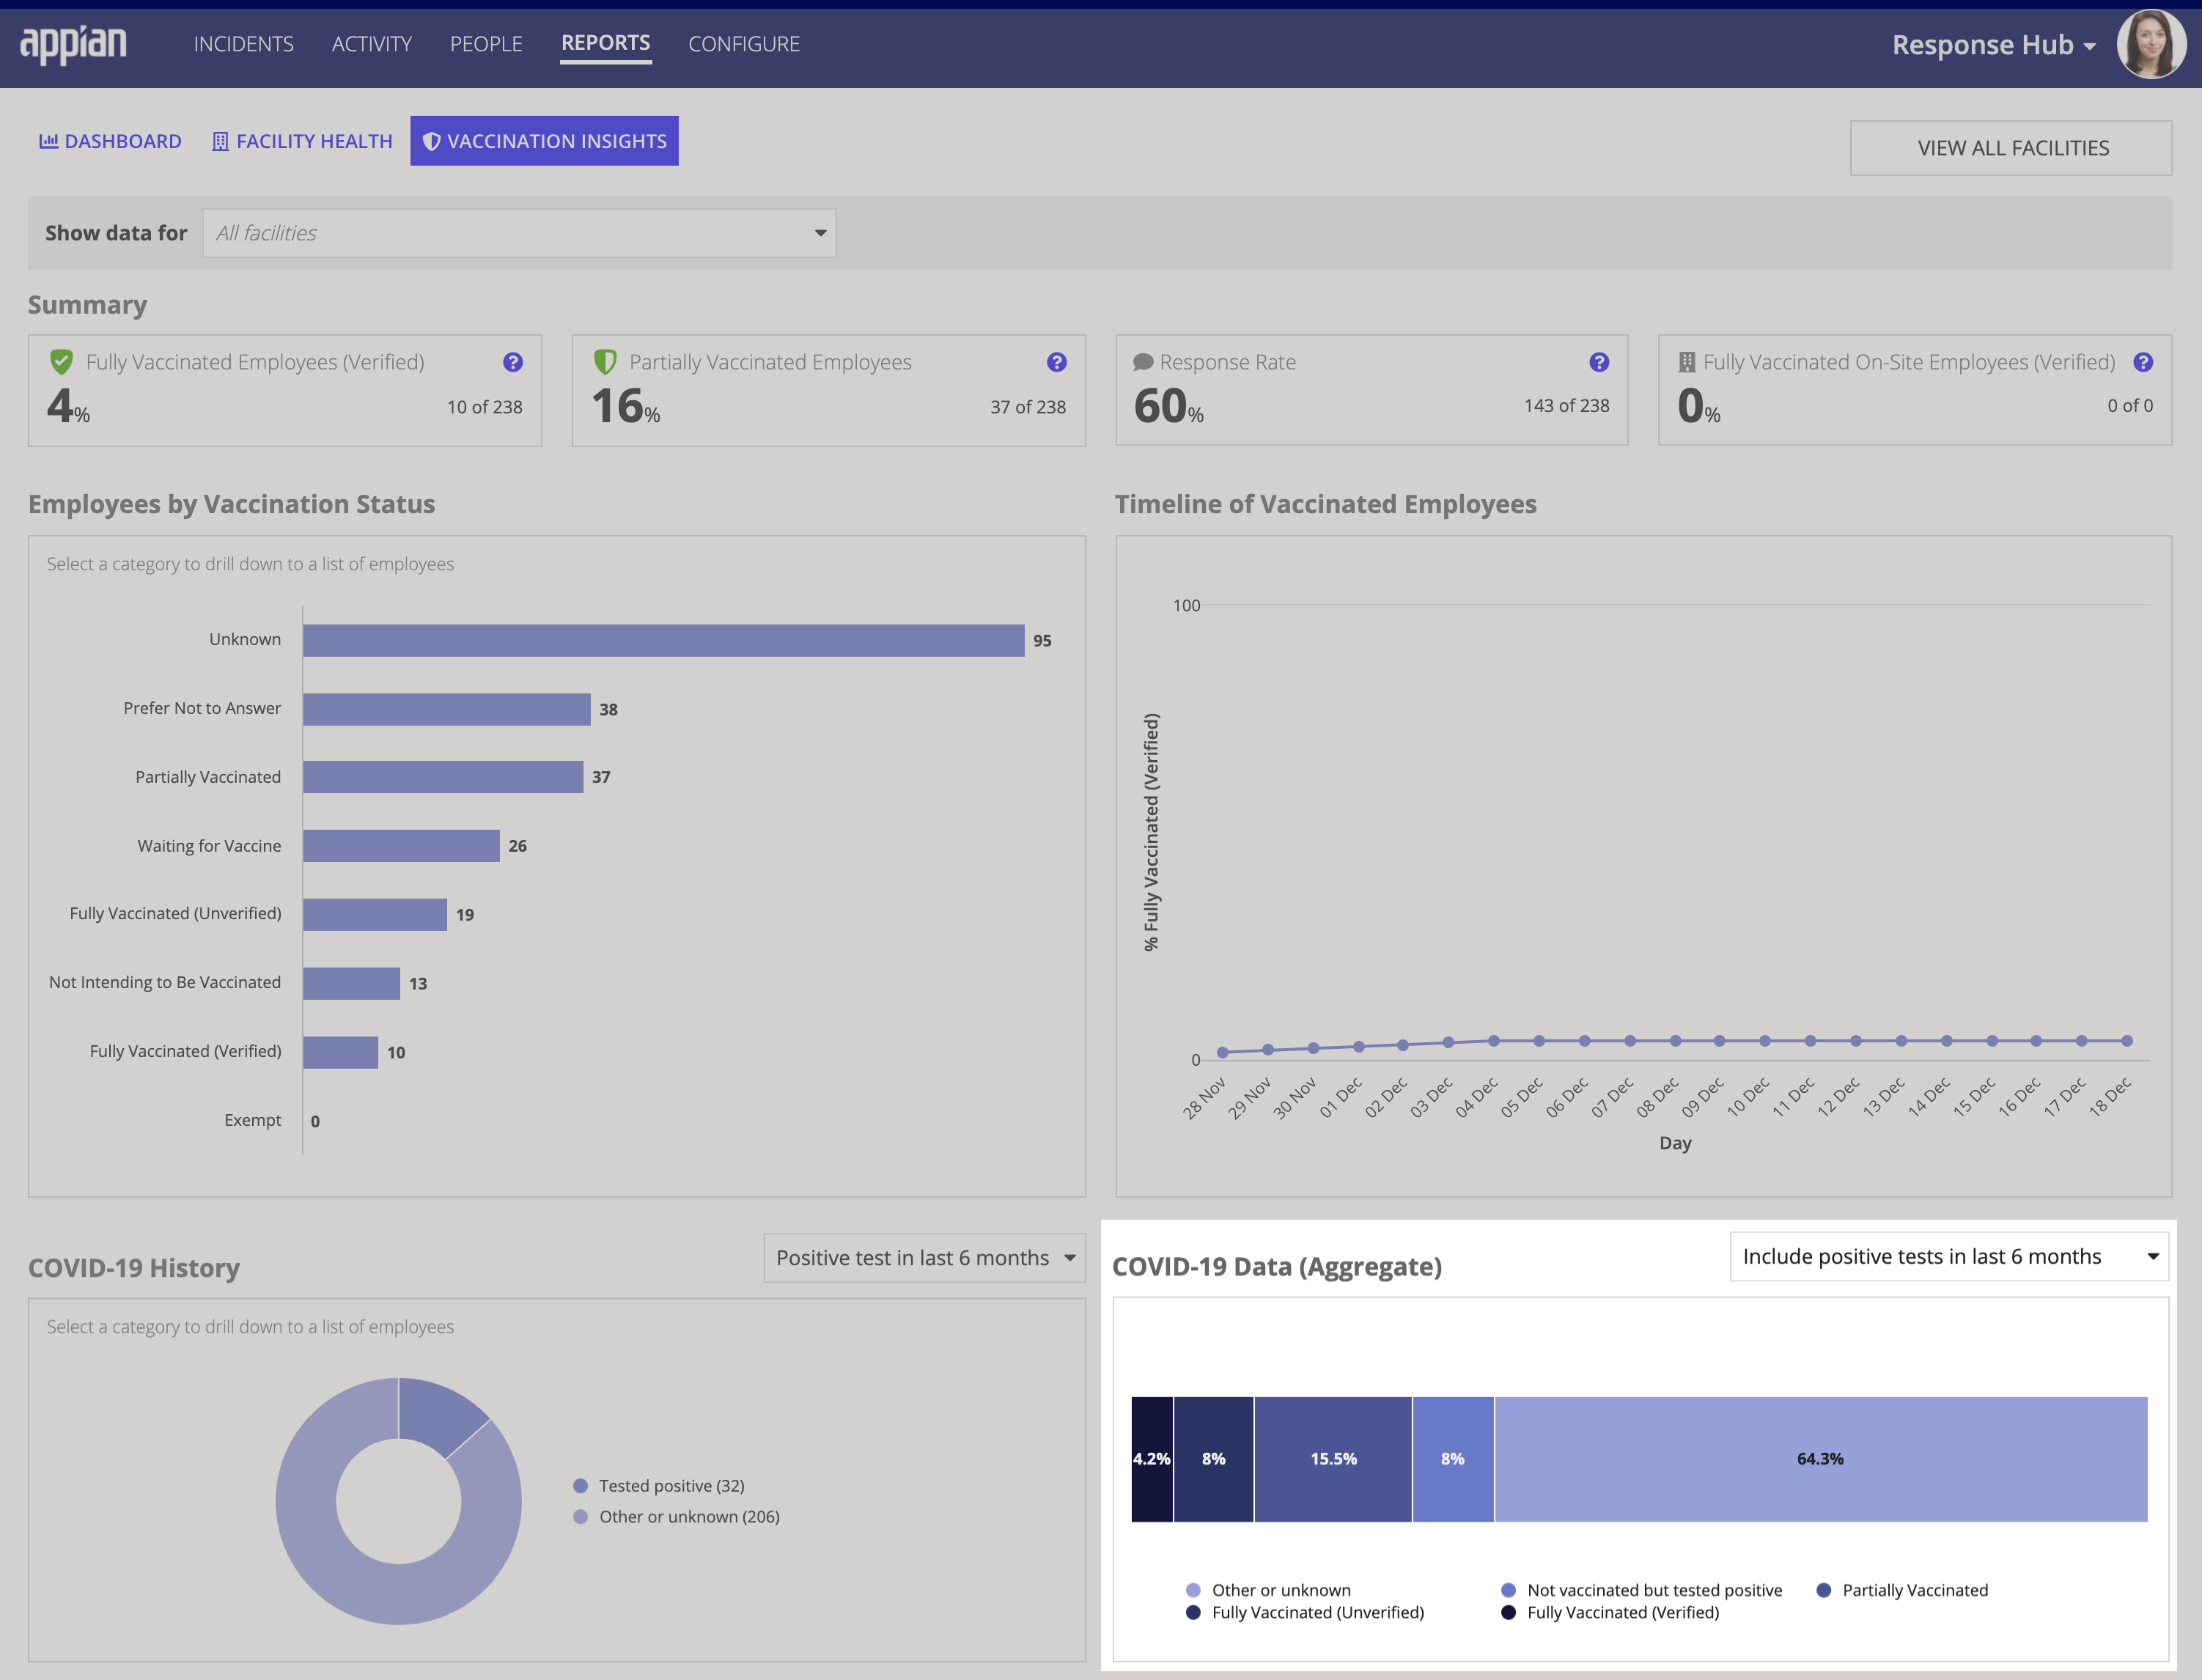
Like the other charts, this chart is only available if the COVID-19 History question is active.
The CONFIGURE page provides the ability to customize various options including questionnaire questions, facilities, site features, and more. Employee are also able to brand and tailor their site to better fit their organization.
To configure the Workforce Safety site, follow the instructions in the configure site section.