| This content applies solely to Connected Underwriting, which must be purchased separately from the Appian base platform. This content was written for Appian 22.4 and may not reflect the interfaces or functionality of other Appian versions. |
The REPORTS page allows underwriters and managers to view and generate on-demand reports that show key metrics and details about submissions that match specific criteria, view and analyze trends to better understand their team's performance and a portfolio dashboard that allows them to surface customer data through a PowerBI integration.
The REPORTS page has three main parts:
Caution: To pull your external customer and claims data into your Connected Underwriting solution and view it from the Portfolio View tab under REPORTS, You must configure the connected system for the Microsoft PowerBI integration.
This page describes how to use the REPORTS page to find the data you need to understand where your submissions are in the underwriting process, how well your team is performing and where they need more support, and how to access your customer data in other systems in the Connected Underwriting solution.
Connected Underwriting allows you to generate and view on-demand reports that provide real-time data about all submissions in the underwriting pipeline for a given period or submissions that match specific criteria. The up-to-date information in these reports gives you greater confidence in your decisions because you know the data is current and accurate.
Key metrics at the top of this page provide a quick snapshot of where your business stands with regard to submissions resulting in new business, renewals, acceptance, and declines.
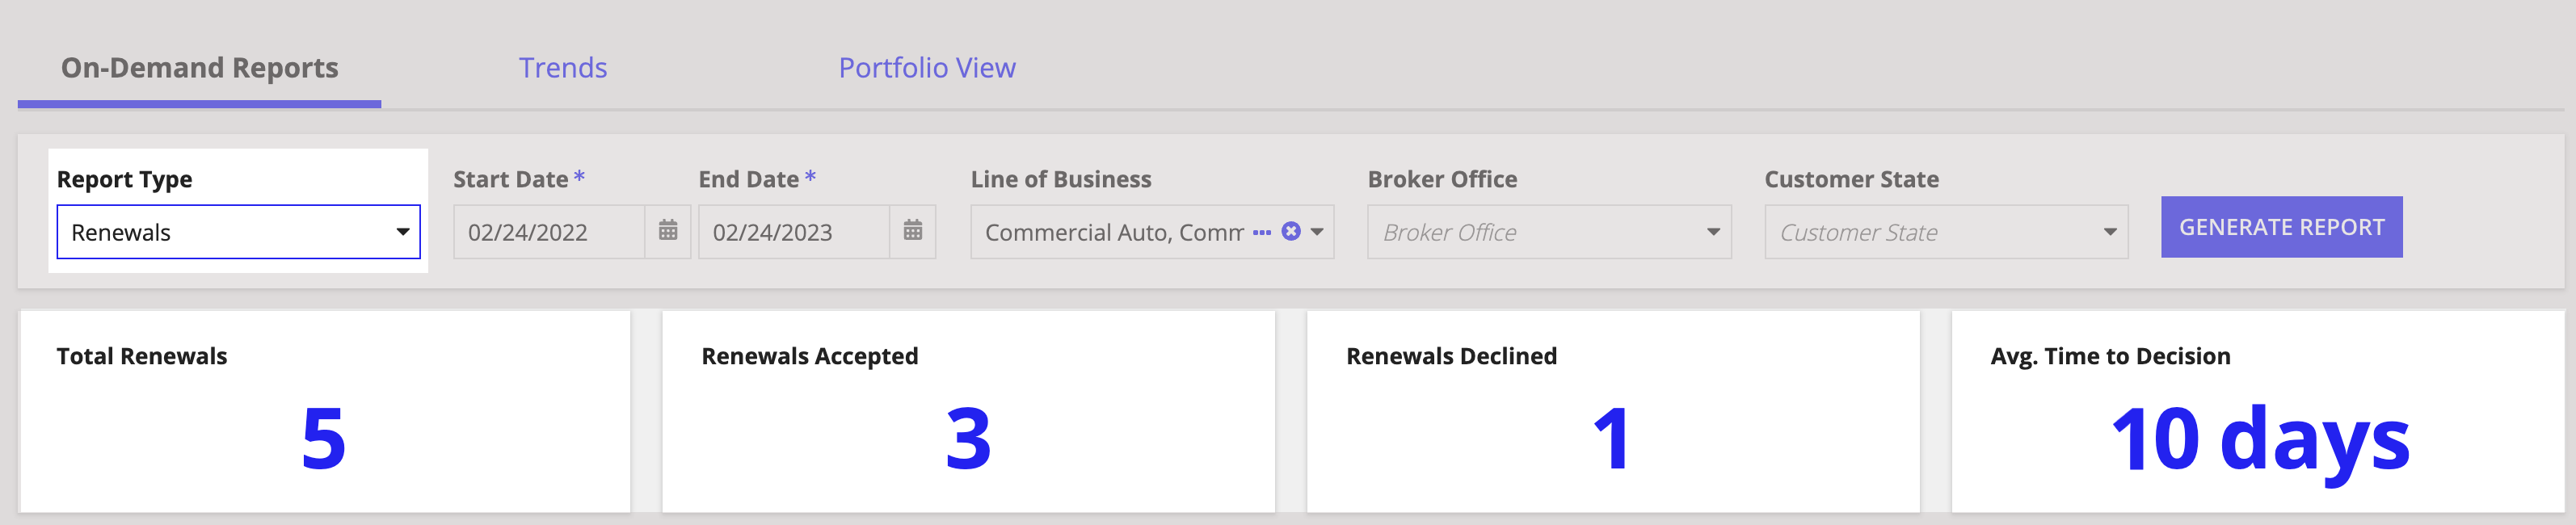
When you navigate to the REPORTS page, by default, the On-Demand Report tab is selected, and Connected Underwriting displays an on-demand report for all New Businesses for the current date.
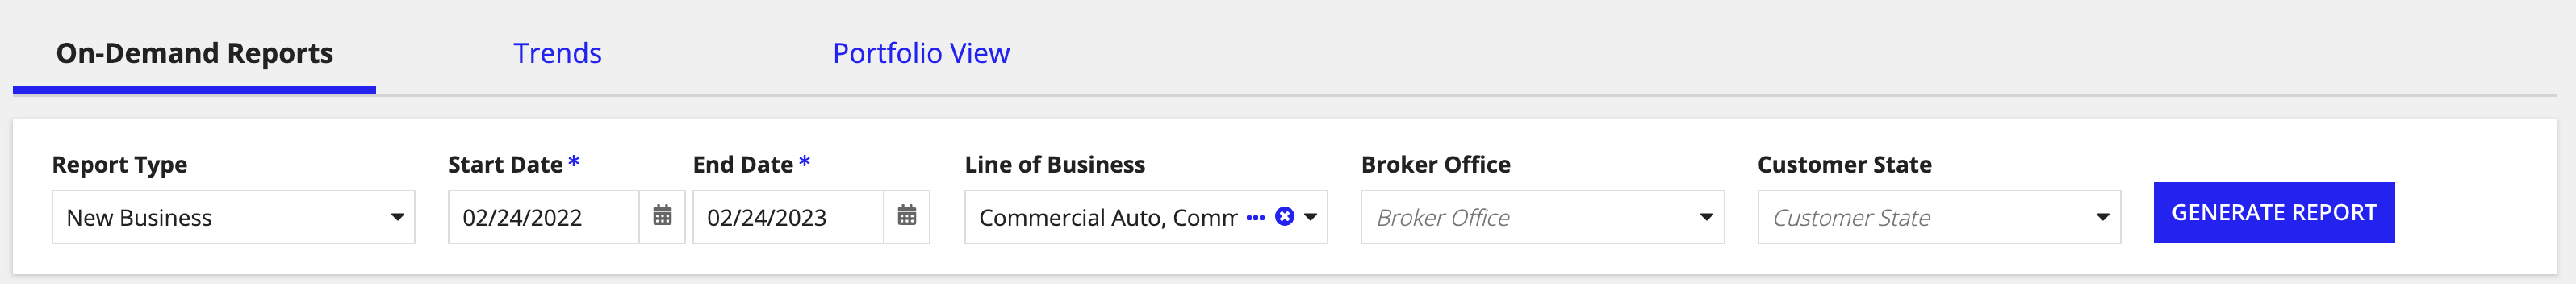
To generate a new on-demand report that matches specific criteria, apply one or more filters and click GENERATE REPORT. The resulting report displays key metrics and data for the submission data you want to see.
Available filters include:
After generating an on-demand submission report, you can see key metrics that summarize the submissions that match your filter criteria, including the total number of new submissions that account for new business, new business accepted, new business declined, and the average time it takes to reach a submission decision.
Note: Note that the Avg. Time to Decision metric is calculated from the average time between the submission creation date and the submission decision date for the start and end dates you define when generating the report.
In addition, you can view a list of all the submissions in the report grid. To get detailed data about a particular submission, locate the submission record in the report grid and click the associated link to drill down into the submission record.
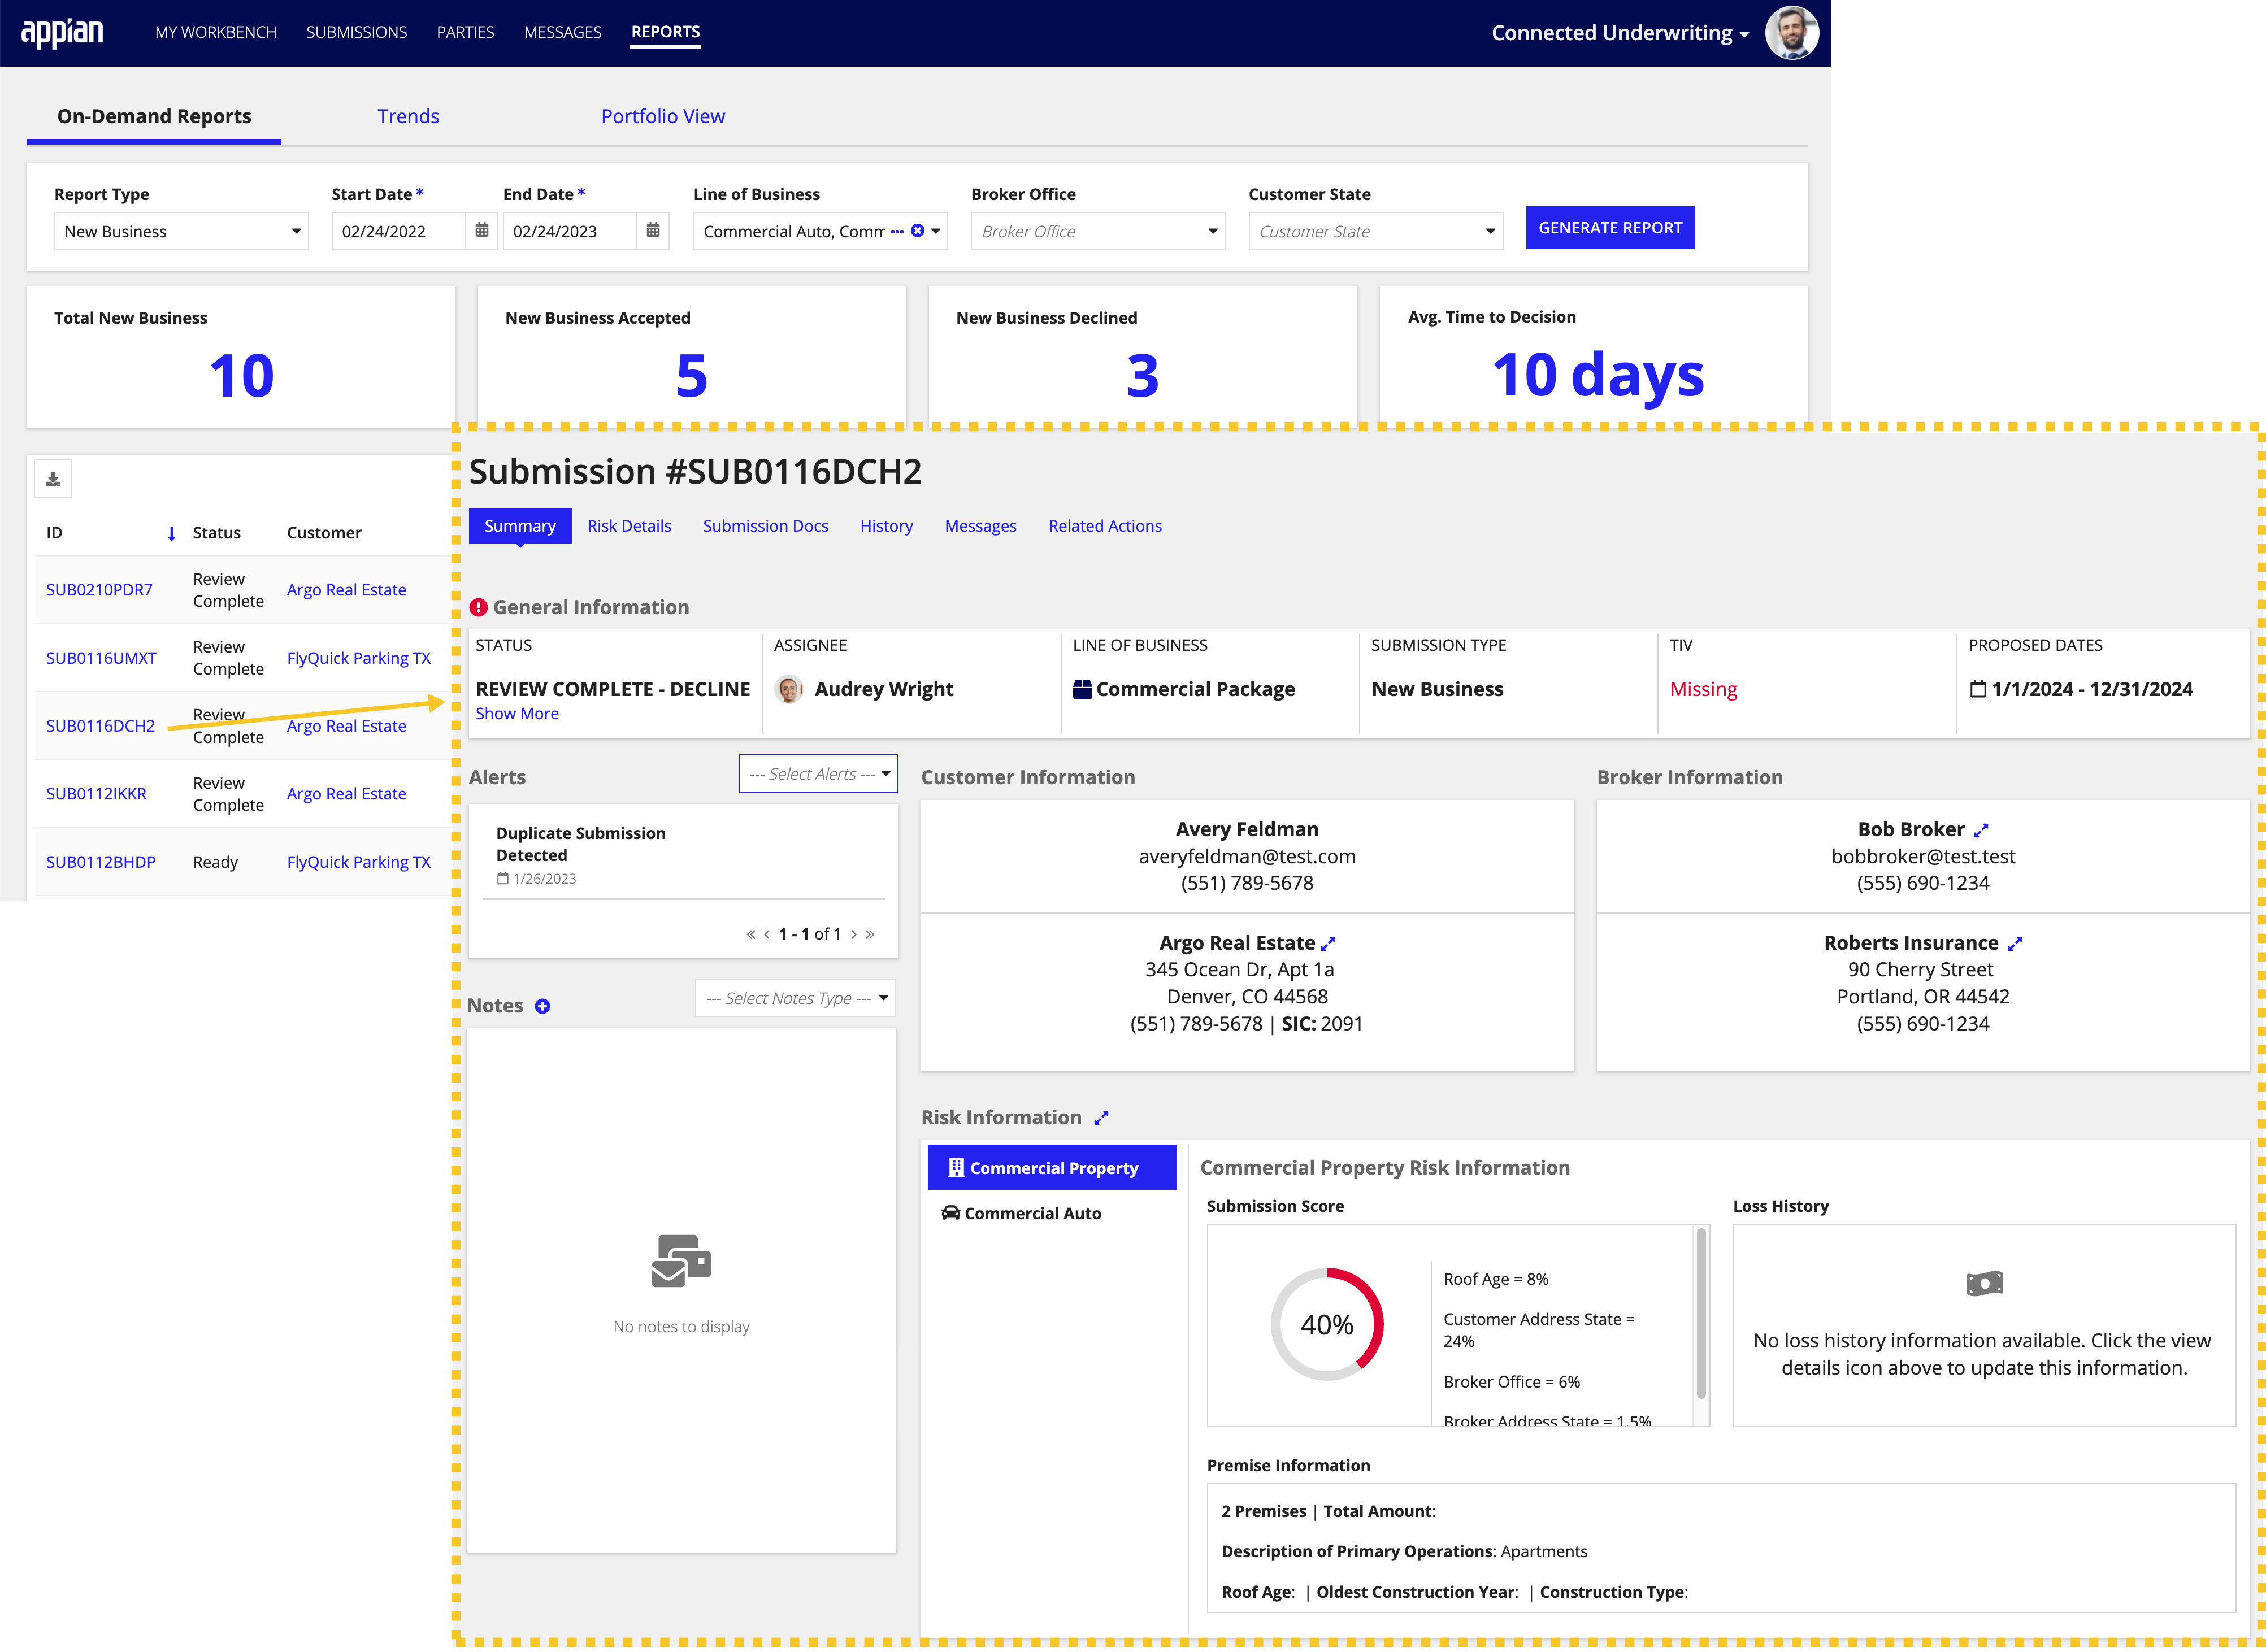
Do you need to view or reference an on-demand report outside the solution? Whether you need to share submission data with other teams for collaboration or compliance or make the data more accessible by making it available in a different format, Connected Underwriting makes it easy for you to export an on-demand report to Excel by clicking the download icon.

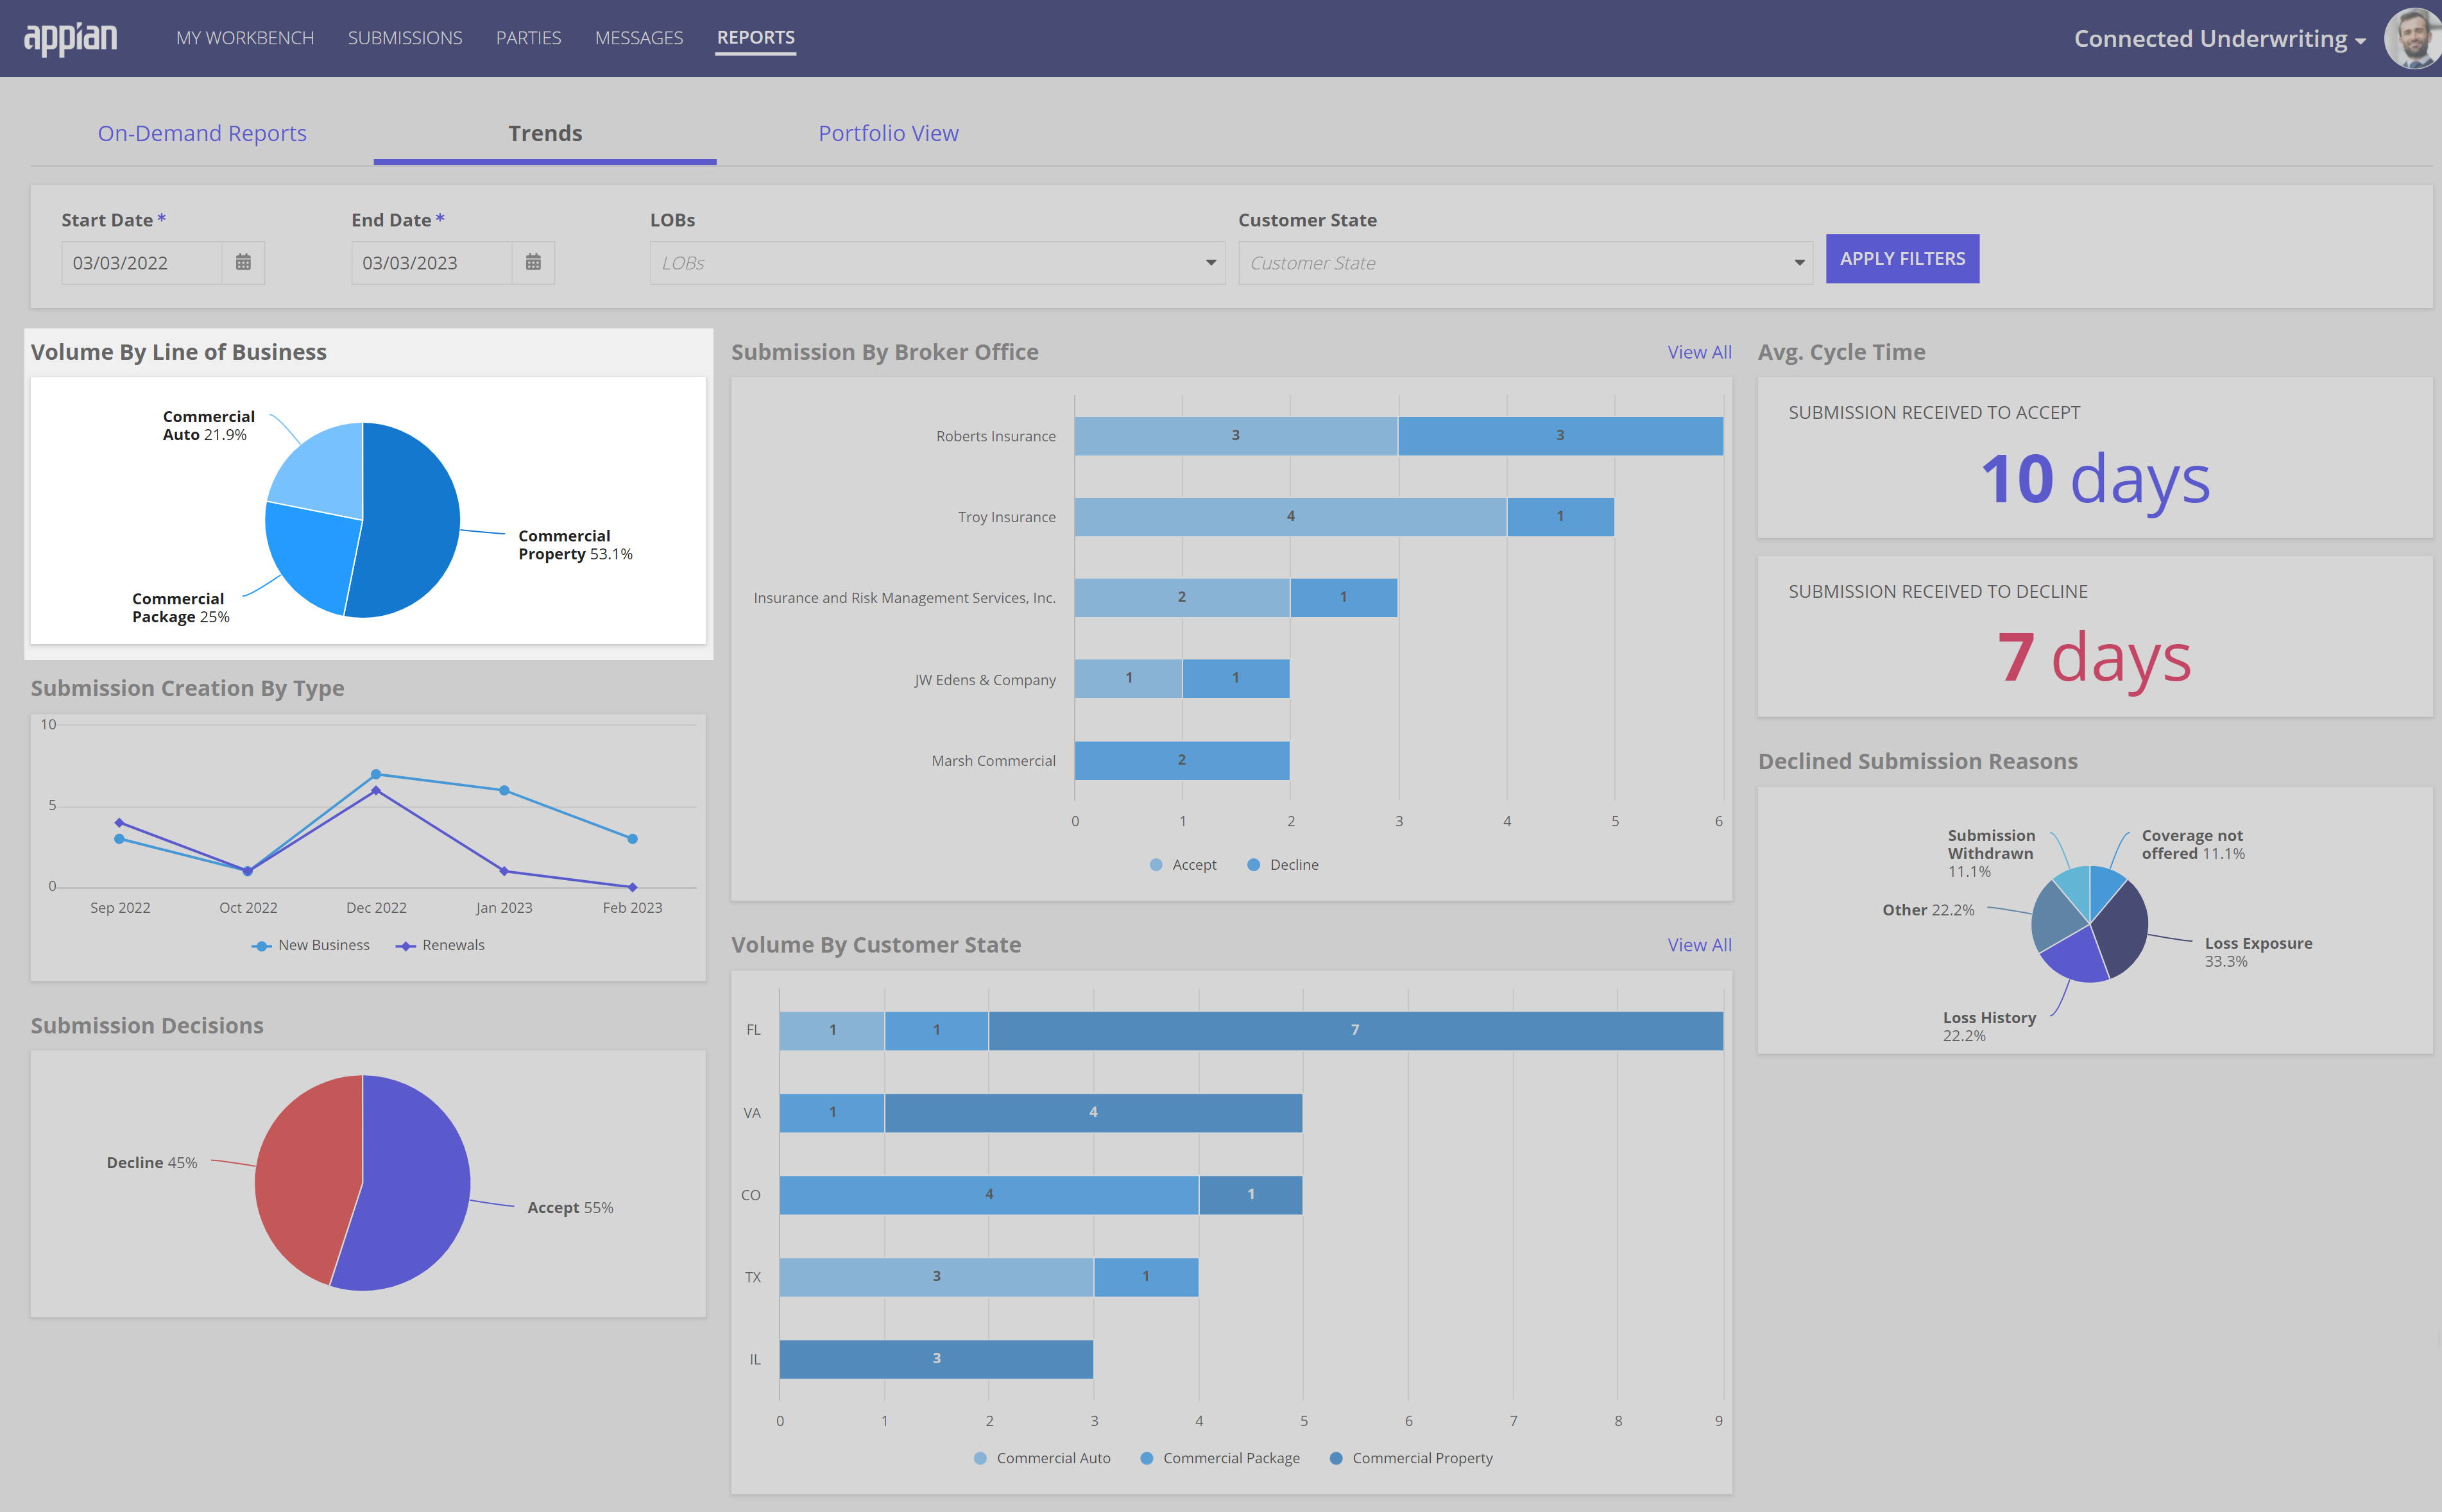
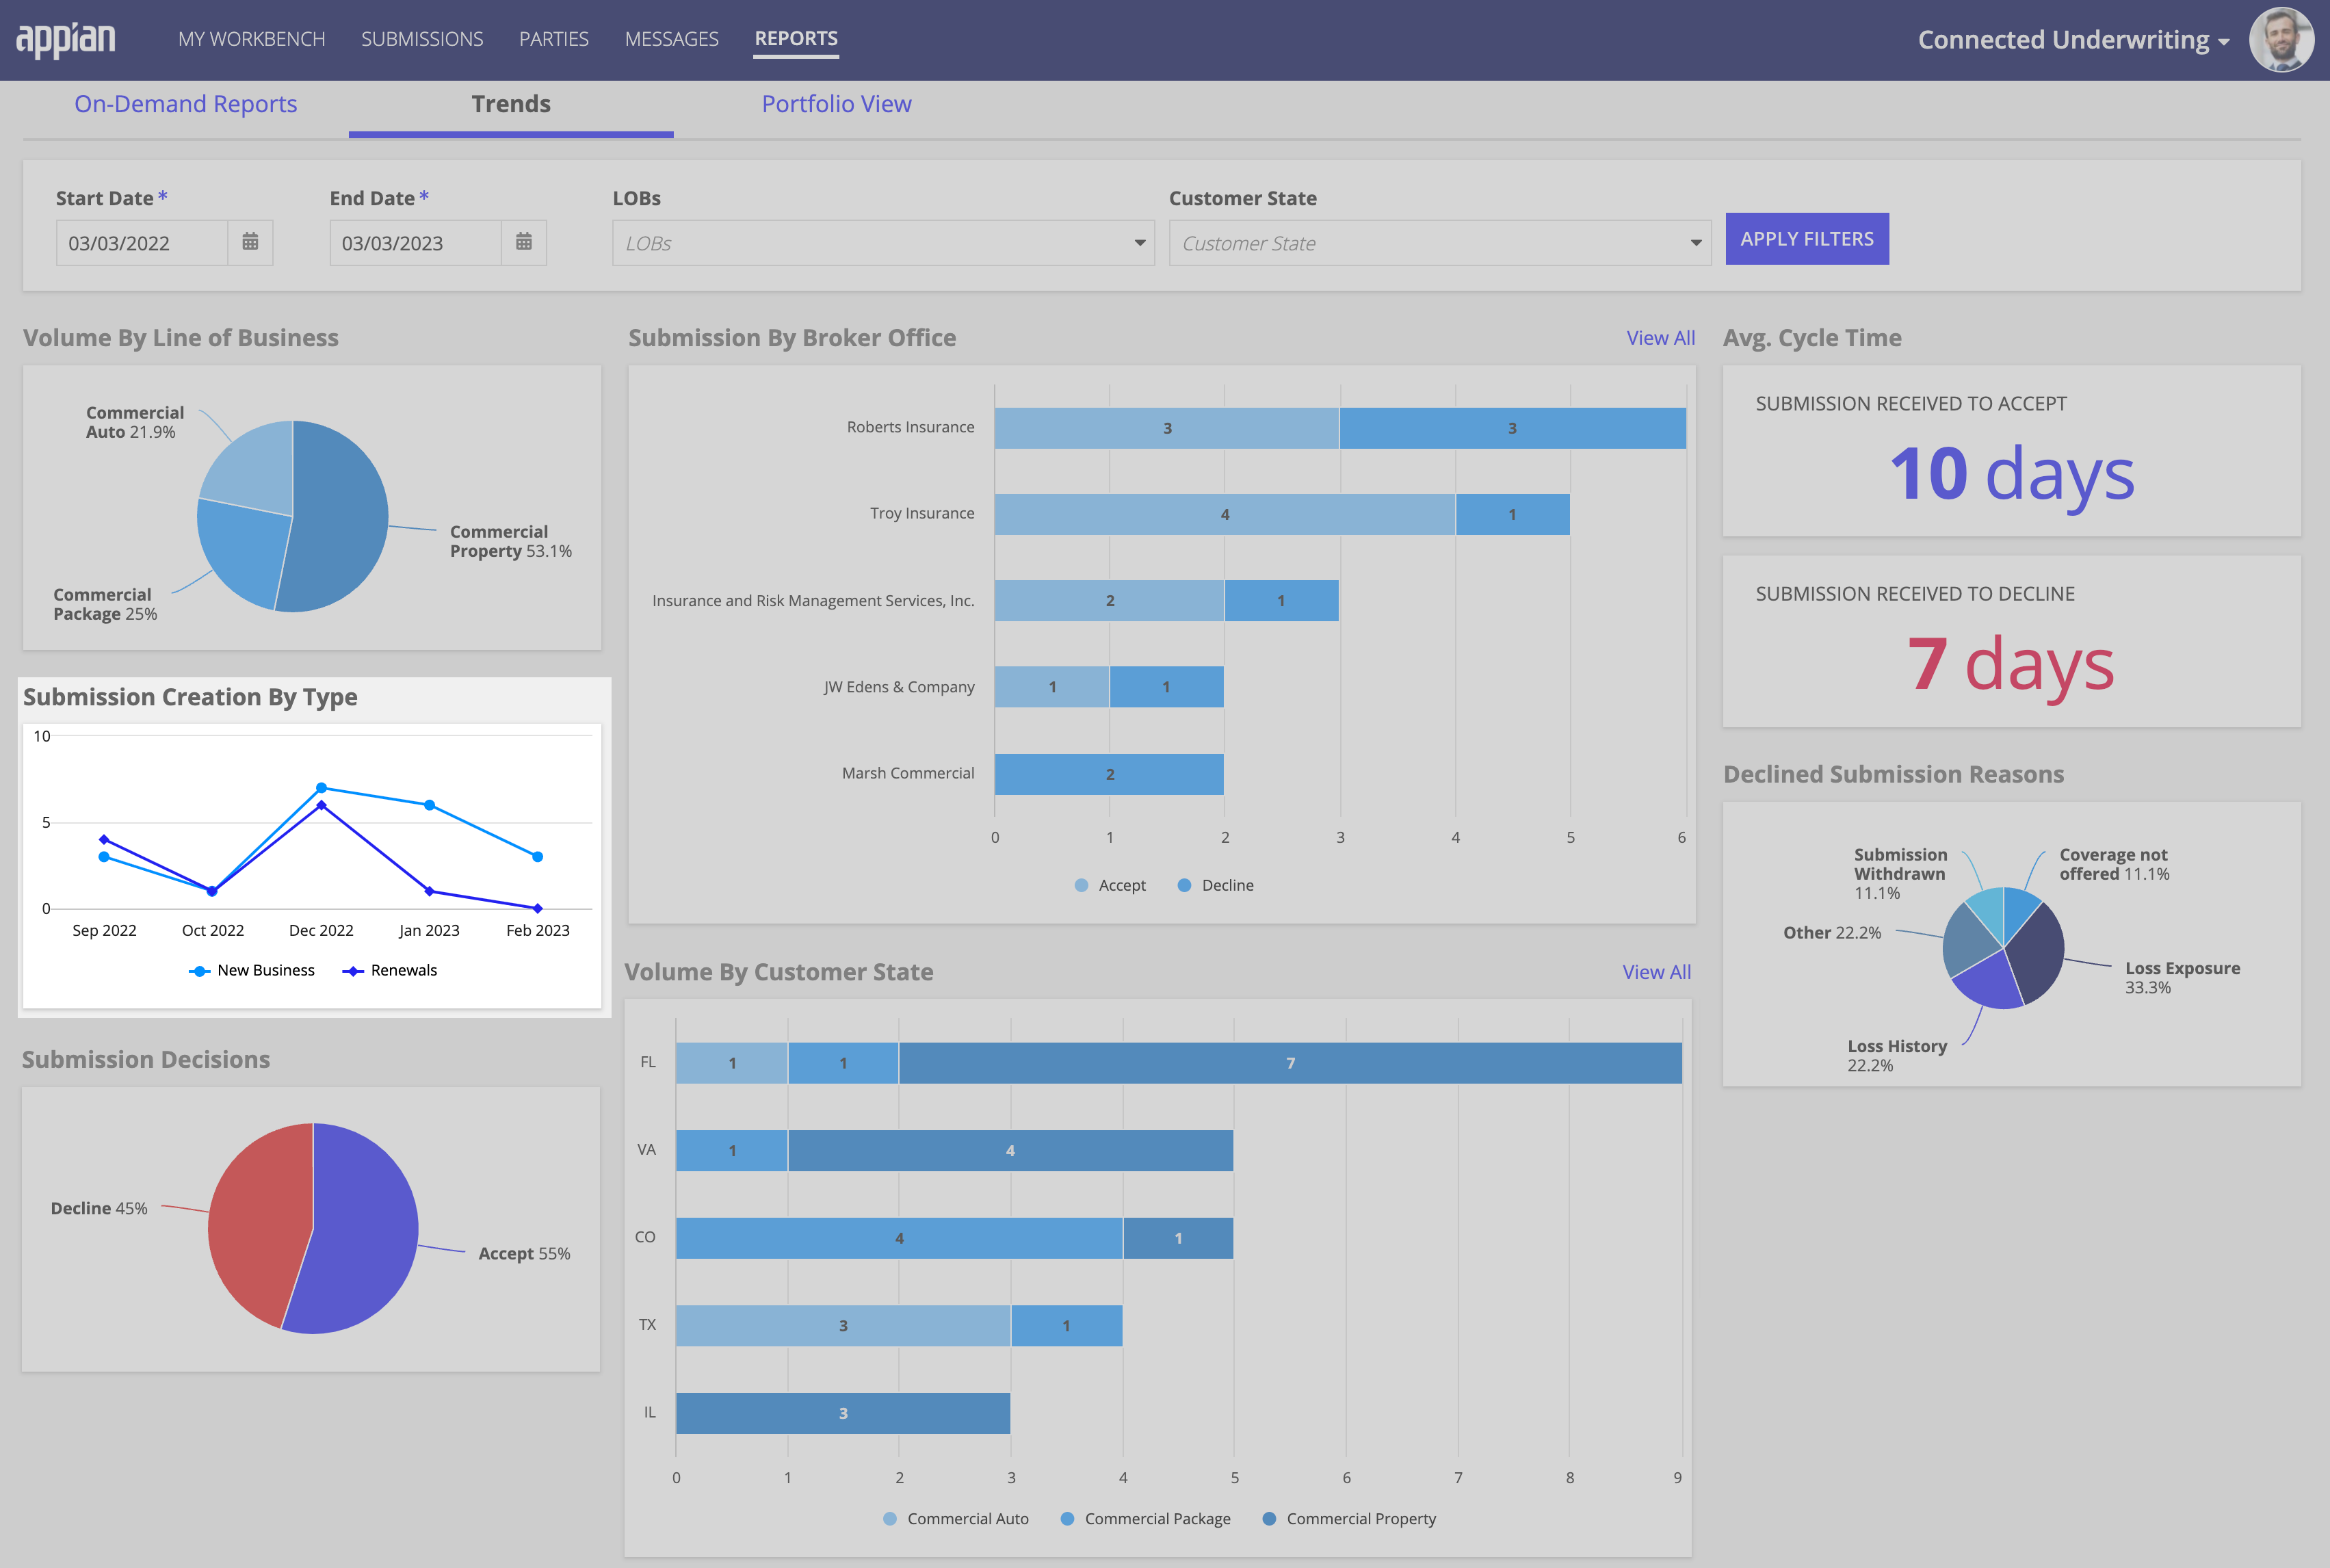
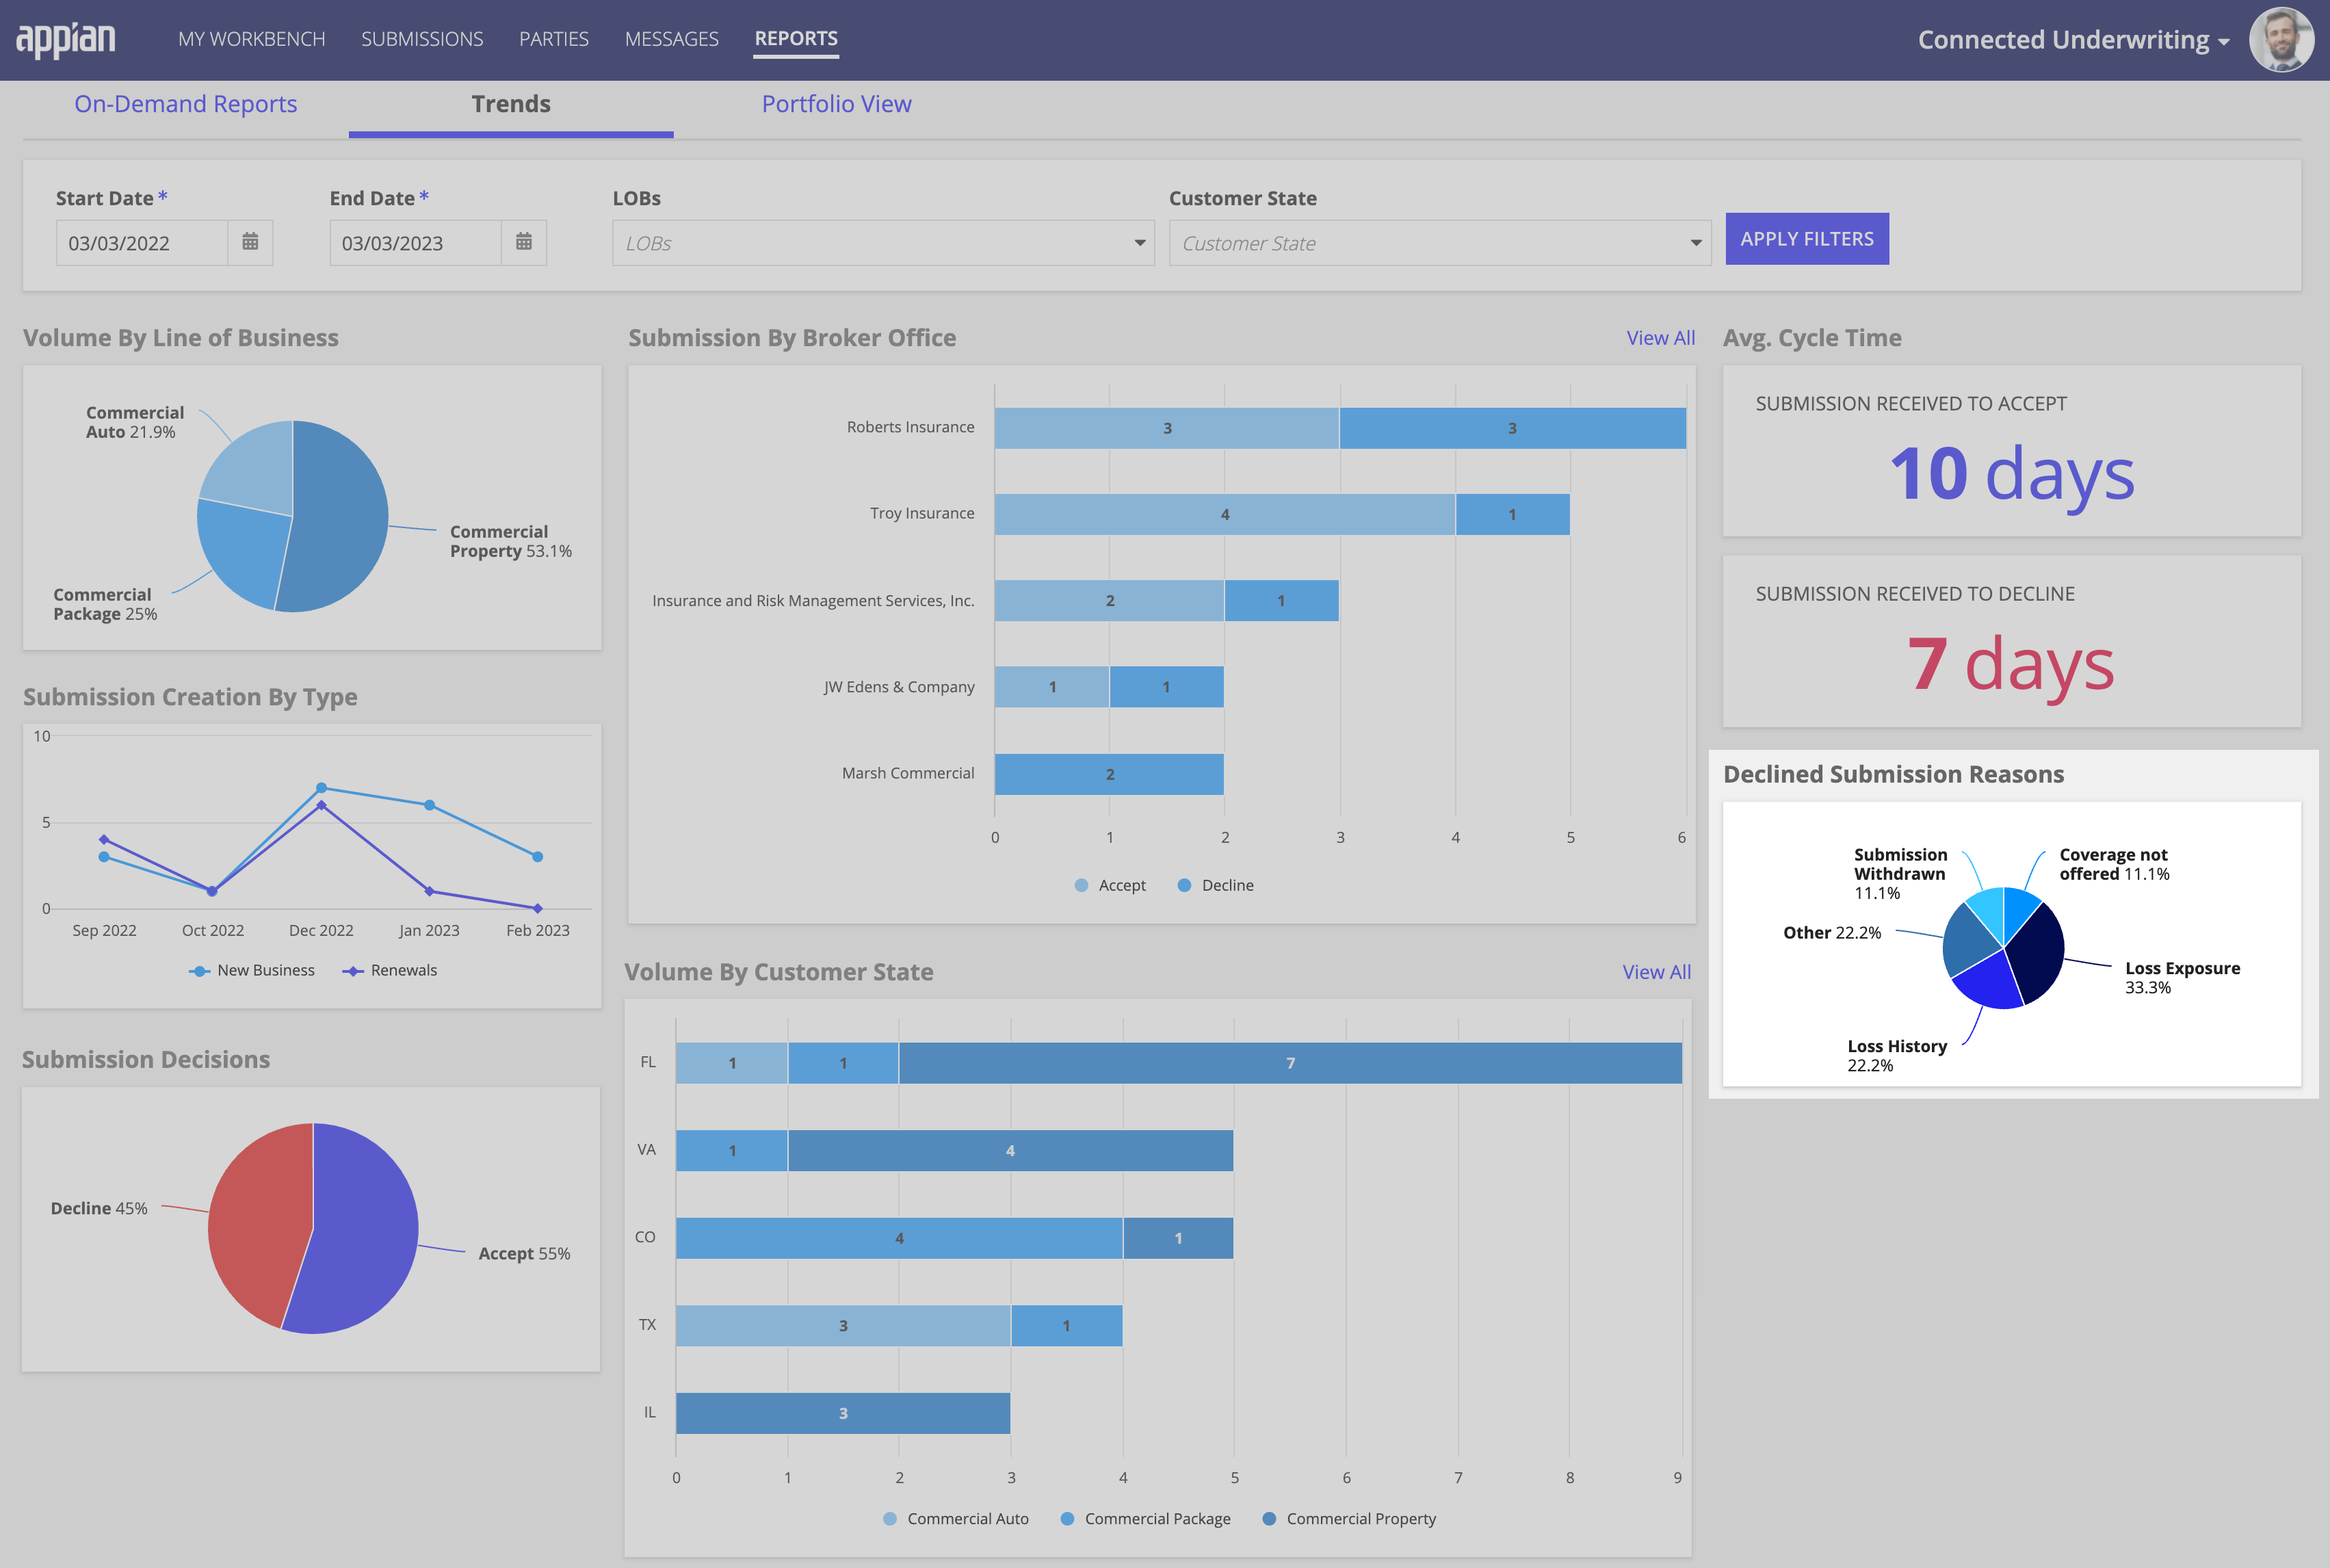
The Trends tab gives underwriting and managers insights into how their teams perform by allowing them to view productivity metrics and determine where submissions are in the underwriting process. This data can help them quickly identify their teams' caseload and throughput, any bottlenecks in the process, and any reoccurring positive or negative patterns by team, line of business, state, and more.
The Trends tab includes the following reports:
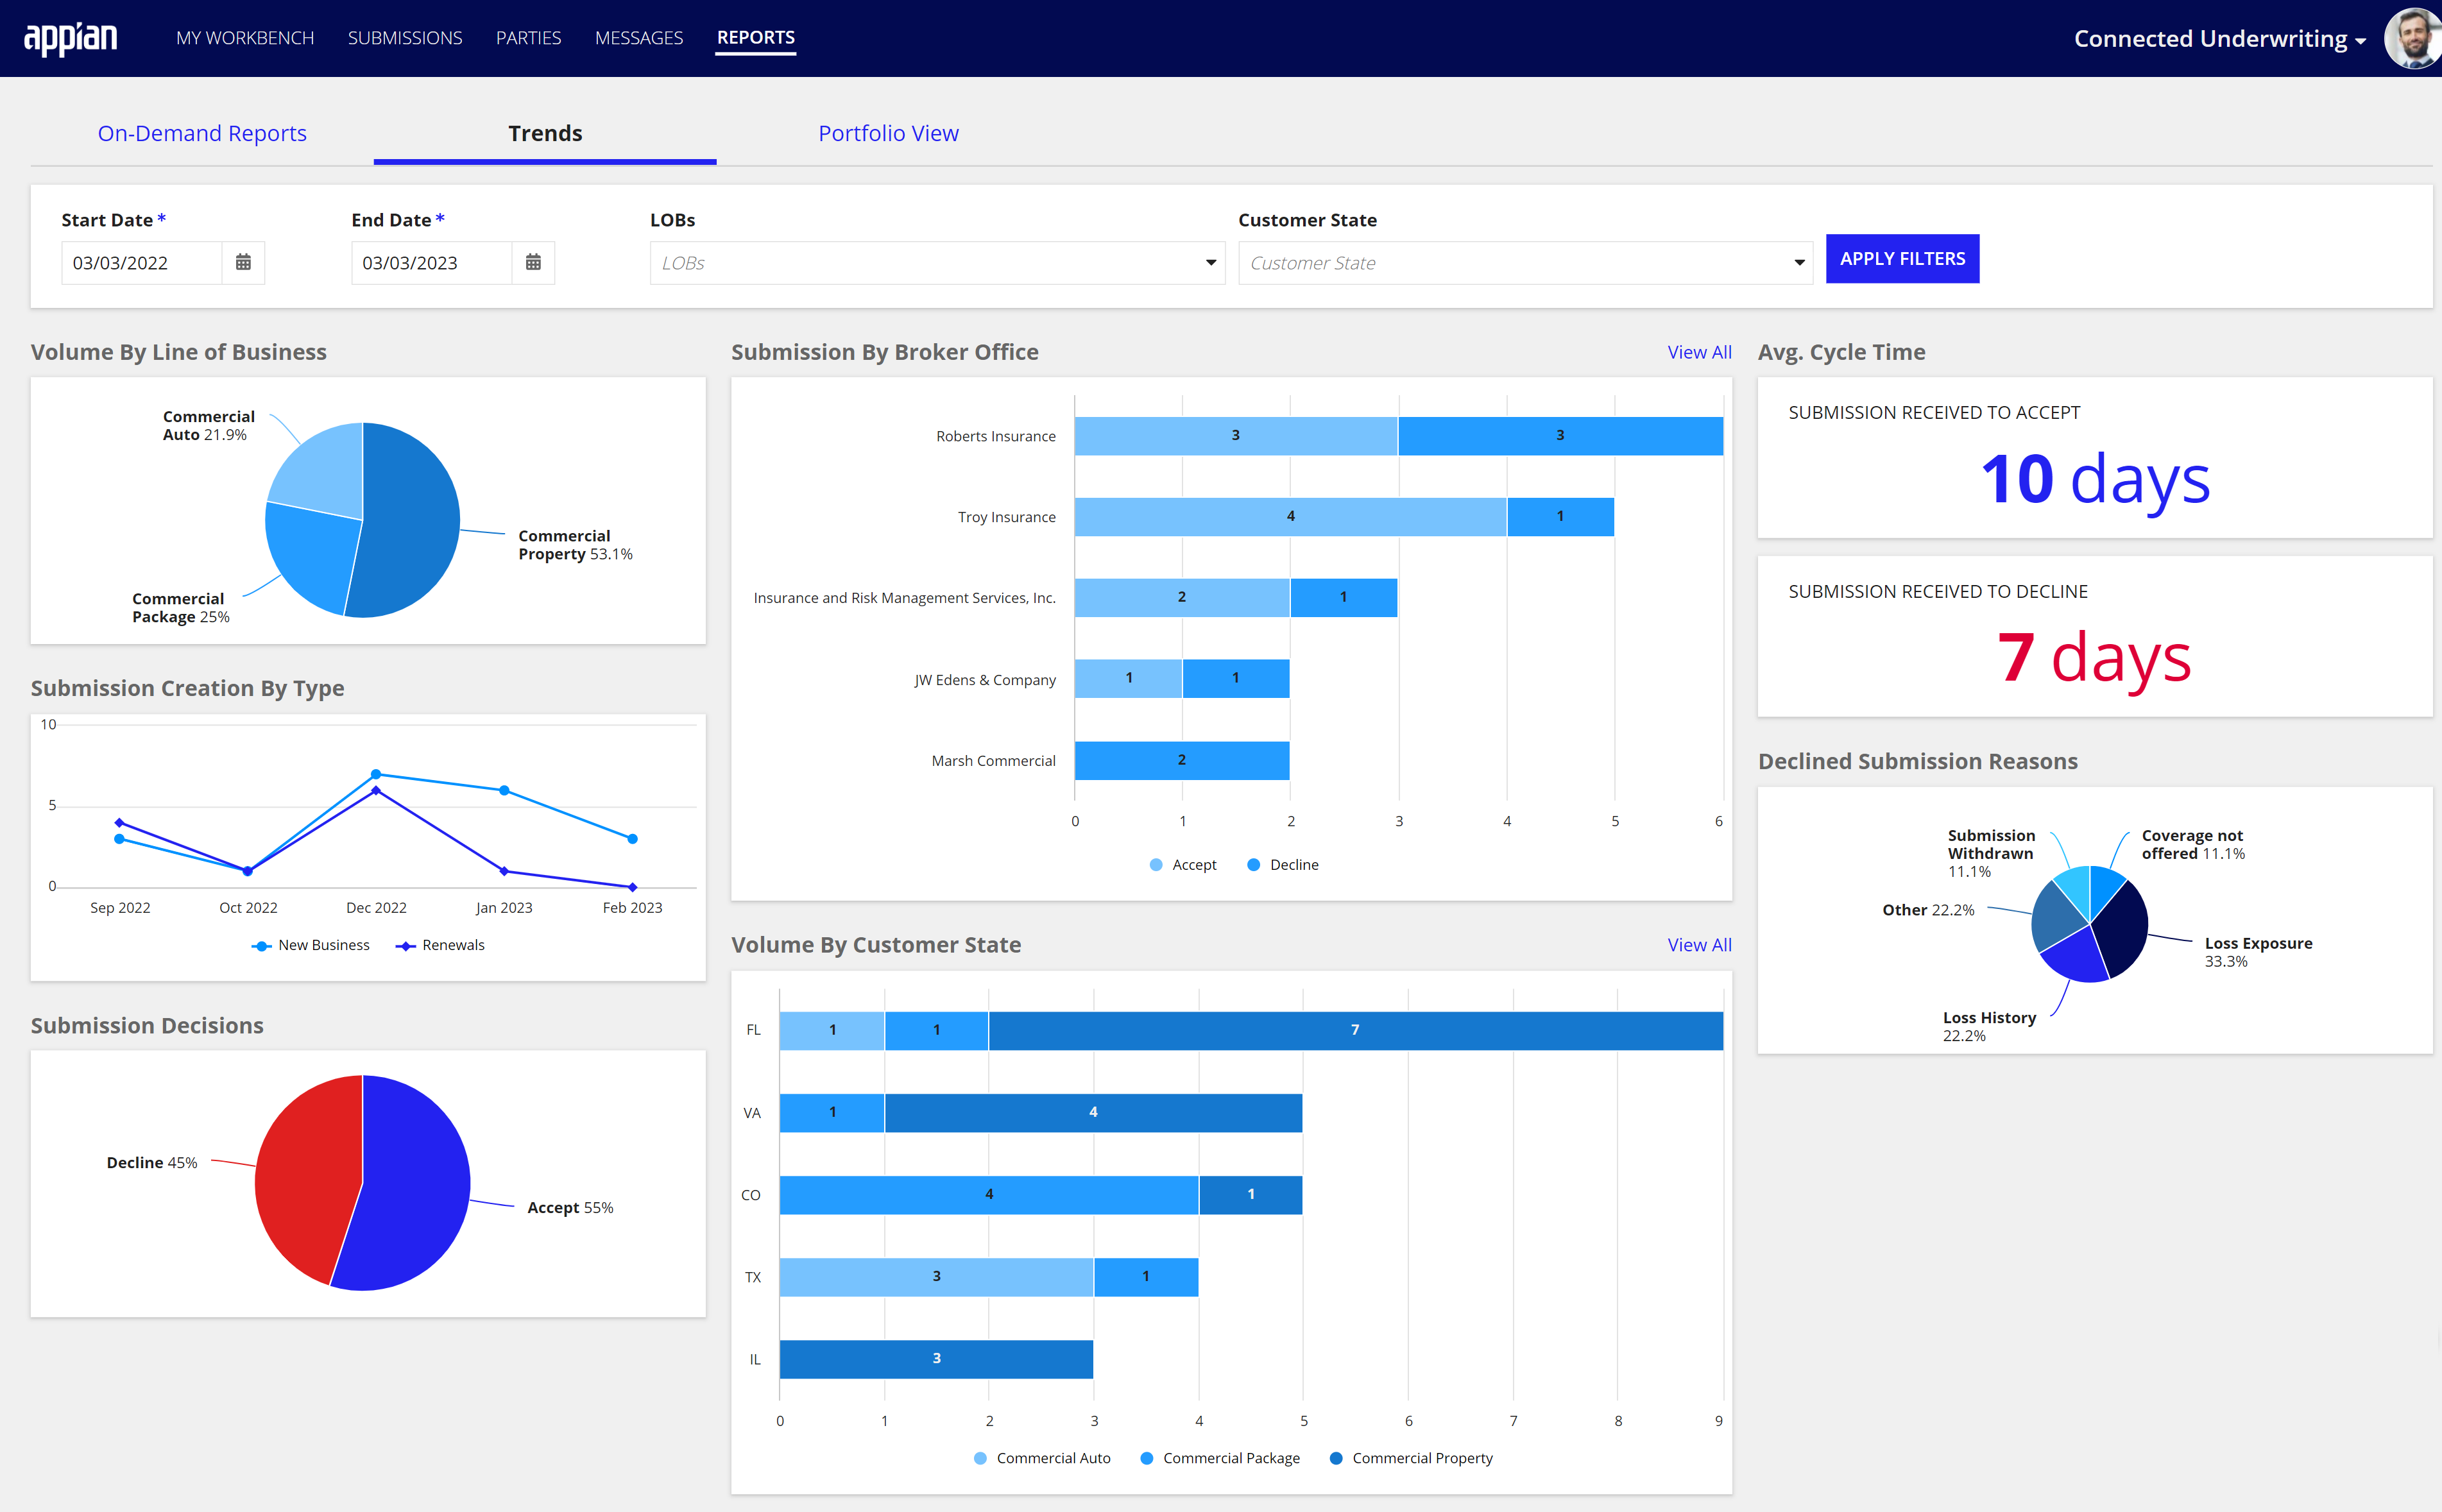
Need to see your team's productivity during a specific date range or determine the number of submissions created for a specific line of business? The Trends page allows you to apply one or more filters to adjust the data shown in all the reports to display only the data that match your filter criteria. For example, select a start and end date filter to display the data for a specific date range or select one or more LOBs to display the data for specific lines of business for a given date range.
A start and end date are required for the Trends reports. By default, the display data for all lines of business and all customer states for the current date.
The Volume By Line of Business pie chart displays the volume of submissions by percentage for each line of business.
As an underwriting manager or admin, you can use this chart to answer the following questions:
You can also apply one or more filters to the Trends tab to narrow the data displayed in this chart to return only the submissions that match specific criteria.
The Submission By Broker Office stacked bar chart displays the count of the top five submissions with an accept or decline decision by the broker office. To view a list of all submissions across your broker offices, click the View All link associated with this chart.
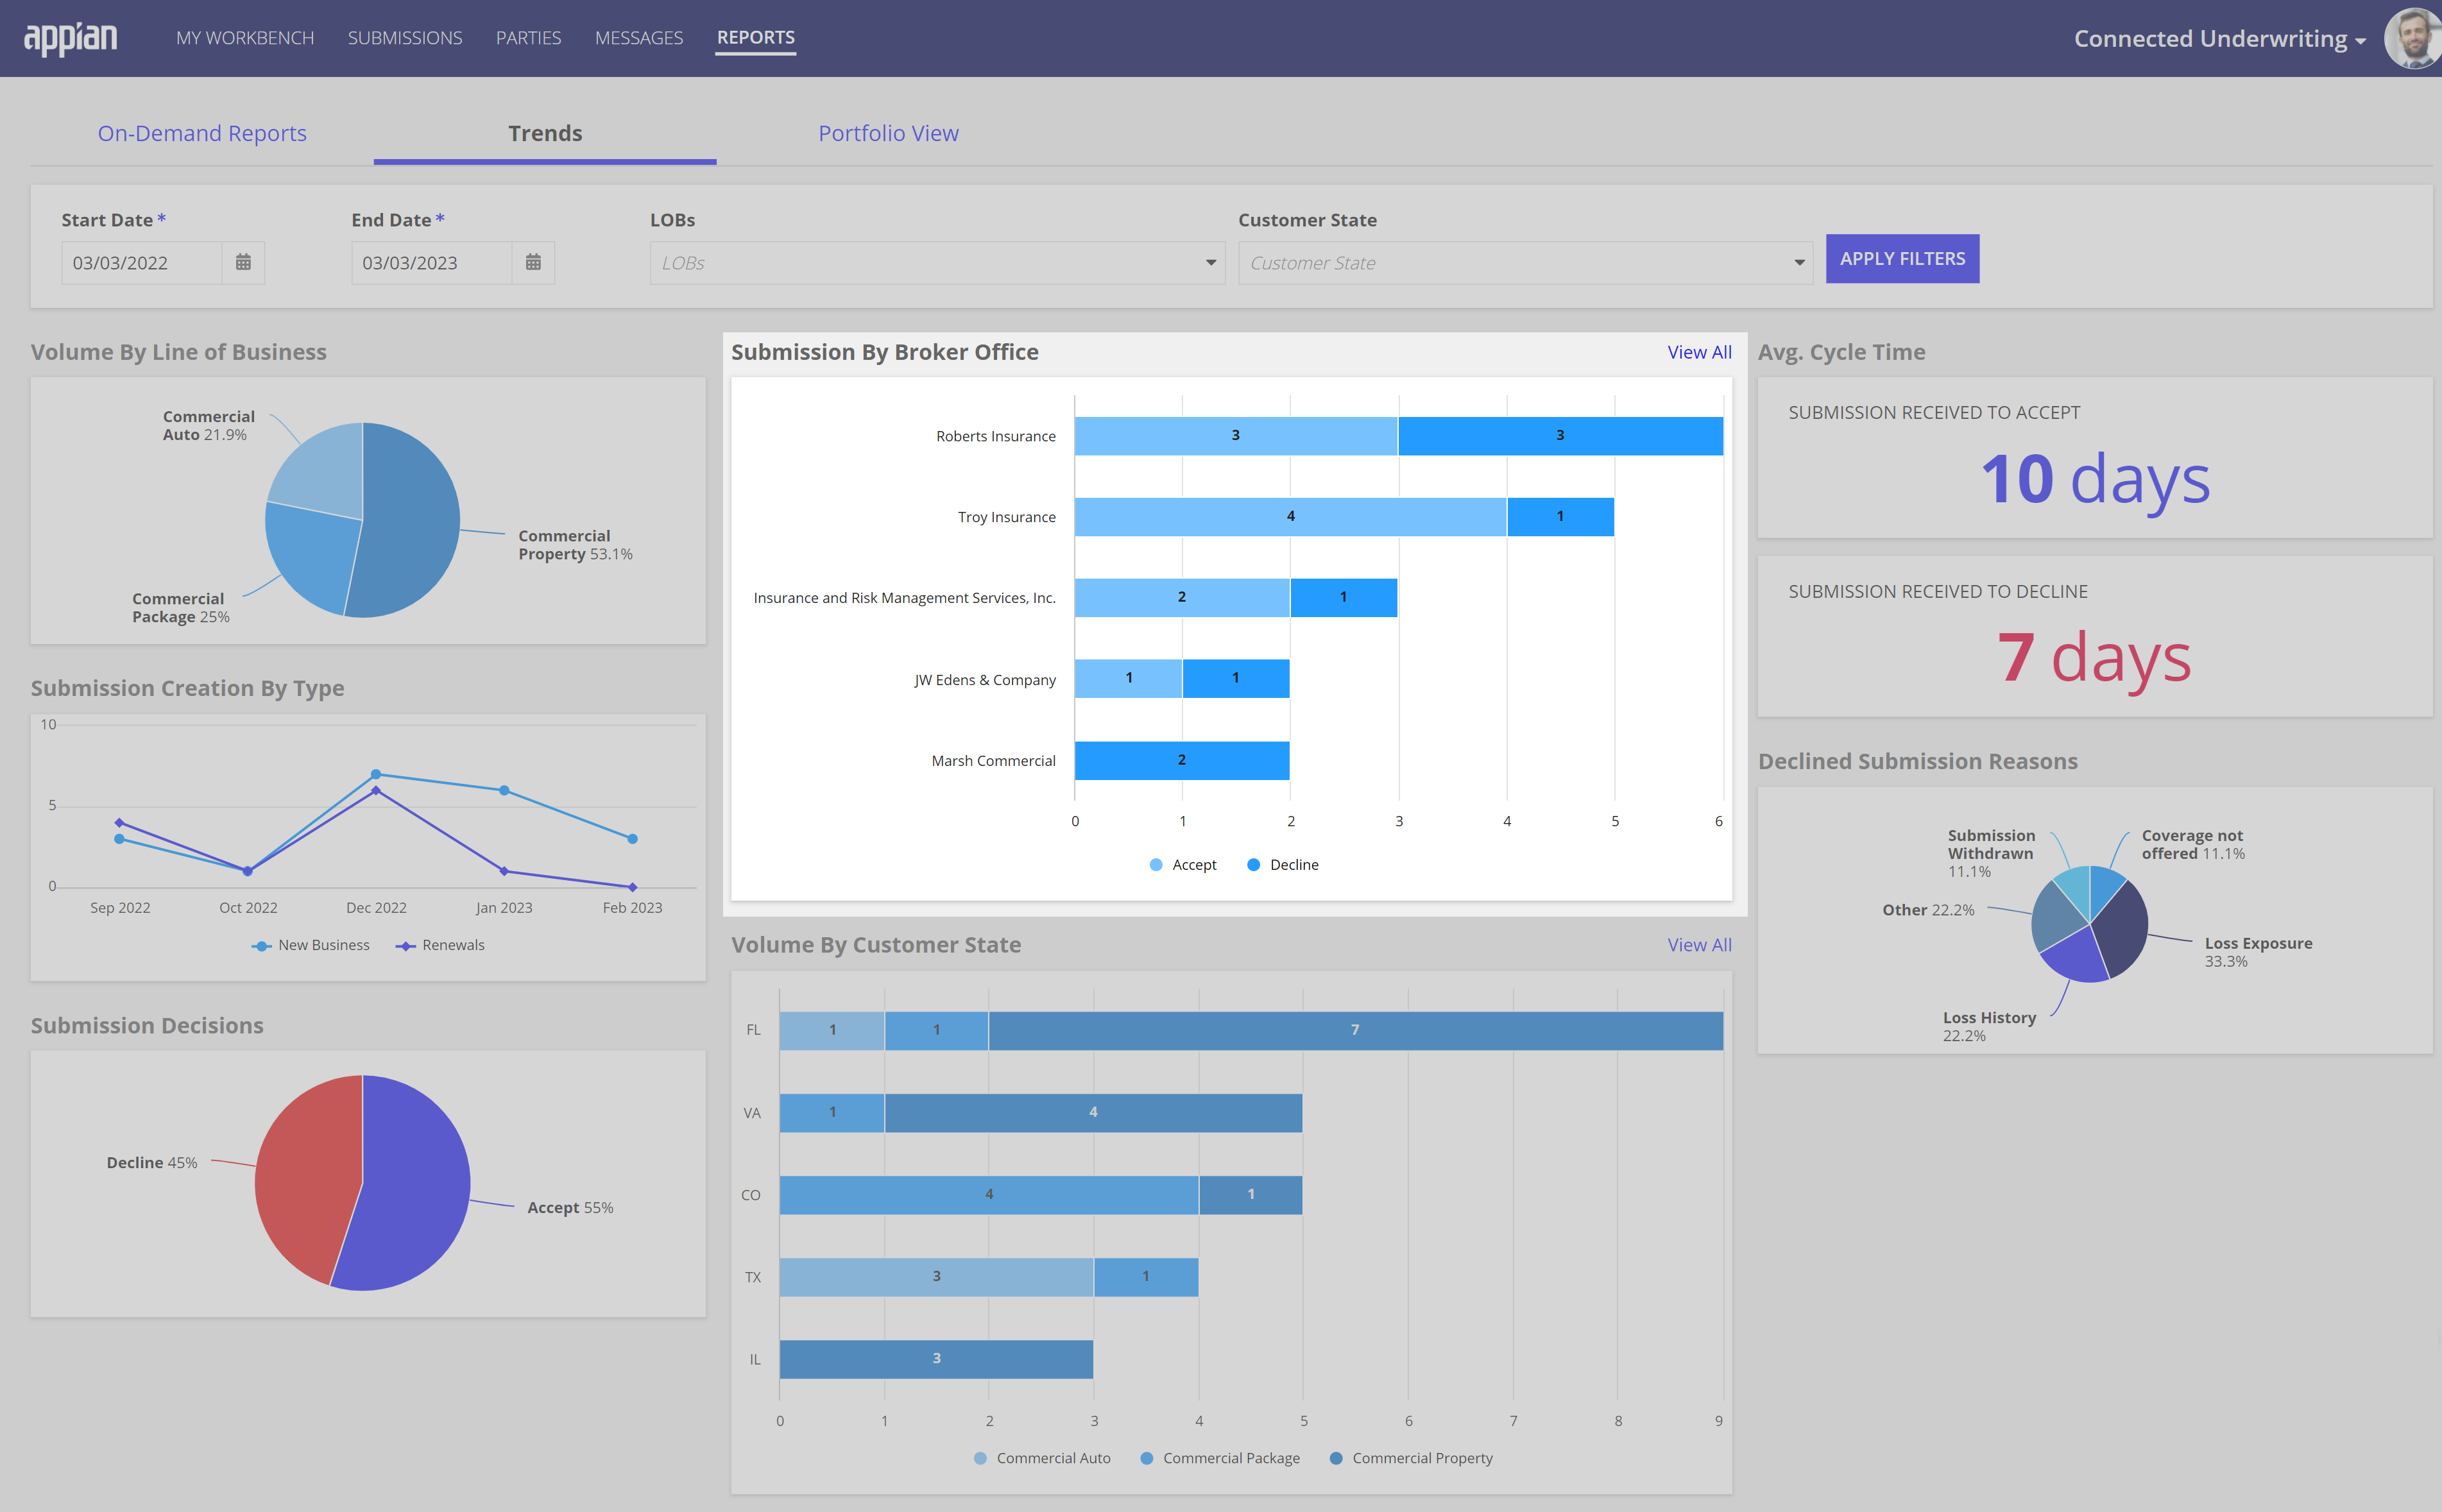
Want more detailed information about the submissions for a specific broker office? Hover over a specific bar in the chart to see the number of accepted vs. declined submissions for that broker office.
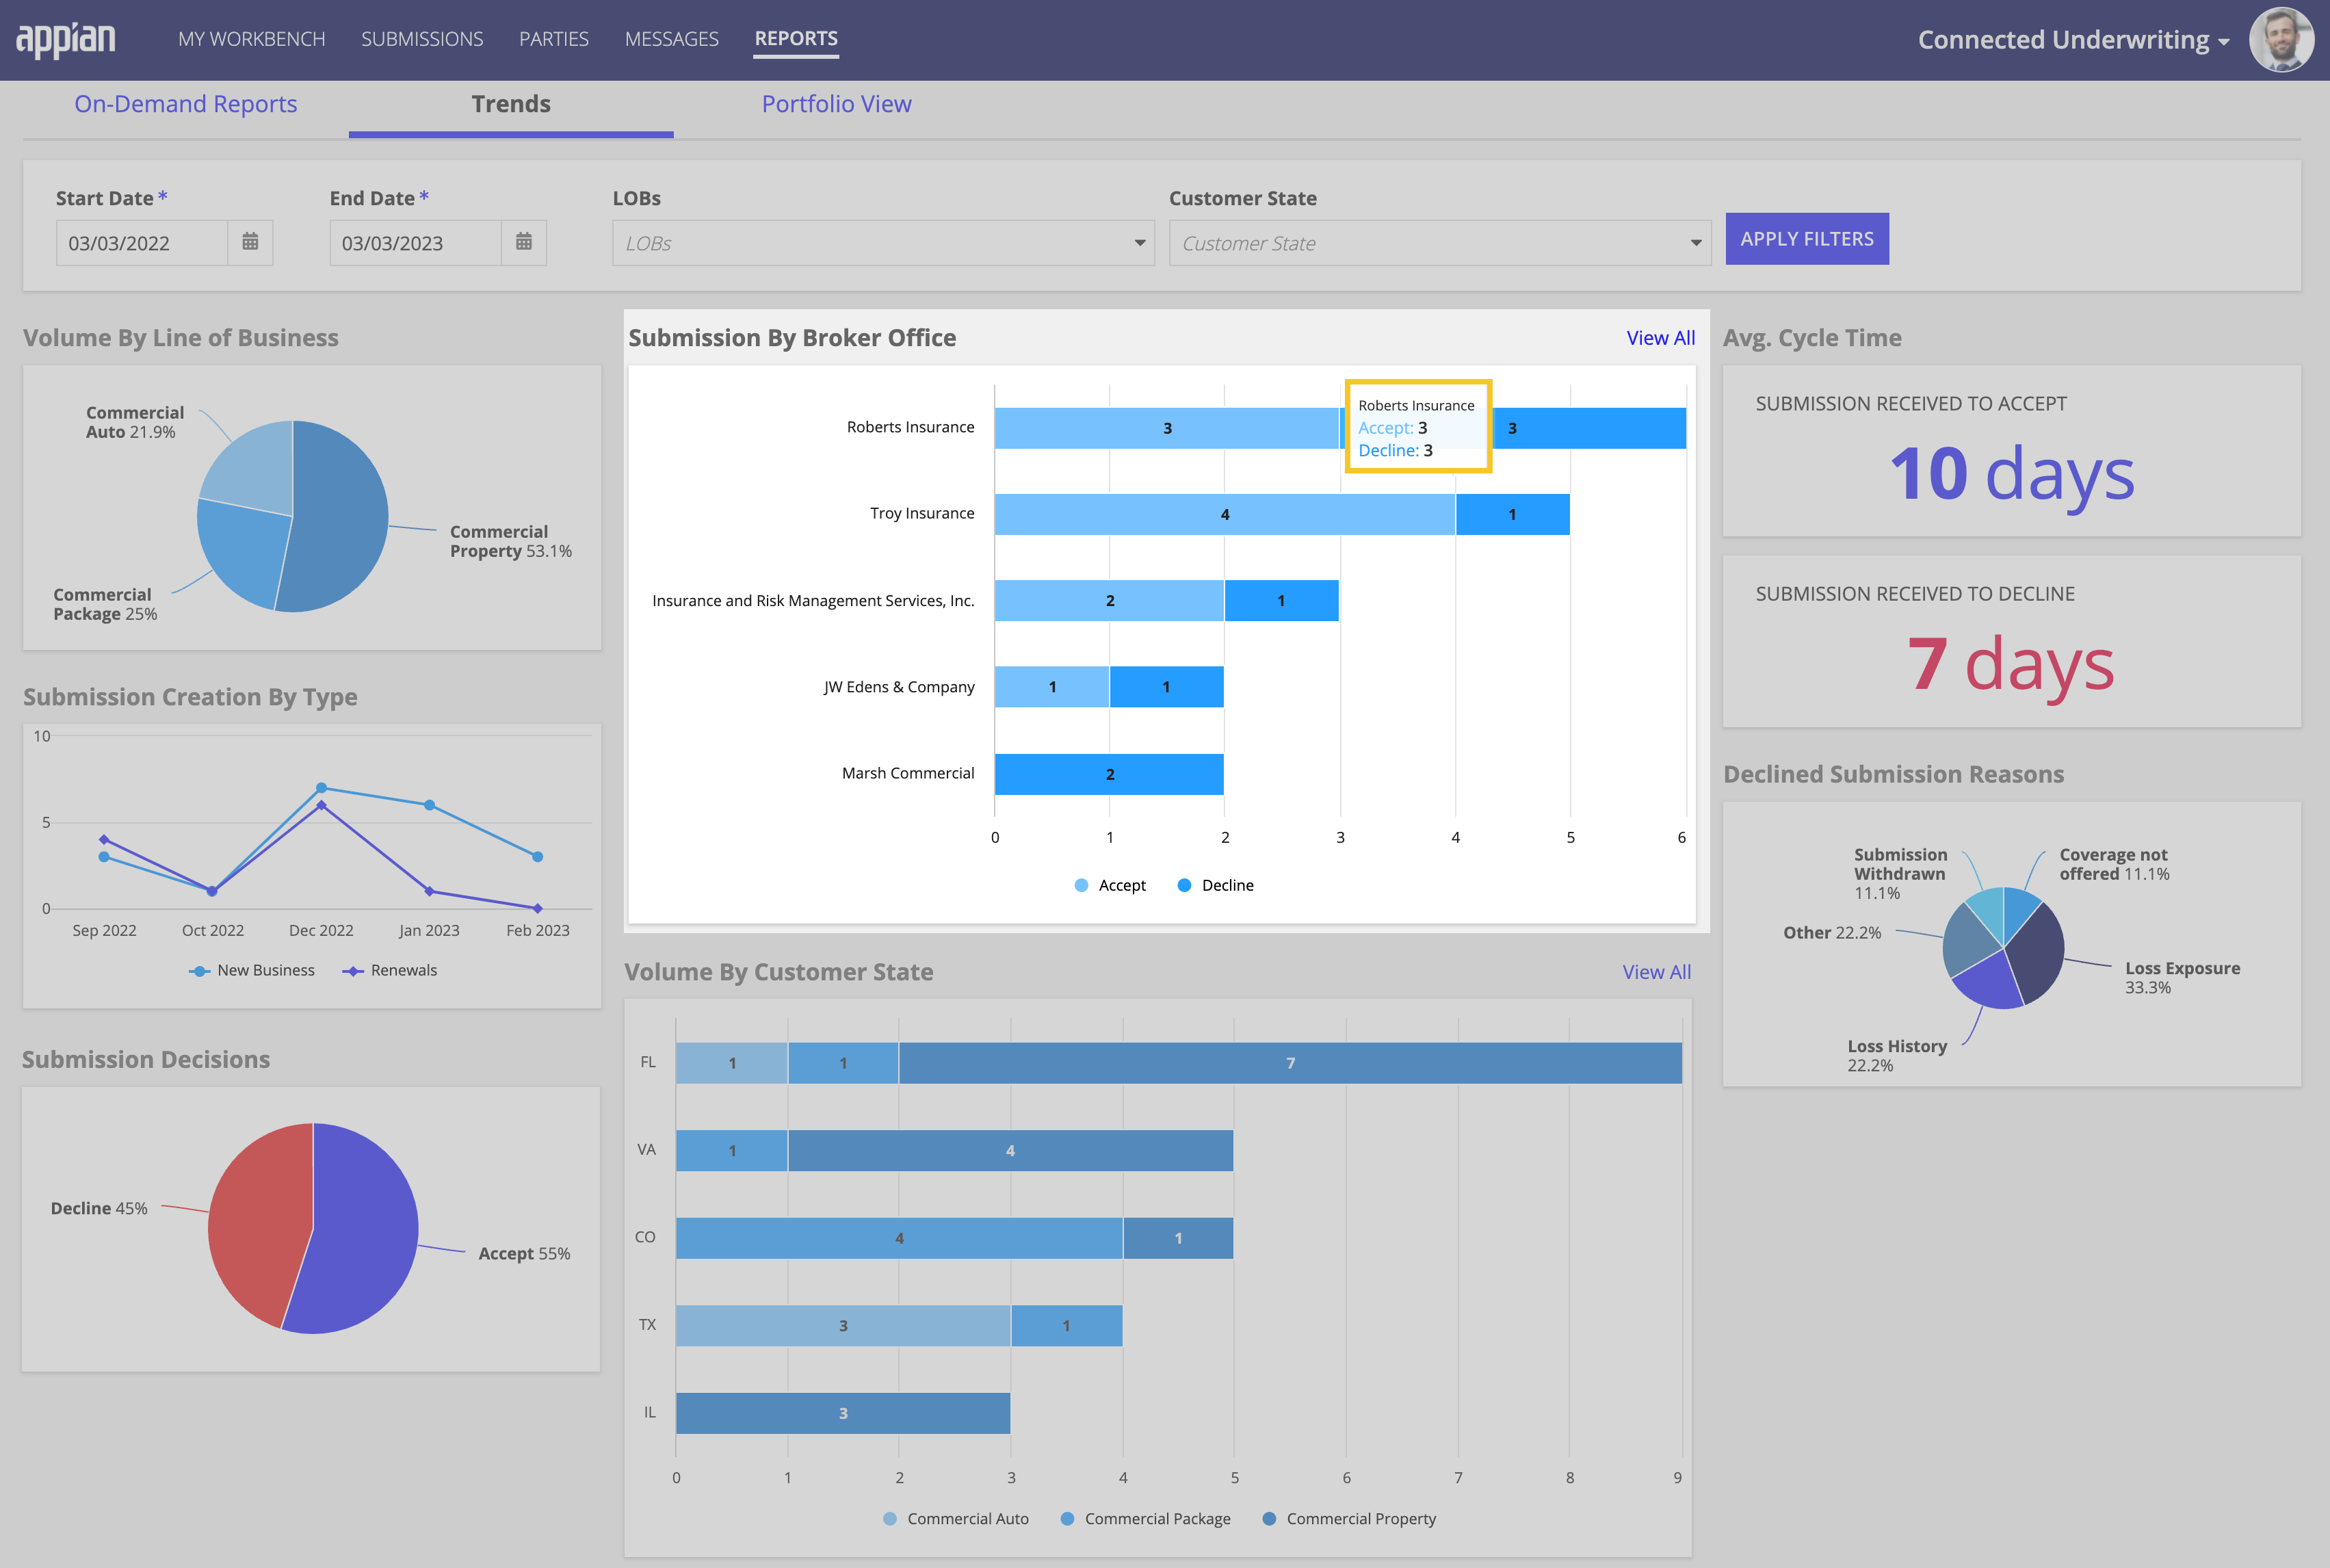
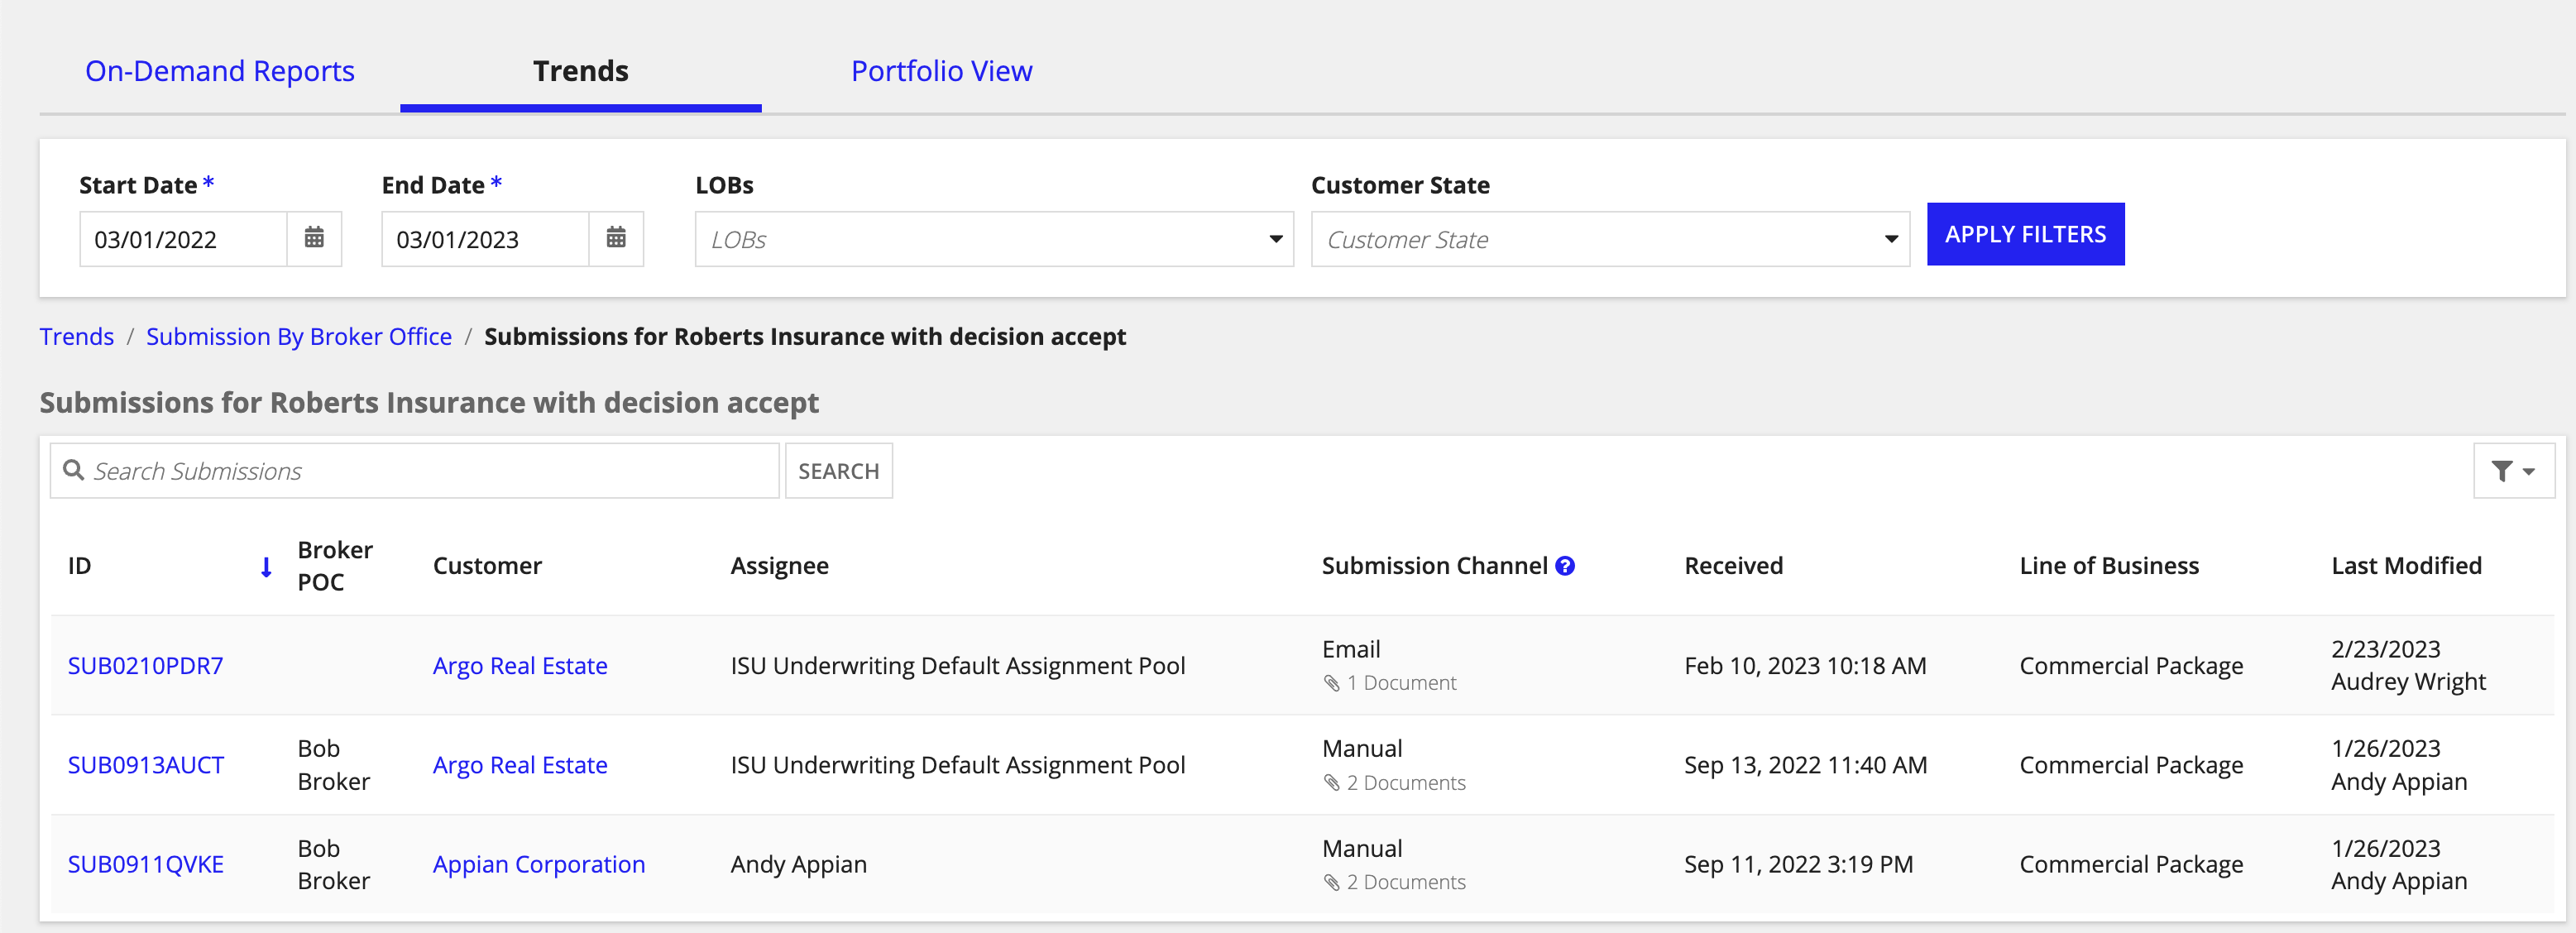
Additionally, when you hover over a specific bar, you can click the Accept link or Decline link to see a list view of all the submissions with an accept or decline decision for that particular broker.
As an underwriting manager or admin, you can use this chart to answer the following questions:
You can also apply one or more filters to the Trends tab to narrow the data displayed in this chart to return only the submission data that match specific criteria.
The Average Cycle Time section displays two data points: the average number of days it takes for your organization to make a submission acceptance decision and the average number of days it takes to decline a submission.

You can also apply one or more filters to the Trends tab to narrow the data displayed in this section to return only the average number of days it takes your organization to accept or decline a submission for:
The Submission Creation by Type line graph compares the number of submissions that resulted in new business vs. renewals that your organization handled during the prior six months.
Additionally, when you hover over a specific point on the line graph, Connected Underwriting shows the exact number of submissions that resulted in new business or renewals.
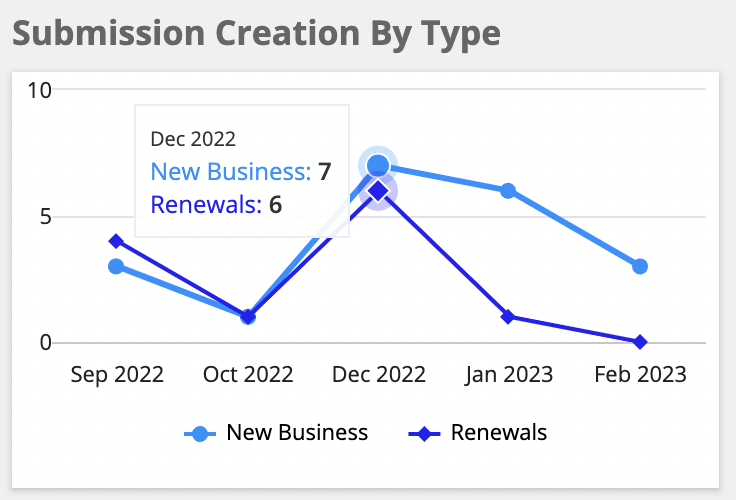
You can also apply one or more filters to the Trends tab to narrow the data this line graph displays to return only the submissions that resulted in new business vs. renewals for:
By default, the results returned map to the submission data for the prior six months.
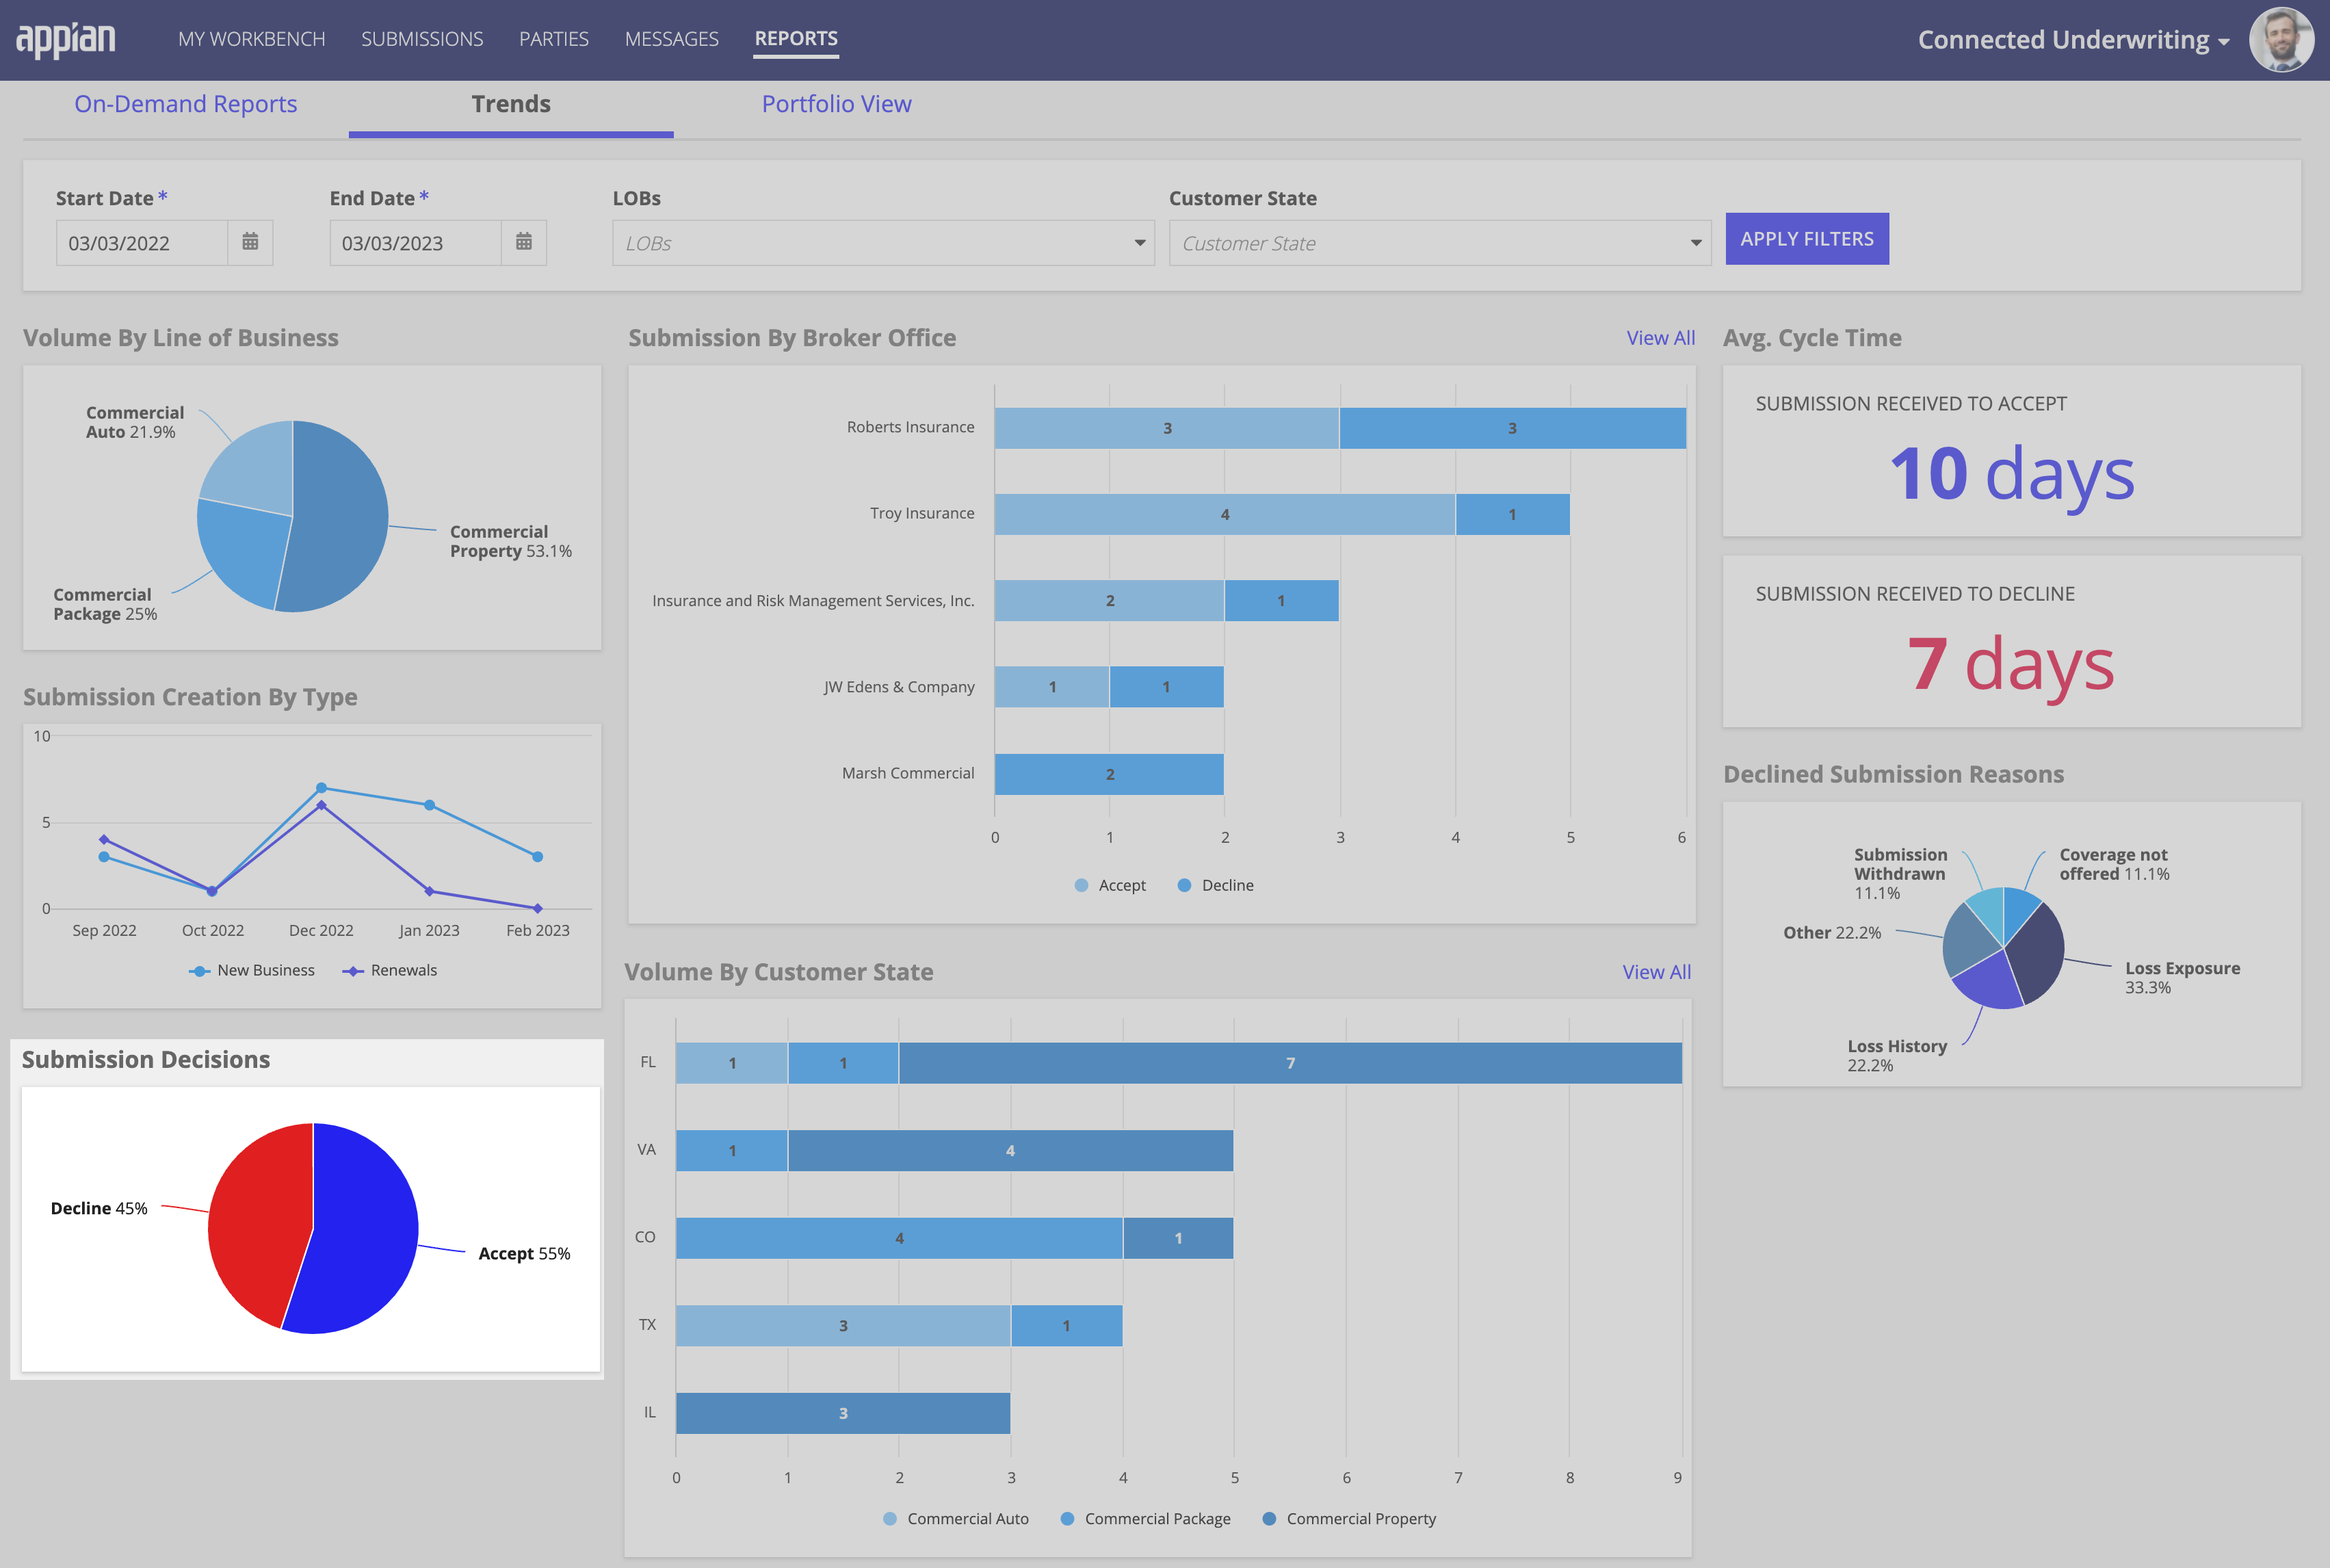
The Submission Decisions pie chart displays the percentage of submissions your organization handled that were accepted vs. declined.
As an underwriting manager or admin, you can apply one or more filters to the Trends tab to narrow the data this pie chart displays to return only the submissions that were accepted or declined for:
The Volume By Customer State stacked bar chart displays the volume of submissions your organization handled for each line of business by customer state. By default, this chart only shows the top 5 submission results.
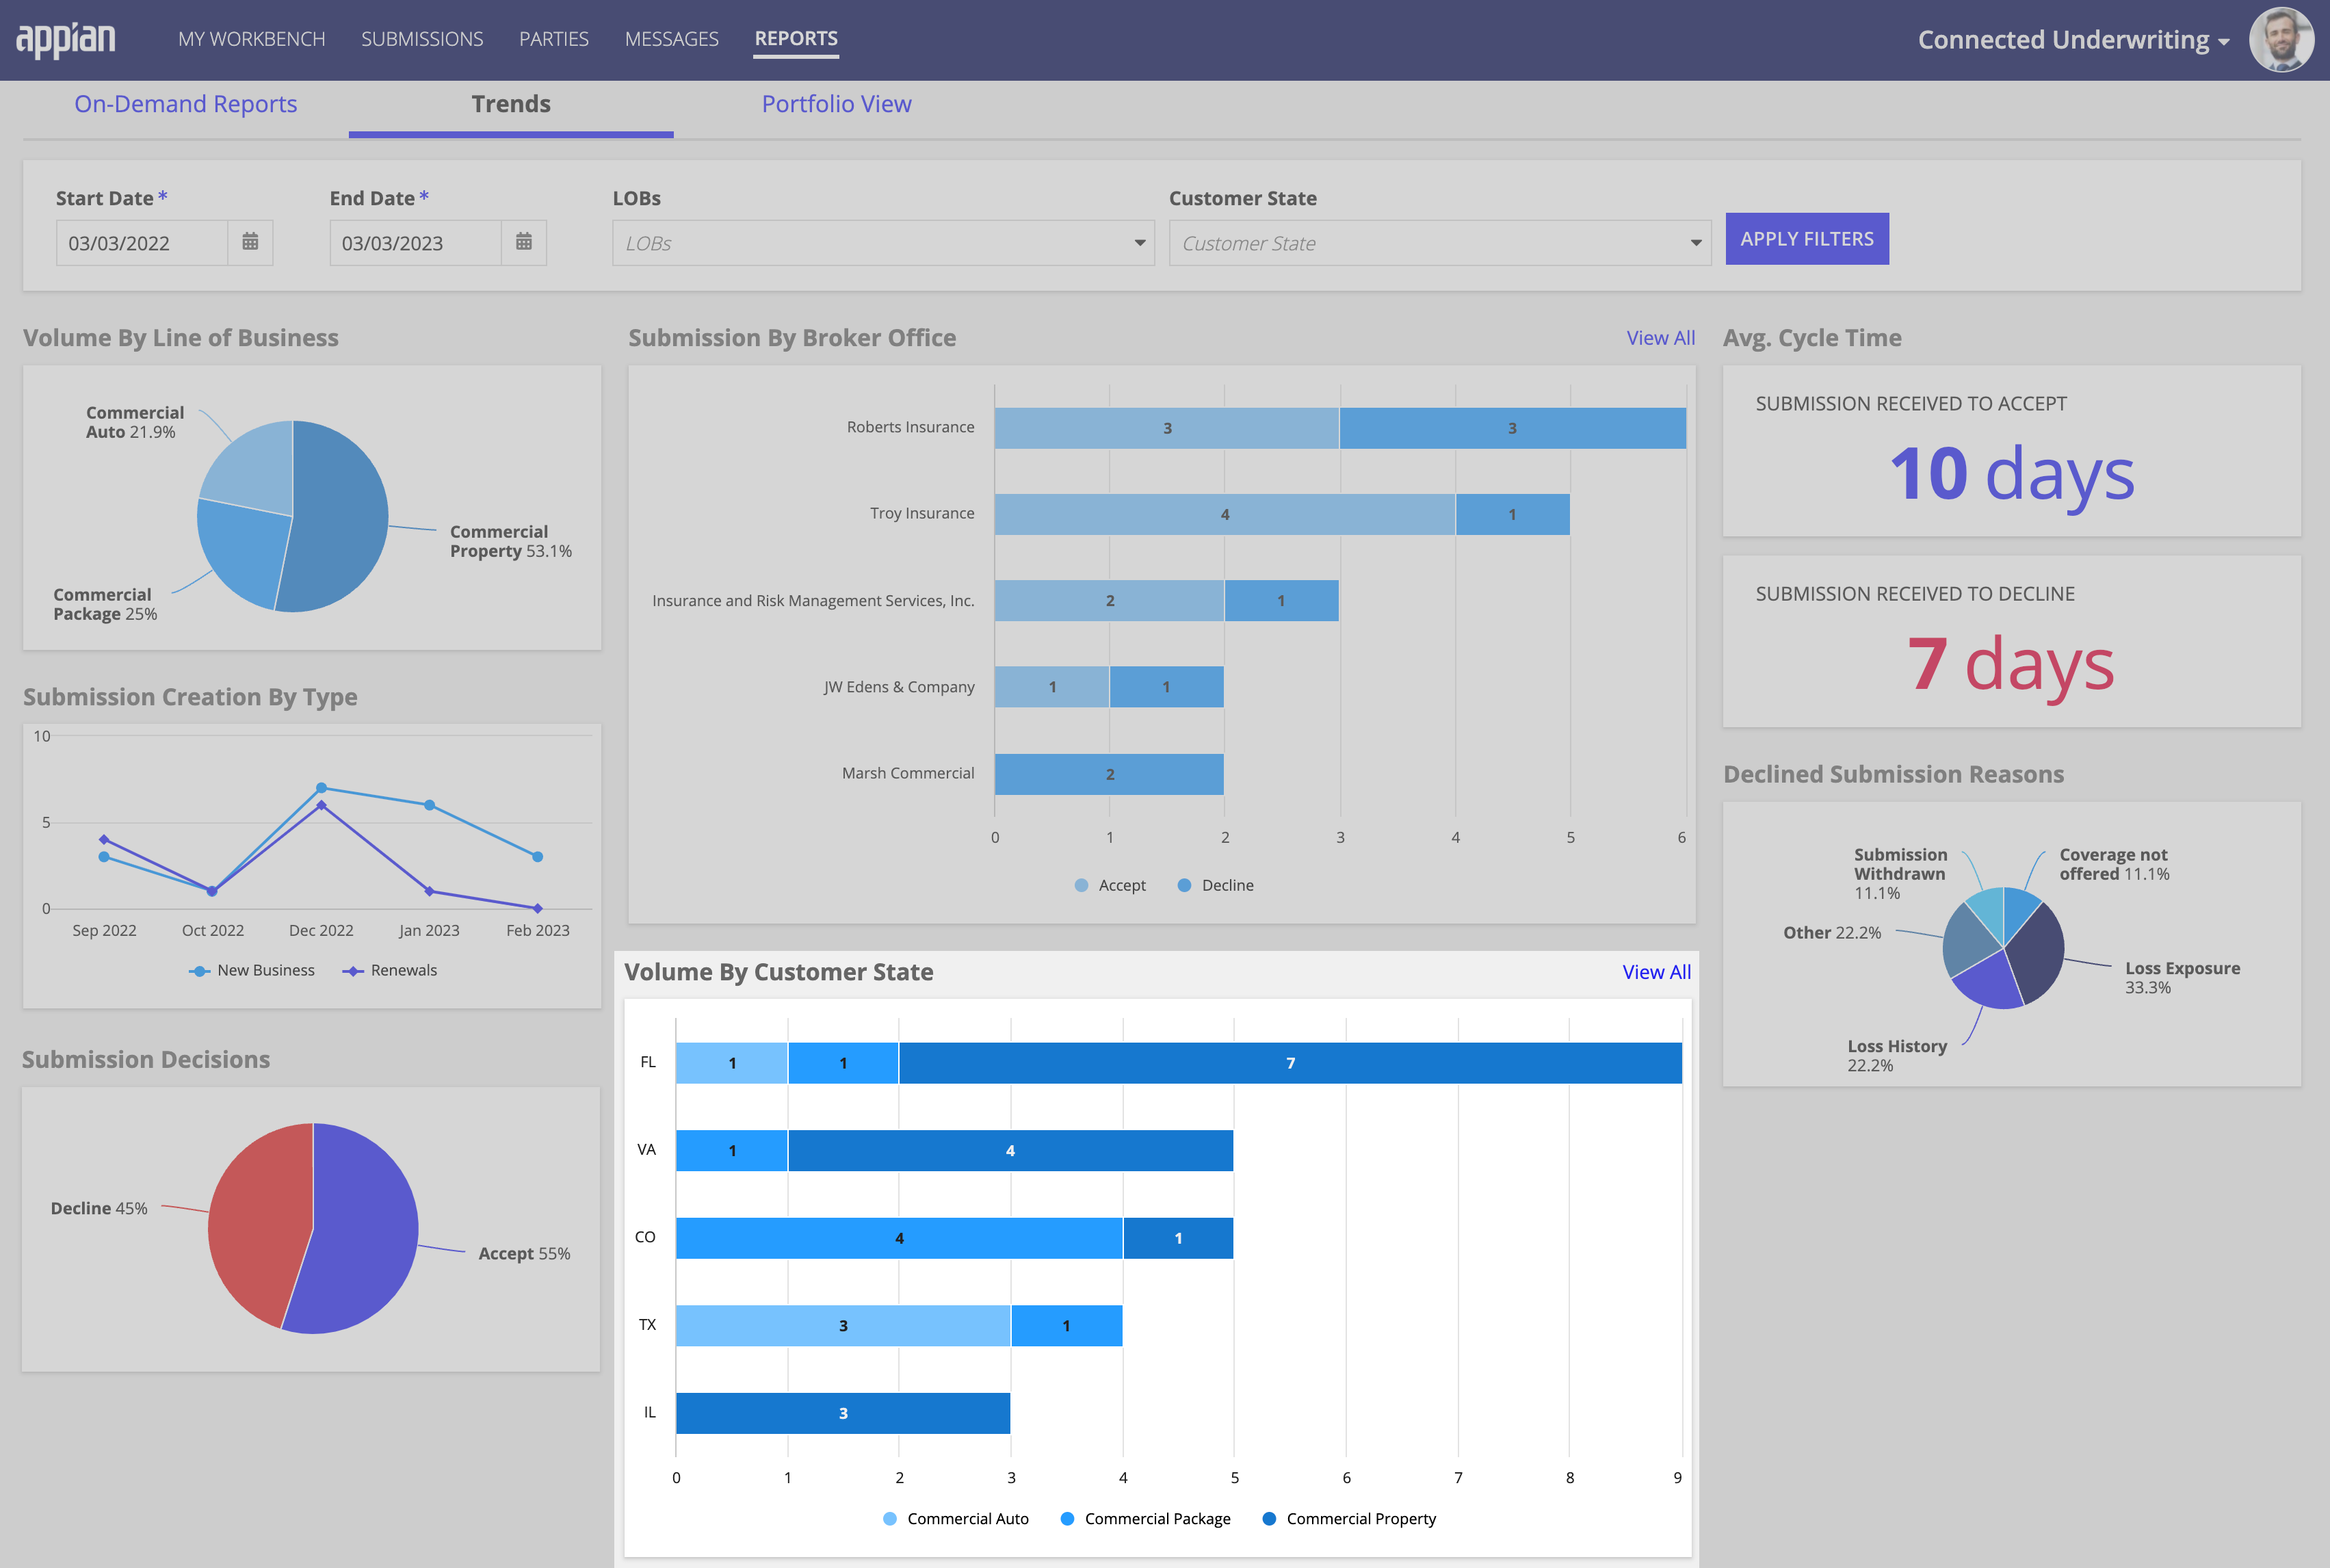
You can also apply one or more filters to the Trends tab to narrow the data displayed in this chart to return only the submission data that match specific criteria.
To view this data in list form, click the View All link associated with this chart. Connected Underwriting will display the data by customer state, showing the total number of submissions for commercial property, commercial auto, and commercial package.
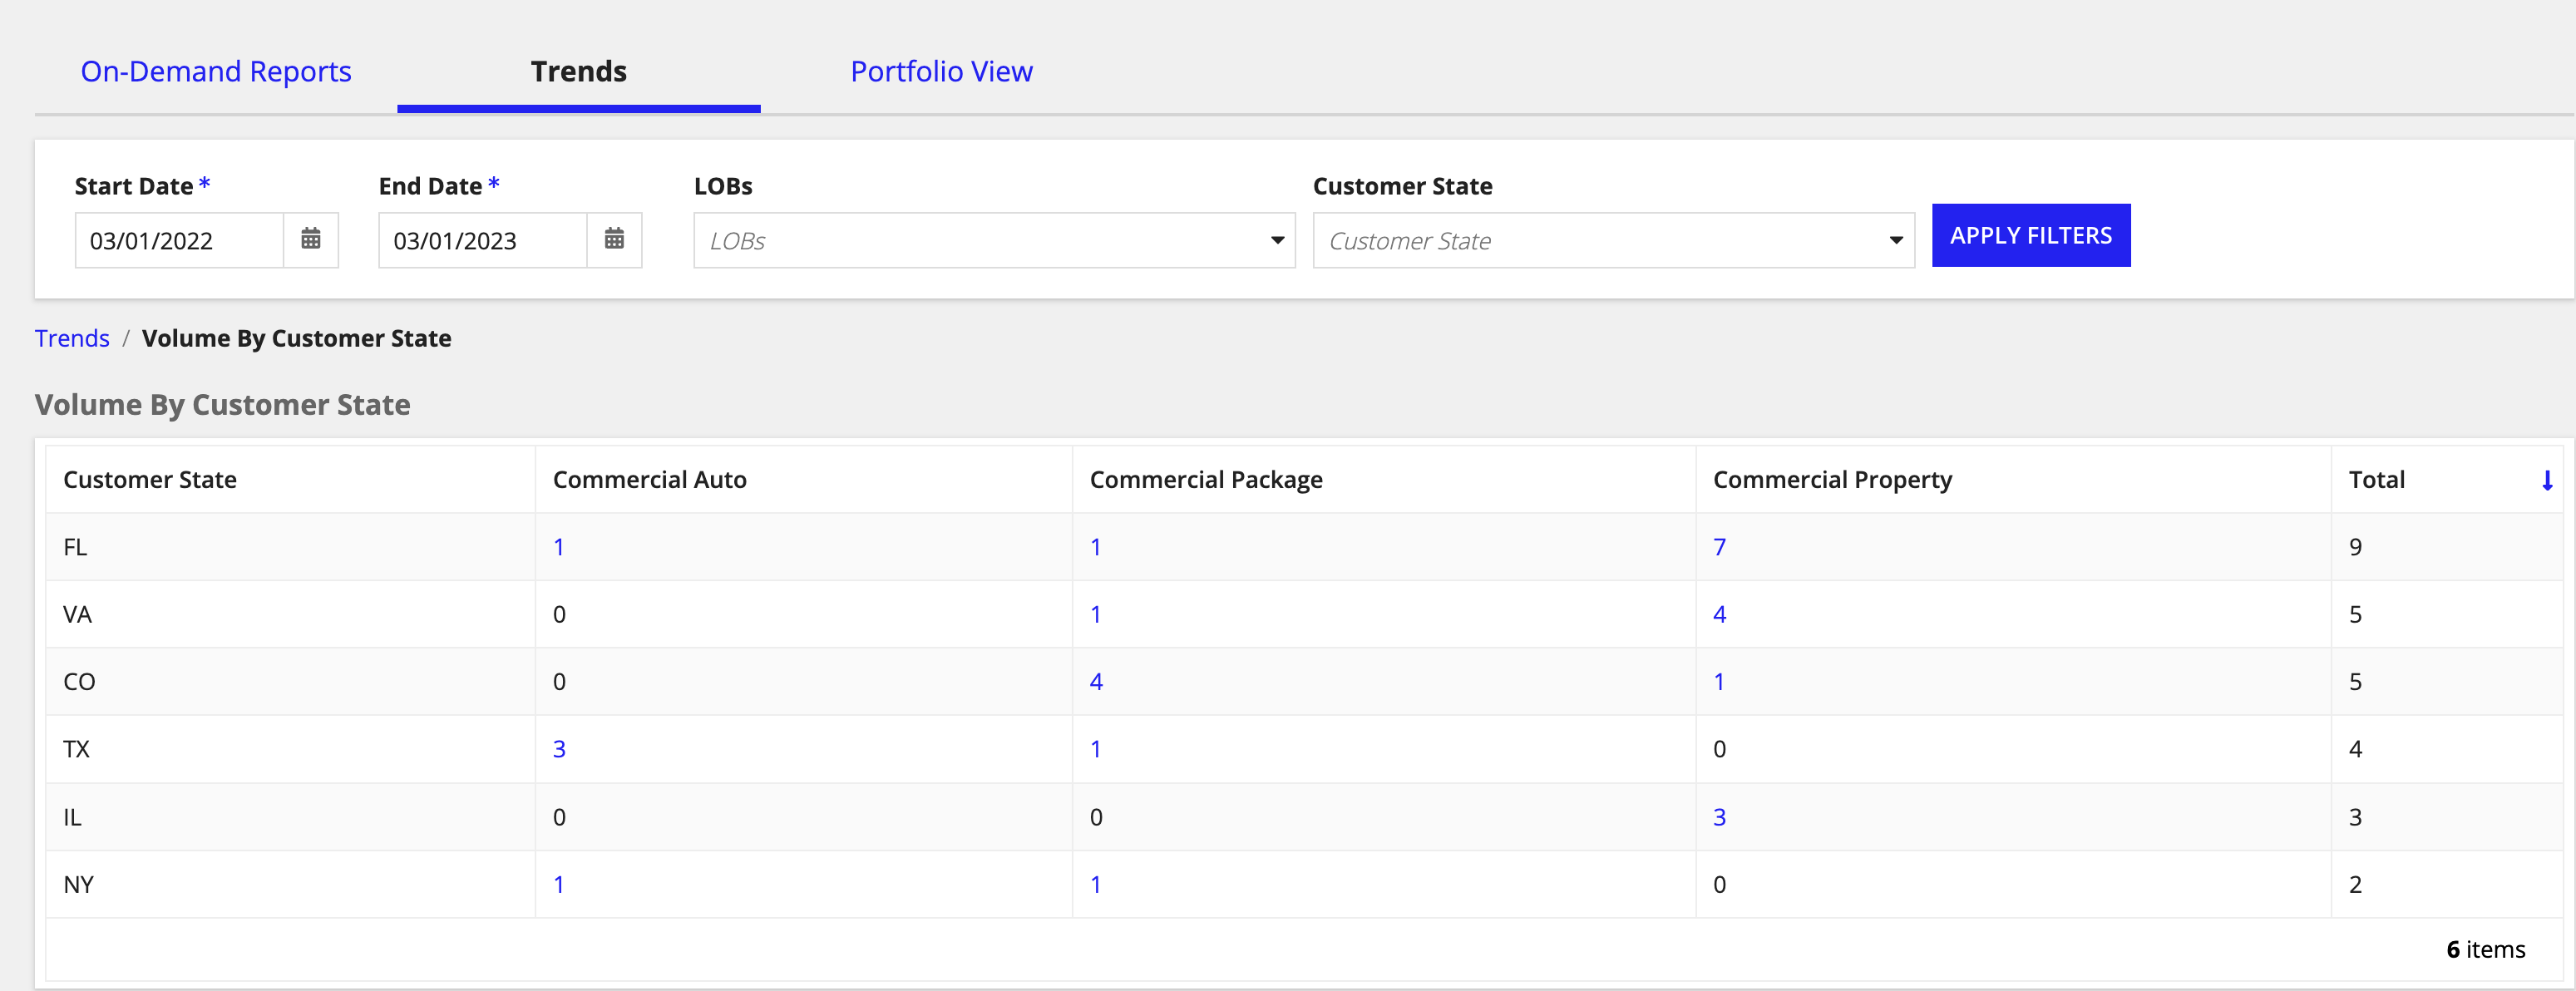
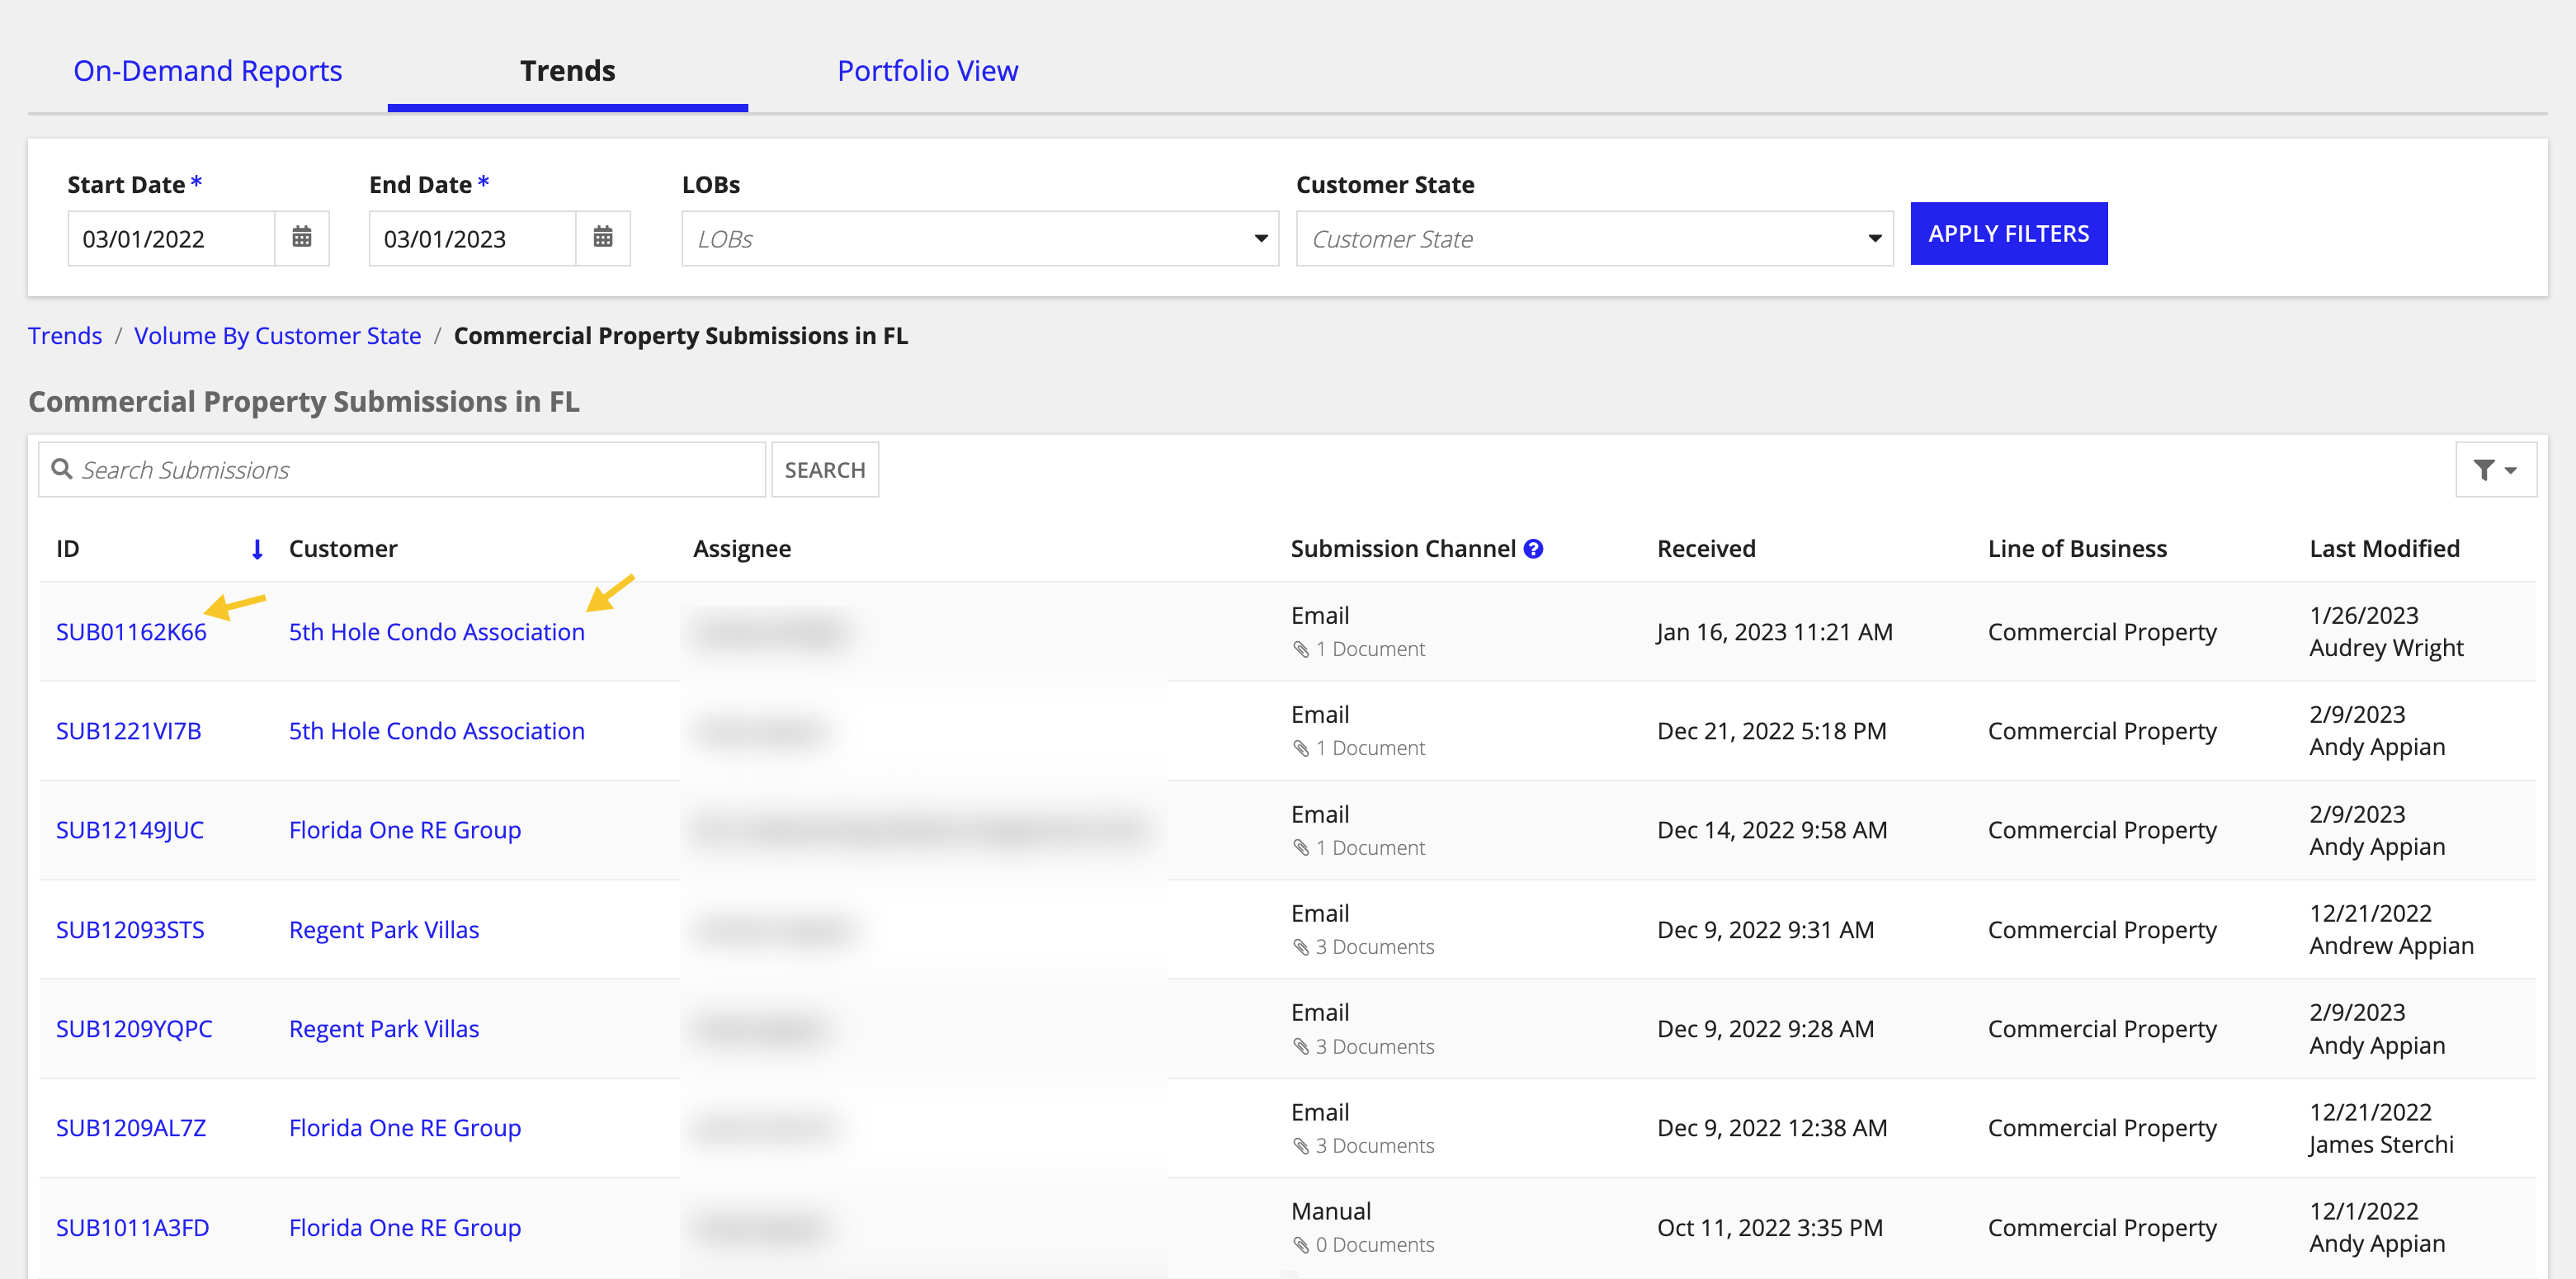
Click on the submission count for any line of business to see a complete list of the submission records. Use this view to locate a specific submission record, and click the record link to drill down and see more details. You can also access the customer record from this view.
As an underwriting manager or admin, you can use this chart to answer the following questions:
You can also apply one or more filters to narrow the data in this graph down to return the results that match your filter criteria.
The Declined Submission Reasons pie chart shows an underwriting manager the percentage of submissions that were declined by reason. Options include: Submission Withdrawn, Coverage Not Offered, Loss Exposure, Loss History, and Other, which consists of any submissions that were declined for reasons that do not match one of the other decline categories.
You can use this chart to answer the following questions:
Having a macro view of your entire business is critical to decision-making. Connected Underwriting provides a way for you to surface a portfolio view of your external data sources through a Microsoft PowerBI integration.
Once this integration is set up and configured, you'll have access to the Portfolio View tab on the REPORTS page as an underwriting manager. This tab provides a dashboard view that allows you to surface reports and data from your external systems into your Connected Underwriting solution, providing a centralized view of all the information you need to understand your health of your business operations at any time. Have the insights you need to identify and track key performance indicators that tell you how well your teams are doing against major goals and initiatives and make sound decisions about changes, risks, and other factors that impact your business.
See Integrating with Microsoft PowerBI for instructions on how to set up the connected system and configure the Microsoft PowerBI integration with your Connected Underwriting solution.
Note: The Microsoft PowerBI is optional integration. You will only have access to the Portfolio View tab in REPORTS when this integration is configured through a connected system.
Viewing CU Reports
