

| SAIL Design System guidance available for Charts
Every chart should tell a story. What does yours say? Learn how to build rich reporting dashboards that provide users with visualizations of their data. |
FunctionCopy link to clipboard
Determines the numerical values to display on a query, chart, or KPI. The measure should incorporate a record field or a related record field, the appropriate calculation to run on the field, and an alias. If your record type has data sync enabled, you can also apply filters to determine which values are included in the calculation.
This configuration is used when a record type is defined as the data source for a chart, KPI, or query. This function can be in:
- The measure parameter in a bar, column, line, or pie chart.
- The primaryMeasure and secondaryMeasure parameters in a KPI.
- A record type query.
See also:
ParametersCopy link to clipboard
| Name | Keyword | Types | Description |
|---|---|---|---|
|
Field |
|
Any Type |
The record field or related record field to use in this calculation, configured using the |
|
Function |
|
Text |
Function to use with calculations on the field provided. Accepts |
|
Alias |
|
Text |
The short name by which the result of the measure field can be referenced in other places in the chart configuration or |
|
Label |
|
Text |
Text to display in the legend or tooltip when using the measure in a chart. If no label is defined, the label displays with the function name and field name. The label only displays if a single grouping is used on a bar, column, or line chart. This parameter is ignored when used in |
|
Filter |
|
Any Type |
A single, logical expression or a list of query filters to filter the record set. Queries also apply the default filters defined on the referenced record type. This parameter is only available on record types that have data sync enabled. |
|
Format value |
|
Text |
Display value for the given measure value. Only applies when the measure is used in a records-powered chart. Valid formats are |
Usage considerationsCopy link to clipboard
Using the field and function parametersCopy link to clipboard
- The field and function parameters are required. The field parameter also must reference a record field or a related record field from the record type specified in the query, chart, or KPI.
- If no measure is provided in a chart, by default the chart will display as a count of the primary key field.
Count and mathematical functionsCopy link to clipboard
- The functions
SUM,MIN,MAX, andAVGcan only be used with fields of type integer or decimal. - The function
DISTINCT_COUNTis only supported with entity-backed or synced record types. -
The
COUNTfunction will count the total number of values in a record field, whereas theDISTINCT_COUNTfunction will only count the unique values in a record field.For example, say you want to count the number of customers who've placed an order. Since one customer can place many orders, the
COUNTfunction would count the same customer twice; however, theDISTINCT_COUNTfunction will only count that customer once, even if they've placed multiple orders.
Using the alias parameterCopy link to clipboard
- When using
a!measure()in a query, the alias is required. - If an alias is provided, it must be used as the field in the sort parameter within the parent configuration function.
Using the label parameterCopy link to clipboard
- The label determines the text label displayed in the legend or tooltip for the measure when used in a chart. This parameter is ignored when used in
a!queryRecordTypeor a KPI component. - If no label is provided, the default label displays with the function and field name, such as
Count of id. - The label does not apply when used with a secondary grouping, as the label is then determined by the secondary grouping field value. Also, the label does not apply when using a measure in a pie chart.
Using the filters parameterCopy link to clipboard
-
The filters parameter is available for record types that have data sync enabled, and can be used to determine which values are included in the calculation specified in the field and function parameters.
-
You can filter on a record field or a related record field, and the field reference must start from the aggregated record type.
For example, you have a Customer record type that has a one-to-many relationship with the Order record type. In a report, you want to calculate the number of orders for each customer that include the order item "Printer". Since you're aggregating on the Order record type, the field reference in the filter must start from
recordType!Order.The
a!measurefunction would look something like this:1 2 3 4 5 6 7 8 9 10 11 12 13 14
a!measure( function: "COUNT", ! field: recordType!Customer.relationships.orders.fields.id, alias: "count_of_id", /* Since the Order record type is the related record type used in the field parameter, we'll use that record type reference in the filter.*/ filters: { a!queryFilter( ! field: recordType!Order.relationships.orderItem.fields.itemName, operator: "=", value: "Printer" ) } )
Copy -
When you filter on a field from a related record type in a one-to-many relationship (the "many" side of the relationship), the filter returns all records from the base record type (the "one" side of the relationship) that have at least one related record that meets the filter condition.
For example, an order can have many order items. So using the filter above, the aggregation will count all customer orders that have at least one order item called "Printer".
Note: You cannot use a custom record field defined using a!customFieldMatch() as a filter in a!measure().
Using the formatValue parameterCopy link to clipboard
The formatValue has several predefined options to make the numbers on your records-powered chart or KPI easier to read and understand. You can also customize the formatting to make your data more meaningful to users.
For example, your app may have a chart showing the average monthly temperature in each US state. If this data is stored in a record field as a Number (Decimal), the "AUTO" option lists each value as an unformatted number.
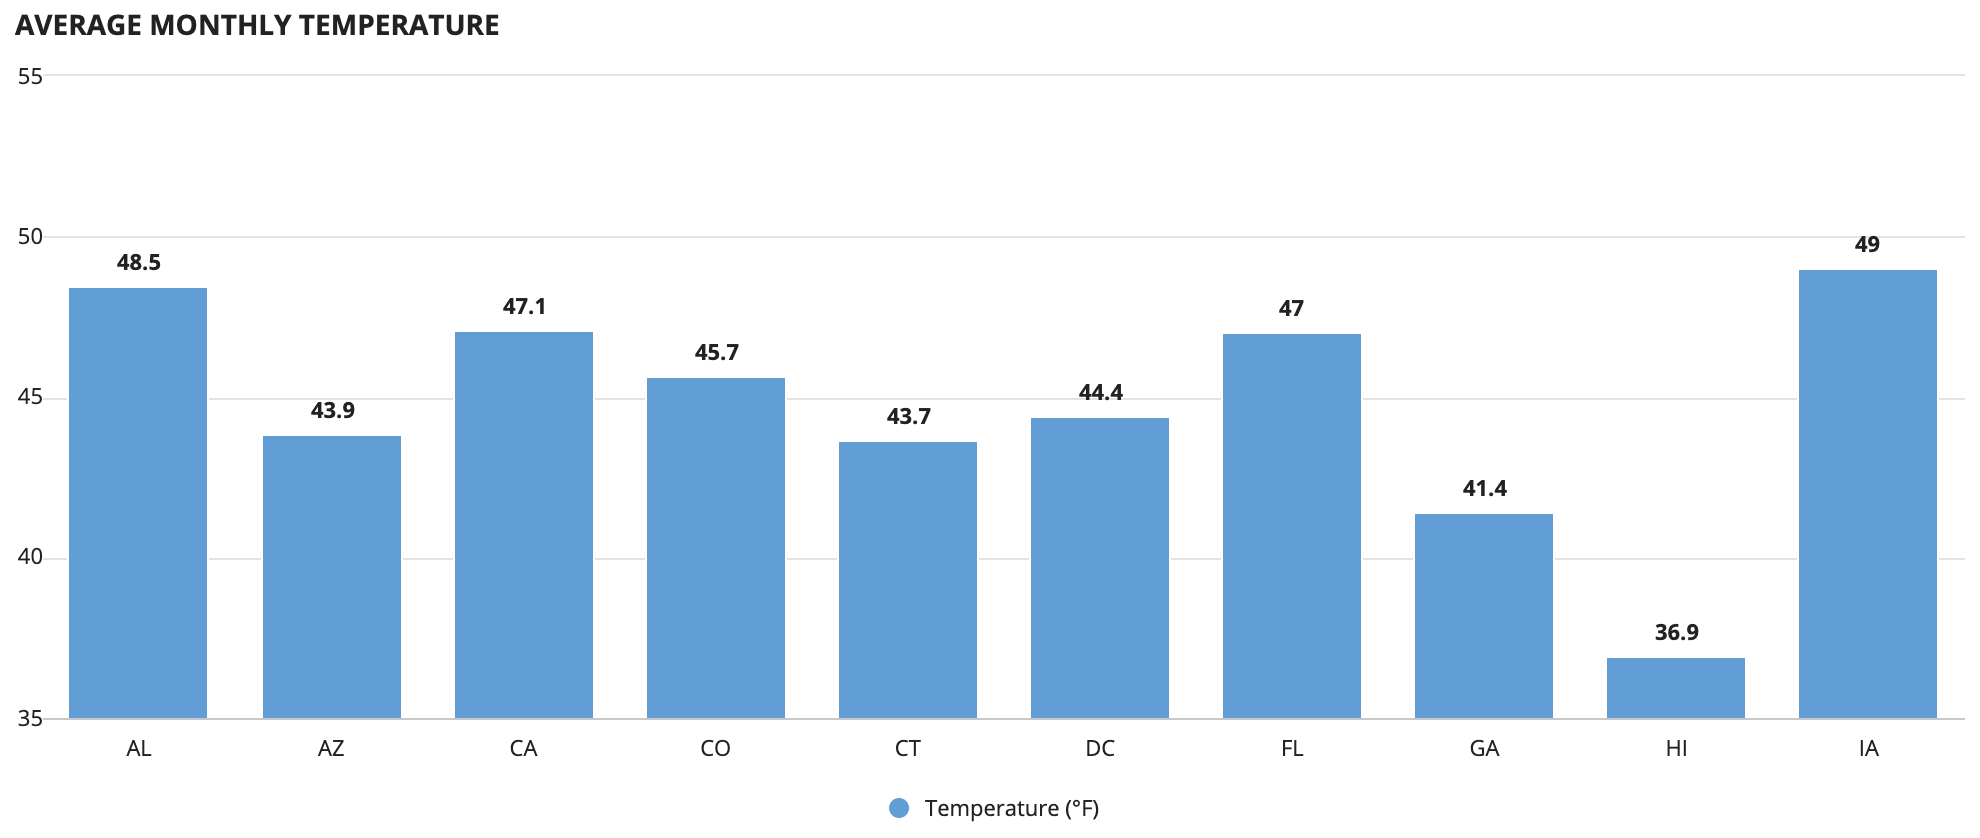
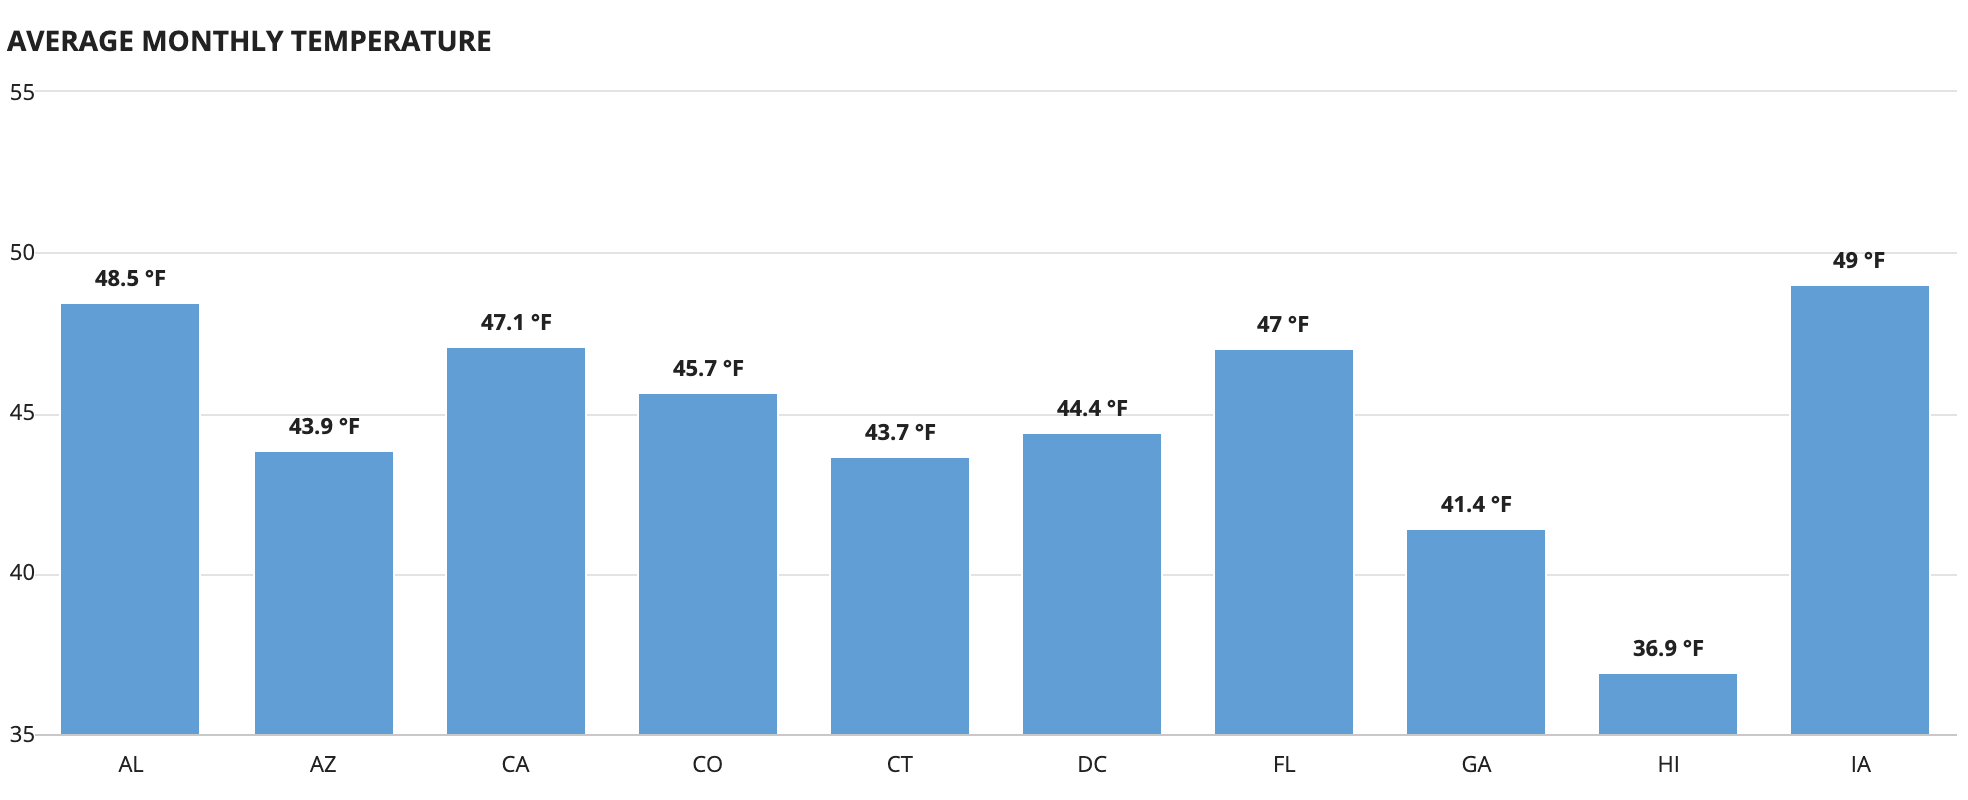
You can customize the formatting to indicate temperature by concatenating each value with the degree symbol and unit of measure.
1
text(fv!value, fv!value & " " & char(176) & "F")
Copy
Measures on chartsCopy link to clipboard
- If you use a bar, column, or line chart, you can display multiple measures if no Secondary Grouping field is provided. See Chart Configuration Using Records for more information on how to add measures to charts.
- You can select a predefined or custom format value to change how the measure data is displayed on the chart. See Using format values for more information.
Measures on KPIsCopy link to clipboard
Measures are used in two of the KPI component's parameters: primaryMeasure and secondaryMeasure. Together, these parameters let you display data trends and extract greater value from the metrics captured in your record data. The values created for these parameters can be referenced in other KPI parameters as fv!primaryMeasure and fv!secondaryMeasure. See KPI Component for more information.
Feature compatibilityCopy link to clipboard
The table below lists this component's compatibility with various features in Appian.
| Feature | Compatibility | Note |
|---|---|---|
| Portals | Compatible | |
| Offline Mobile | Compatible | |
| Sync-Time Custom Record Fields | Incompatible | |
| Real-Time Custom Record Fields | Incompatible | Custom record fields that evaluate in real time must be configured using one or more Custom Field functions. |
| Process Reports | Incompatible | Cannot be used to configure a process report. |
| Process Events | Incompatible | Cannot be used to configure a process event node, such as a start event or timer event. |
Related PatternsCopy link to clipboard
The following patterns include usage of the Measure Component.
-
Aggregate Data and Conditionally Display in a Chart or Grid (Reports, Charts, Query Data, Grids, Records): Aggregate data and conditionally display it in a pie chart or grid. In this pattern, we will calculate the total number of employees in each department and display it in a pie chart and a read-only grid. Then, we'll use a link field to conditionally display each component.
-
Aggregate Data and Display in a Chart (Reports, Charts, Query Data, Records): Aggregate data, specifically the total number of employees in a given department, to display in a pie chart.
-
Aggregate Data by Multiple Fields and Display in a Chart (Reports, Charts, Query Data, Records): Aggregate data by multiple fields and display it in a stacked column chart. In this pattern, we will calculate the total number of employees for each title in each department and display it in a stacked column chart.
-
Aggregate Data on a Date or Date and Time Field (Reports, Query Data, Grids, Records): Aggregate data, specifically the total number of employees by date.
-
Aggregate Data using a Filter and Display in a Chart (Reports, Charts, Query Data, Filtering, Records): Aggregate data, specifically the total number of employees for each title in the Engineering department, to display in a bar chart.
-
Configure a Chart Drilldown to a Grid (Charts, Grids, Query Data, Records): Displays a column chart with aggregate data from a record type and conditionally shows a grid with filtered records when a user selects a column on the chart.
-
Dynamically Show Sales by Product Category Compared to Total Sales (Records, Reports, Charts, Filtering): This pattern illustrates how to create an area chart that dynamically displays sales generated by product category compared to total sales.
-
Filter the Data in a Grid Using a Chart (Charts, Grids, Filtering, Records): Display an interactive pie chart with selectable sections so that a user may filter the results in a grid.
-
Percentage of Online Sales (Records, Reports, Formatting): This pattern illustrates how to calculate the percent of sales generated from online orders and display it in a gauge component.
-
Sales by Region (Records, Reports, Charts): This pattern illustrates how to create a bar chart that shows sales per sales region.
-
Total Orders Compared to Orders Purchased with Promo Codes (Records, Reports, Charts): This pattern illustrates how to create a column chart that compares the number of total orders and the number of orders that had at least one item purchased with a promo code.
-
Year-Over-Year Sales Growth (Records, Reports, Formatting): This pattern illustrates how to calculate year-over-year sales growth and display it in a KPI.