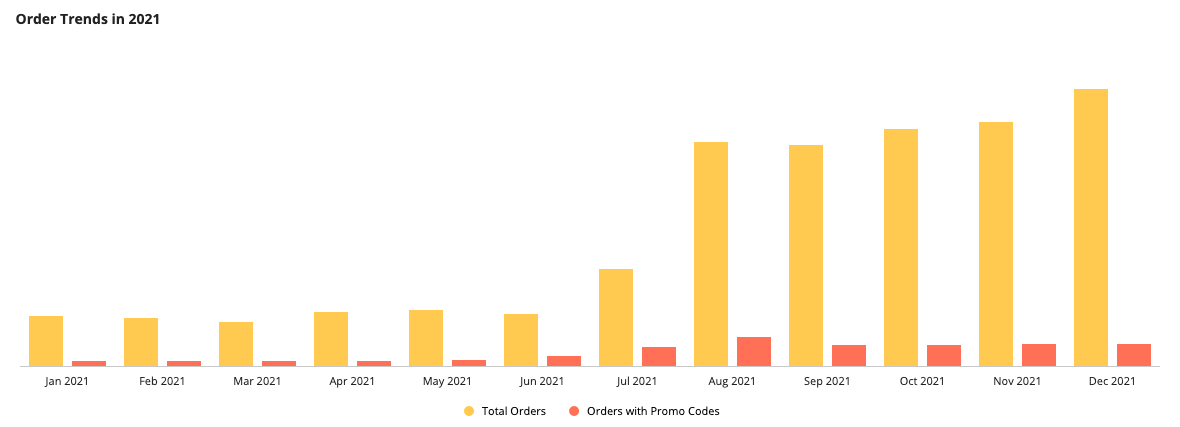
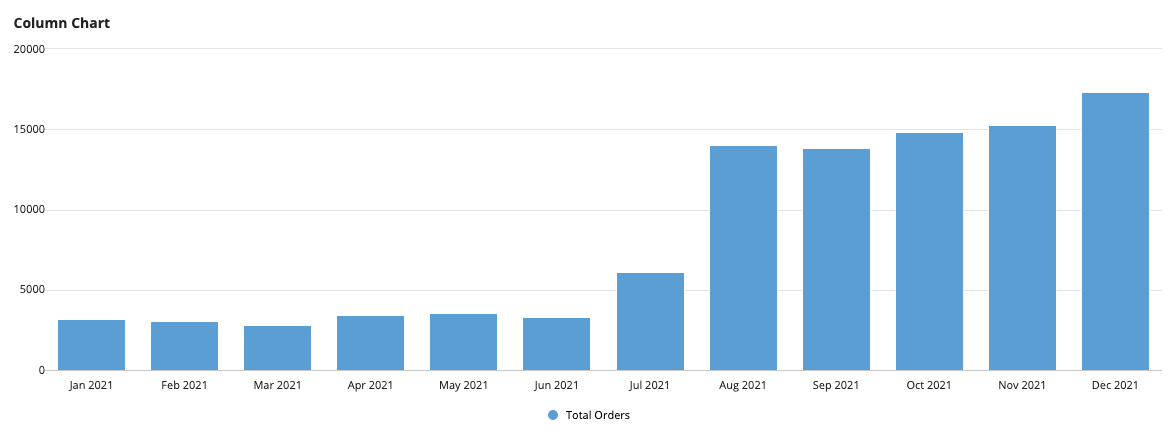
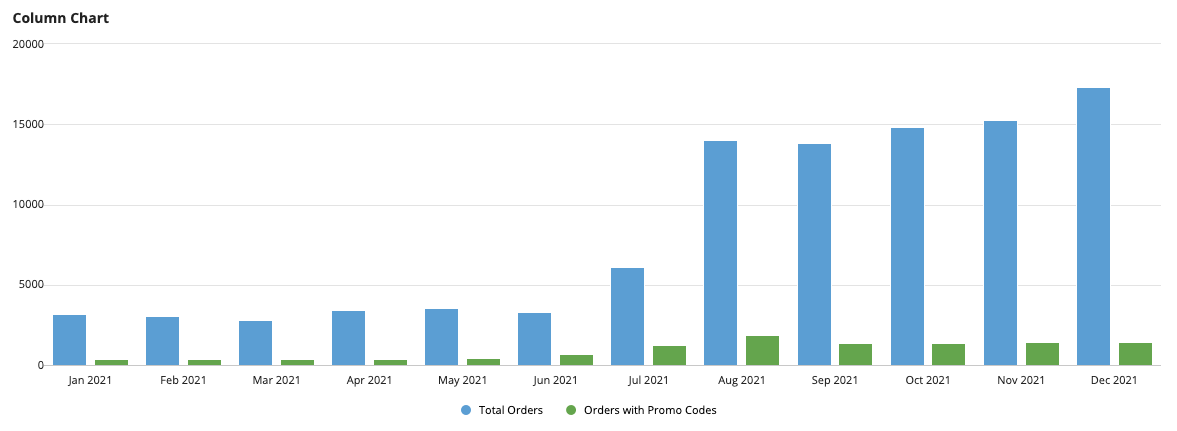
This pattern illustrates how to create a column chart that compares the number of total orders and the number of orders that had at least one item purchased with a promo code. This pattern also provides a sample scenario to show how you can take common business requirements and quickly turn them into a report.
You'll notice that this pattern provides more than just an expression, it shows you the fastest way to build reports in Design Mode. To get the most out of this pattern, follow the steps in Create this pattern to learn how to build advanced reports using the latest low-code features.
ScenarioCopy link to clipboard
Account managers at the Appian Retail company want to know: of the total number of orders placed in 2021, how many orders had at least one item purchased with a promo code? Account managers will use this information to see if promo codes are having a positive effect on their total number of sales. Depending on the data, they may choose to send more promo codes during lower performing months to boost sales.
To allow account managers to analyze the relationship between promo codes and total orders, you'll use the pattern on this page to create a column chart that shows the count of total orders and the count of orders that contain at least one promo code.
The report will look like this:
SetupCopy link to clipboard
This pattern uses data from the Appian Retail application, available for free in Appian Community Edition. To follow along with this pattern, log in to Appian Community and register for Appian Community Edition.
In Appian Community Edition, create a test application to follow along with patterns and examples using data from the Appian Retail application.
This pattern will use data from the following record types in the Appian Retail application:
- Order record type: Contains order information like the order number, date, status, and whether it was purchased online or in stores. For example, order number SO43659 was purchased in stores on 5/31/2019 and the order is closed.
- Order Detail record type: Contains specific order details like the number of order items, order totals, promo codes applied, and products. For example, the order above contained one product that cost $2,024.99.
- Promo Codes record type: Contains promo code details, like the name of the promo code, the discount percentage, type, and timeframe. For example, the Mountain Tire Sale promo code gave 50% off to customers who purchased tires from 5/14/2013 to 7/29/2013.
Create this patternCopy link to clipboard
To create this pattern, you will:
- Create a column chart that shows the number of orders placed each month.
- Add a second measure to show the number of orders that have at least one item purchased with a promo code.
- (Optional) Format the column chart.
Step 1: Create a column chart that shows orders per monthCopy link to clipboard
To create the column chart for this pattern:
- In your test application in Appian Community Edition, go to the Build view.
- Click NEW > Interface.
- Configure the interface properties and click CREATE.
- From the PALETTE, drag a COLUMN CHART component into the interface.
- From Data Source, select RECORD TYPE and search for the Order record type.
- Click the pencil icon next to the Primary Grouping to configure the chart's grouping and formatting:
- For Field, remove the existing field. Then, use the dropdown to select orderDate.
- For Alias, enter
orderDate. - For Time Interval, select Month.
- For Format Value, use a pre-defined format to display the abbreviated month and year. For example, Sep 2021.
- Return to the Column Chart component configuration.
- Click the pencil icon next to the Measure to configure the chart's aggregation:
- For Label, enter
Total Orders. - For Aggregation Function, keep the default selection of Count of.
- For Field, keep the default selection of orderId.
- For Label, enter
- Return to the Column Chart component configuration.
- Click FILTER RECORDS.
- Click Add Filter and configure the following conditions:
- For Field, select orderDate.
- For Condition, select Date Range.
- For Value, use the context menu () to select Expression.
- Click null to edit the expression.
-
Replace the existing value with the following expression:
1
2
3
4
{
  todatetime("01/01/2021"),
  todatetime("12/31/2021")
}
Copy
Tip: In your own applications, you can use Date Presets to dynamically filter data. This pattern uses a static date for testing purposes.
- Click OK.
-
Click OK to close the dialog.
Step 2: Add a second measure with a filterCopy link to clipboard
The chart currently displays the count of orders placed in 2021. Now, we're going to add a second measure with a filter on the measure so it displays the count of orders that have at least one item purchased with a promo code.
Tip: Notice that the filter will return orders with at least one item purchased with a promo code. This at least one behavior occurs because there is a one-to-many relationship between where you are aggregating and where you are filtering. Learn more about "at least one" filter behavior.
To add the second measure:
- On the column chart, click ADD MEASURE.
- Click the pencil icon next to the new Measure to configure the second aggregation:
- For Label, enter
Orders with Promo Codes. - For Aggregation Function, keep the default selection Count of.
- For Field, select the orderId field.
- For Label, enter
- Click + ADD FILTERS.
- Click Add Filter and configure following:
- For Field, use the dropdown to hover over orderDetail > promoCode and select the description field. The field will display as orderDetail.promoCode.description.
- For Condition, select not equal to.
- For Value, enter
No Discount.
-
Click OK.
Optional chart formattingCopy link to clipboard
In this last step, you'll add a chart label, change the color scheme, and hide the Y-Axis labels.
To format the chart:
- Return to the Column Chart component configuration.
- Under Label, enter
Order Trends in 2021. - For Color Scheme, keep the default Choose pre-defined color scheme, and choose Sunset from the dropdown.
-
For Y-Axis Style, choose None.
Full expressionCopy link to clipboard
The resulting expression will look like this:
Note: You can copy and paste this expression into an interface in a Appian Community Edition testing application to see the fully configured pattern. These record type references are specific to the Appian Retail application, so you will only need to replace the record field references if you're following along in a different environment.
1
2
3
4
5
6
7
8
9
10
11
12
13
14
15
16
17
18
19
20
21
22
23
24
25
26
27
28
29
30
31
32
33
34
35
36
37
38
39
40
41
42
43
44
45
46
47
48
49
50
51
52
53
54
55
56
57
58
59
60
61
62
63
64
65
{
  a!columnChartField(
    data: a!recordData(
      recordType: 'recordType!{ad898682-e651-4b2d-af67-47c1fcb1171f}Order',
      filters: a!queryLogicalExpression(
        operator: "AND",
        filters: {
          a!queryFilter(
            field: 'recordType!{ad898682-e651-4b2d-af67-47c1fcb1171f}Order.fields.{fbcc99f6-1ddf-4923-903b-18122a1737c6}orderDate',
            operator: "between",
            value: {
              todatetime("01/01/2021"),
              todatetime("12/31/2021")
            }
          )
        },
        ignoreFiltersWithEmptyValues: true
      )
    ),
    config: a!columnChartConfig(
      primaryGrouping: a!grouping(
        field: 'recordType!{ad898682-e651-4b2d-af67-47c1fcb1171f}Order.fields.{fbcc99f6-1ddf-4923-903b-18122a1737c6}orderDate',
        alias: "orderDate_month_primaryGrouping",
        interval: "MONTH_SHORT_TEXT"
      ),
      measures: {
        a!measure(
          label: "Total Orders",
          function: "COUNT",
          field: 'recordType!{ad898682-e651-4b2d-af67-47c1fcb1171f}Order.fields.{262bb249-cf34-4171-a573-54831d0958dd}orderId',
          alias: "orderId_count_measure1"
        ),
        a!measure(
          label: "Orders with Promo Codes",
          function: "COUNT",
          field: 'recordType!{ad898682-e651-4b2d-af67-47c1fcb1171f}Order.fields.{262bb249-cf34-4171-a573-54831d0958dd}orderId',
          filters: a!queryLogicalExpression(
            operator: "AND",
            filters: {
              a!queryFilter(
                field: 'recordType!{ad898682-e651-4b2d-af67-47c1fcb1171f}Order.relationships.{0bde4028-fd7a-411f-97ad-7ad5b84e0d18}orderDetail.relationships.{2ca679d6-3800-419b-8310-c1e328897e60}promoCode.fields.{aad6d5cd-e48f-46b4-bb00-a8252d51b3ee}description',
                operator: "<>",
                value: "No Discount"
              )
            },
            ignoreFiltersWithEmptyValues: true
          ),
          alias: "orderId_count_measure2"
        )
      },
      dataLimit: 100,
      showIntervalsWithNoData: true
    ),
    label: "Order Trends in 2021",
    stacking: "NONE",
    showLegend: true,
    showTooltips: true,
    labelPosition: "ABOVE",
    colorScheme: "SUNSET",
    height: "MEDIUM",
    xAxisStyle: "STANDARD",
    yAxisStyle: "NONE",
    refreshAfter: "RECORD_ACTION"
  )
}
Copy


