
This page applies to business users. This page describes what actions are available during an active investigation.
OverviewCopy link to clipboard
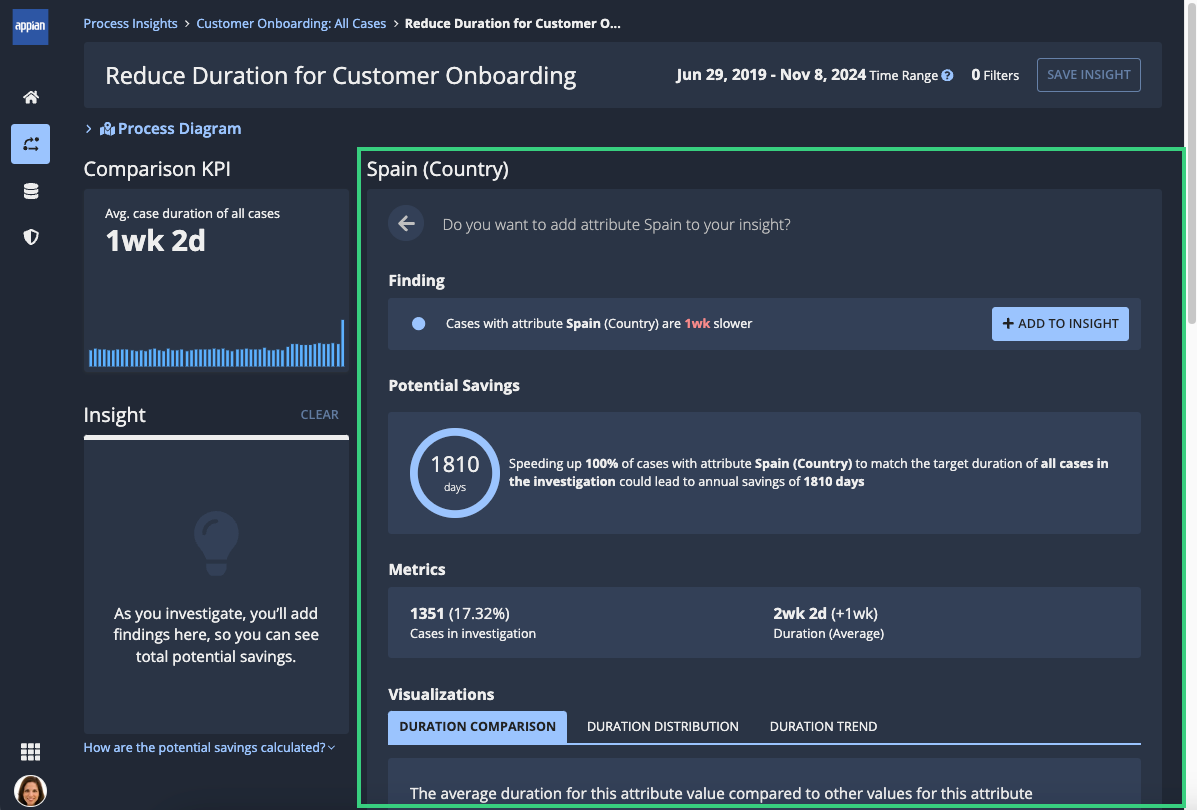
In Process HQ, the active investigation page lets you take a closer look into specific patterns and issues in your process, so you can uncover insights that lead to improvements. To access this page, start an investigation or continue a saved investigation.
ElementsCopy link to clipboard
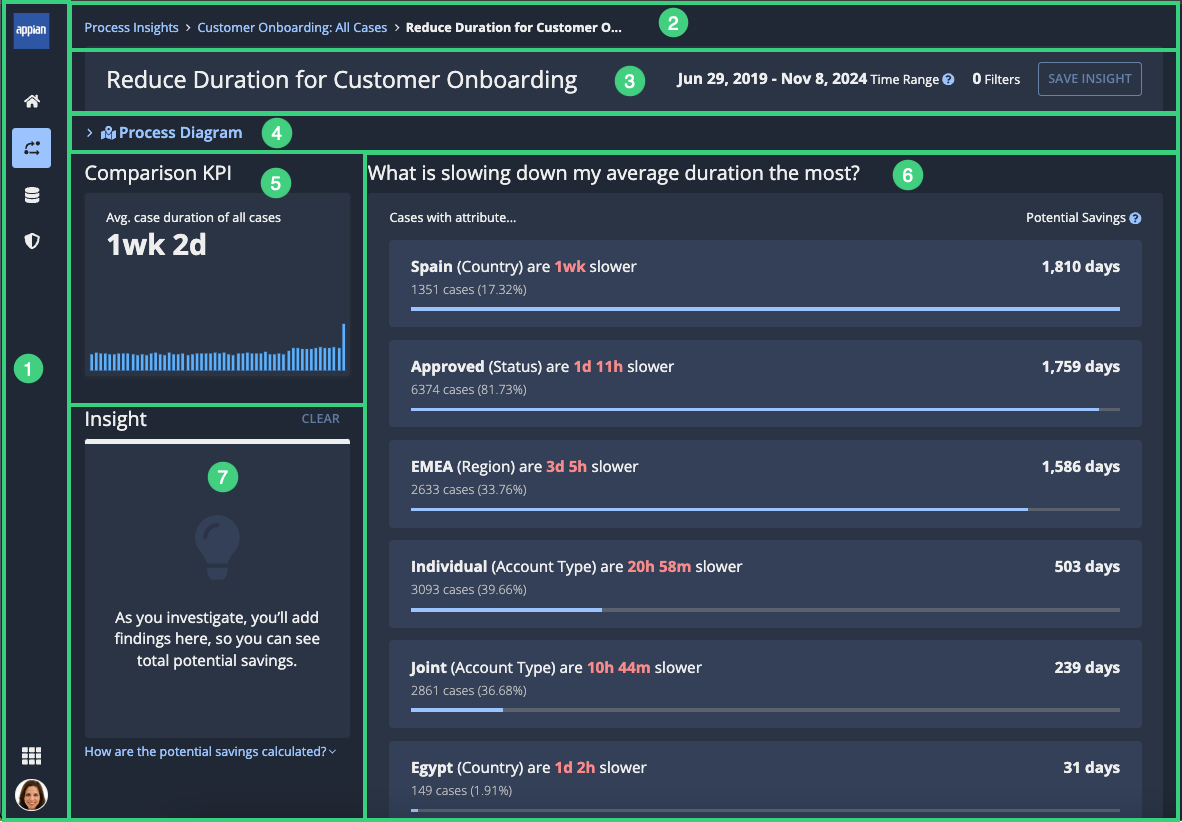
The following image highlights the elements of the active investigation page:

# |
Element |
Actions Available |
|---|---|---|
1 |
Navigation bar |
|
2 |
Breadcrumbs |
Navigate to the Process Insights page or the process view page associated with the investigation. |
3 |
Investigation header |
|
4 |
Process diagram |
Review a process diagram constructed only from cases in the investigation. The elements of this process diagram update to reflect the choices you make while building an insight. |
5 |
Comparison KPI |
Review the key performance indicator (KPI) for the current investigation. To calculate potential savings or potential reduction, Process HQ compares the cases or occurrences related to the current finding against this KPI. The KPI also includes a trend chart representing changes in the KPI over the date range of the investigation. You can hover over the chart to see more details for each data point. Note: In duration investigations, this value updates with each finding you add to the insight. |
6 |
Investigation pane |
Review and interact with process data:
|
7 |
Insight pane |
Track important findings in a tree format and view the cumulative effect of those findings on the potential savings or potential reduction. See the description for a full list of actions. |
Understanding the investigation displayCopy link to clipboard
During an active investigation, adding a finding to an insight is the equivalent of applying a filter to the cases you're investigating. The focus of the investigation will narrow to the context of cases affected by the finding you add. Learn more.
In addition, the type of finding included in the insight affects the unit of analysis that displays in the investigation. The following sections describe how these units of analysis are used:
The investigation page also displays calculations of potential improvement for each finding. The following sections describe how these numbers are calculated:
Unit of analysis: casesCopy link to clipboard
If the comparison KPI for the insight involves an attribute value, the investigation displays the analysis in terms of affected cases. For example, the attribute value details will show you the number of cases affected by the attribute value.
Cases in the attribute values list
Cases in the attribute value details
Unit of analysis: occurrencesCopy link to clipboard
If the comparison KPI for an insight involves a process part, the investigation displays the analysis in terms of occurrences of the process part. For example, the process part details will show you how many times a sequence occurs in cases in the investigation.
Occurrences in the process part details
If the comparison KPI for an insight involves a process part, any findings you review or add to the insight will display in terms of occurrences.
Occurrences in the attribute values list

Occurrences in the attribute value details
Calculation: potential savingsCopy link to clipboard
This calculation displays in duration investigations only.
This number represents the time you could save each year if the average duration of cases or occurrences with this attribute value could match the average duration of all cases in the investigation.
Process HQ calculates this number based on the average duration of all cases or occurrences with the findings in the insight—excluding the most recently added attribute finding. By default, potential savings is calculated per year, but you can adjust the calculation on a saved insight.
More specifically, Process HQ uses the following formula:
potential savings = (finding duration - target duration) x count
This formula contains the following elements:
- Finding duration: The average number of days that cases with the selected finding and related to the KPI take to complete.
- Target duration: The average number of days that cases related to the KPI take to complete.
- Count: The total number of cases or occurrences with the selected finding in the insight.
Tip: Although calculated per year, potential savings are not limited to the number of days in a calendar year. This is because potential savings represent time that could be saved collectively across the multiple times the process runs in the calendar year.
ExampleCopy link to clipboard
Let's say your KPI counts the average duration of closed cases. Your investigation is now looking closer at cases related to this KPI that have the attribute Spain (Country).
Here are the values Process HQ uses in its calculation:
- Finding duration: When cases related to this insight have this attribute, they take 30 days on average to complete.
- Target duration: When cases not related to this insight have this attribute, they take 15 days on average to complete.
- Count: There are 100 cases related to this insight that have this attribute.
In this scenario, the potential savings for closed cases in Spain is 1,500 days per year:
(30 - 15) * 100 = 1500
Calculation: potential reductionCopy link to clipboard
This calculation displays in occurrence investigations only.
This number indicates the potential for eliminating unwanted occurrences of an attribute. The higher the number, the greater the potential.
To calculate this number, Process HQ compares how often this attribute occurs in cases related to the KPI or insight to how often this attribute occurs in cases not related to the KPI or insight.
More specifically, Process HQ uses the following formula to calculate:
potential reduction = attribute occurrences related to KPI - (target occurrence rate x cases related to KPI)
This formula contains the following elements:
- Attribute occurrences related to KPI: How many times the attribute occurs in cases related to the KPI.
- Target occurrence rate: The percent of cases not related to the KPI in which the selected attribute occurs.
- Cases related to KPI: The total number of cases related to the KPI.
Tip: The potential reduction reflects how many cases with the selected attribute you could potentially improve. That represents the minimum impact you can have if you're working on improving a KPI that tracks occurrences of process parts. You could, in fact, have a larger impact because activities and sequences can routinely occur more than once per case. For example, the potential reduction score might be 50, but the occurrences you want to reduce take place 3 times per case, which means you'd be able to eliminate 150 total occurrences.
ExampleCopy link to clipboard
Let's say your KPI counts cases with the Request for More Information activity, where employees must ask customers for additional information. This activity wastes resources, so you want to reduce its frequency. You see there's a high potential to reduce occurrences of the activity when cases have the attribute Spain (Country).
Here are the values Process HQ uses in its calculation:
- Attribute occurrences related to KPI: The attribute occurs in 500 out of 1000 cases related to this KPI.
- Target occurrence rate: The attribute occurs in 100 out of 3000 cases not related to this KPI, or on average 3% of the time.
- Cases related to KPI: There are 1000 cases related to this KPI.
Realistically, you're unlikely to improve the occurrence rate lower than the target rate, so Process HQ calculates the potential reduction to account for that. To achieve the target occurrence rate (3%) in cases related to this KPI, Requests for Information in Spain should occur in only 33 cases, instead of 500 cases:
3% x 1000 = 33
Process HQ then subtracts the number of target occurrences from the number of total occurrences related to the KPI:
500 - 33 = 467
The potential reduction score is 467. If you focus on reducing the occurrence of Requests for Information activity for cases with the Spain (Country) attribute, your overall Requests for Information could be reduced by 467 cases.
Attribute values listCopy link to clipboard
This list contains attribute values that Process HQ has identified as potentially impacting cases in the investigation. These attribute values are associated with either longer durations or higher occurrence counts, depending on the investigation type.
Attribute values that have the greatest impact are listed at the top of the list.
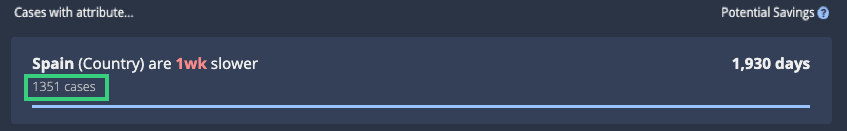
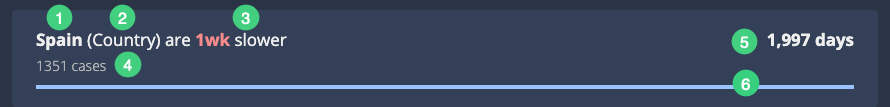
Each item in this list includes the following elements:
# |
Element |
Description |
|---|---|---|
1 |
Attribute Value |
The attribute value. For example, for an attribute named Country, this value would be the name of an individual country, like Spain. |
2 |
Attribute Name |
The attribute name. For example, Country. |
3 |
Statement |
A short statement describing Process HQ's analysis of this attribute in the current context:
|
4 |
Case/occurrence count |
The number of cases or occurrences with this attribute value in this investigation. |
5 |
Potential savings/reduction |
The potential improvement that Process HQ has calculated for cases or occurrences with the attribute, displayed as either potential savings or potential reduction depending on the investigation type. |
6 |
Bar graph |
The bar graph shows how the potential improvement for this attribute value compares to the potential improvement for other values of this attribute. The longer the bar, the more significant the potential improvement in comparison to other values. |
All Attributes listCopy link to clipboard
When you're investigating attributes, you'll see the attribute value list by default, which displays only those attributes that are associated with the longest case or occurrence durations.
You can switch to a list of all attributes, however. This list of all attributes can be useful if you already have an idea of an attribute you need to look into.
To view a list of all attributes of the process, click Browse All at the end of the list. The All Attributes list displays.
For example:
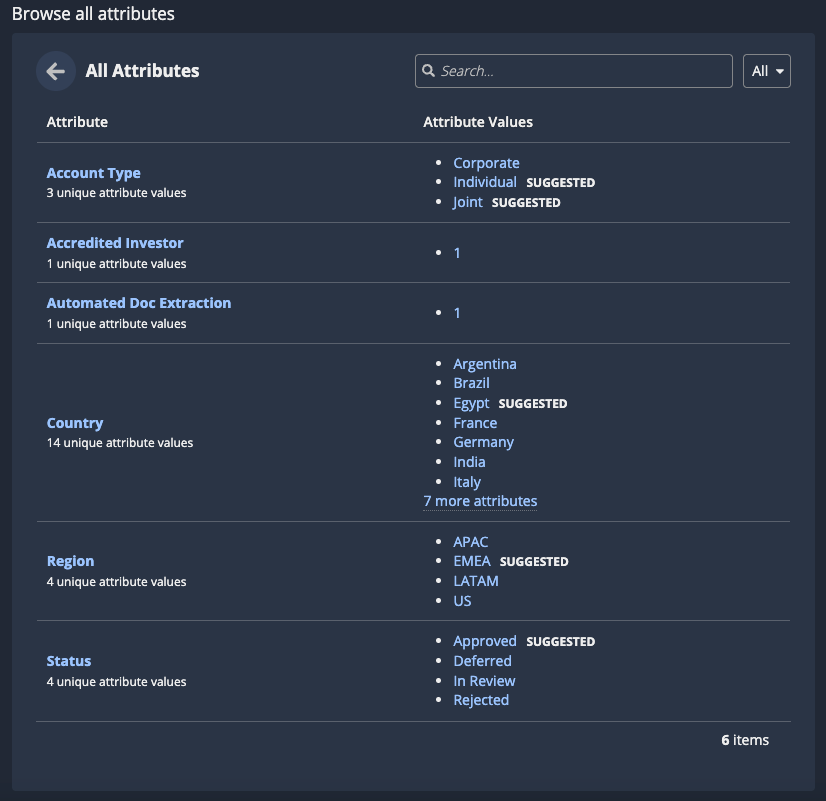
This table includes the following columns:
Column |
Description |
|---|---|
Attribute |
The name of the attribute, and a count of the unique values for that attribute. Click an attribute to view the Duration Comparison for the attribute's values. |
Attribute Values |
A list of values for that attribute in the cases in the investigation. The SUGGESTED tag displays next to attribute values associated with the longest case or occurrence durations. Click an attribute value to view the attribute value details. |
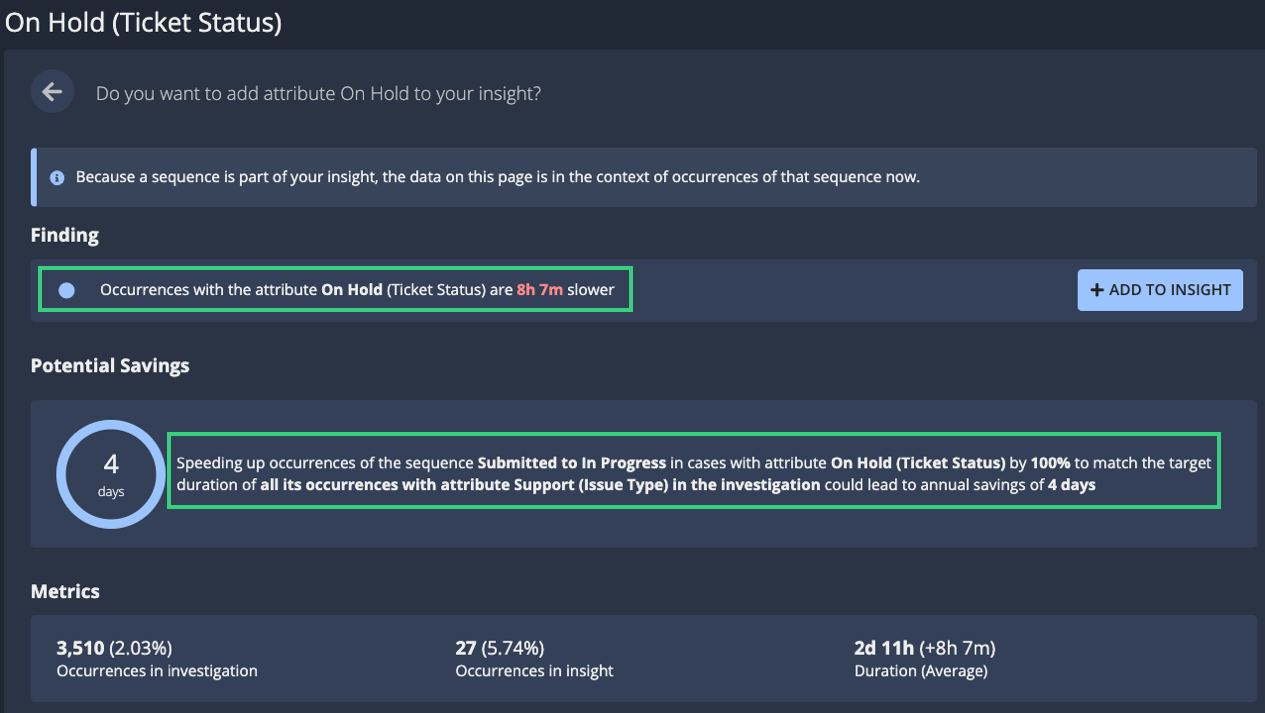
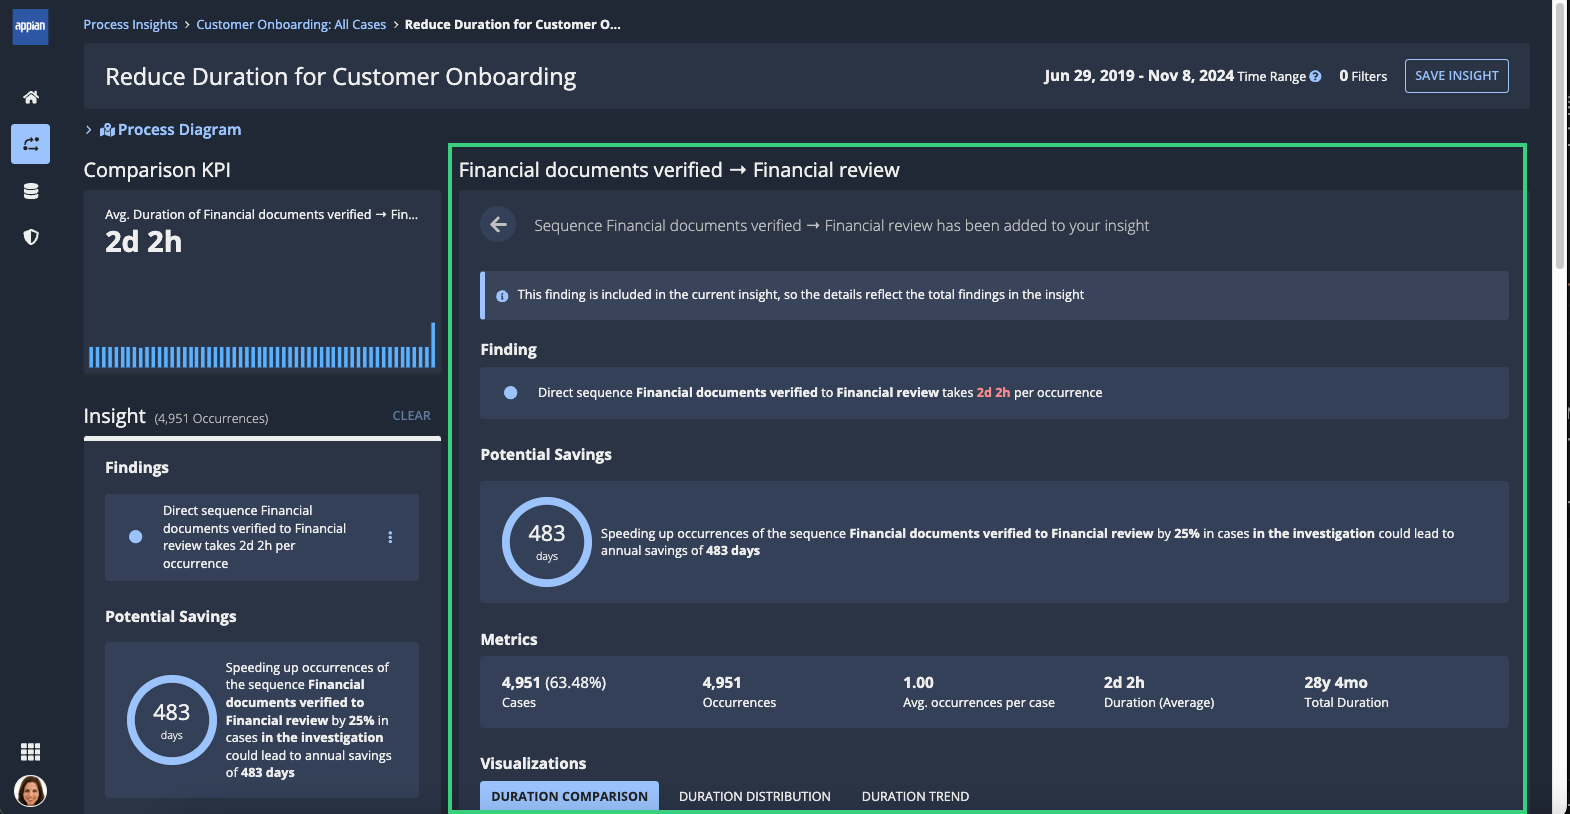
Attribute value detailsCopy link to clipboard
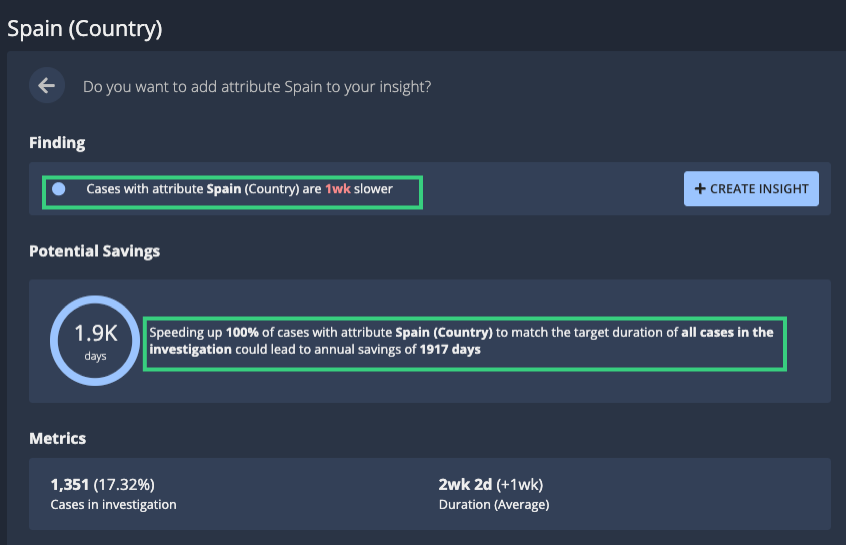
When you click on an attribute value in the attribute value list or all attributes list, the investigation displays a detailed analysis of that attribute value.
For example:
Attribute value details include the following elements:
-
Finding: A sentence describing Process HQ's analysis of the attribute value. The content of this finding depends on the type of investigation you're conducting:
Type
Description
Duration
How much slower cases or occurrences with the attribute value are than the average duration all cases or occurrences related to the KPI.
Occurrence
How many occurrences with the attribute value that you could reduce to improve cases related to the KPI.
Click ADD TO INSIGHT to look closer at other characteristics of cases with this attribute value or toshare this finding with others.
-
Potential Savings/Reduction: The potential improvement that Process HQ has calculated for cases or occurrences with the attribute, displayed as either potential savings or potential reduction depending on the investigation type.
-
Metrics: Relevant statistics for this attribute value:
Metric
Description
Duration Investigation
Cases/Occurrences in investigation
A two-part value specifying (1) the total number of cases or occurrences with this attribute value in the investigation, and (2) what percent of total cases or occurrences in the investigation is represented by cases or occurrences with this attribute.
Cases/Occurrences in insight
A two-part value specifying (1) the total number of cases or occurrences with this attribute value in the insight, and (2) what percent of total cases or occurrences in the insight is represented by cases or occurrences with this attribute.
Duration (Average)
The average duration of cases or occurrences with this attribute value in this investigation.
Occurrence Investigation
Activity/Sequence Occurrence Count
How many times the activity or sequence with the attribute value occurs in cases related or not related to the KPI or insight, as indicated in the section header. This field is only present if the comparison KPI counts occurrences of an activity or sequence.
Case Count
How many total cases are related or not related to the KPI or insight, as indicated in the section header.
Cases with <Attribute Value>
How many cases with the attribute value are related or not related to the KPI or insight, as indicated in the section header.
Percent with <Attribute Value>
The percent of total cases that are related or not related to the KPI or insight, as indicated in the section header. This field is only present if the comparison KPI counts cases with a specific attribute.
-
Visualizations: Charts displaying relevant statistics in relation to each other:
Investigation Type
Visualization
Duration
Occurrence
-
Cases: A list of cases with this attribute value in this investigation.
Process part detailsCopy link to clipboard
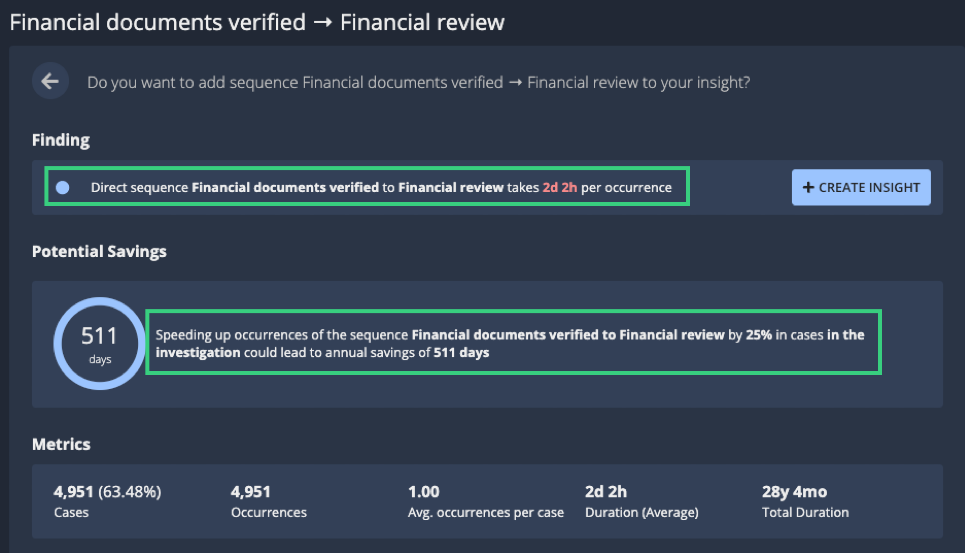
To view the details of Process HQ's analysis of each sequence, repetition, or activity, click that process part in the process diagram on the Summary tab of a view.
Note: These details are only available in duration investigations.
For example:
Process part details include the following elements:
-
Finding: A sentence describing how much slower activities or sequences with the attribute value are than activities or sequences without the attribute value. To share this finding with others, click ADD TO INSIGHT.
-
Potential Savings: The potential improvement that Process HQ has calculated for the process part, displayed as potential savings.
-
Metrics: Relevant statistics for this part of the process:
Metric
Description
Cases
The total number of cases that include this part, along with the percentage of cases in this investigation that those cases represent.
Occurrences
The total number of times the part occurs in the cases you're investigating.
Avg. Occurrences
The average number of times the part occurs in each case you're investigating.
Duration (Average)
The average duration of this part when it occurs in the cases you're investigating.
Total Duration
The total duration of all occurrences of this part in the cases you're investigating.
-
Visualizations: Charts displaying relevant statistics in relation to each other:
Investigation Type
Visualization
Duration
Occurrence
-
Cases: A list of cases in this investigation that include this process part.
CasesCopy link to clipboard
This list displays all cases with the selected attribute value or process part.
For example:
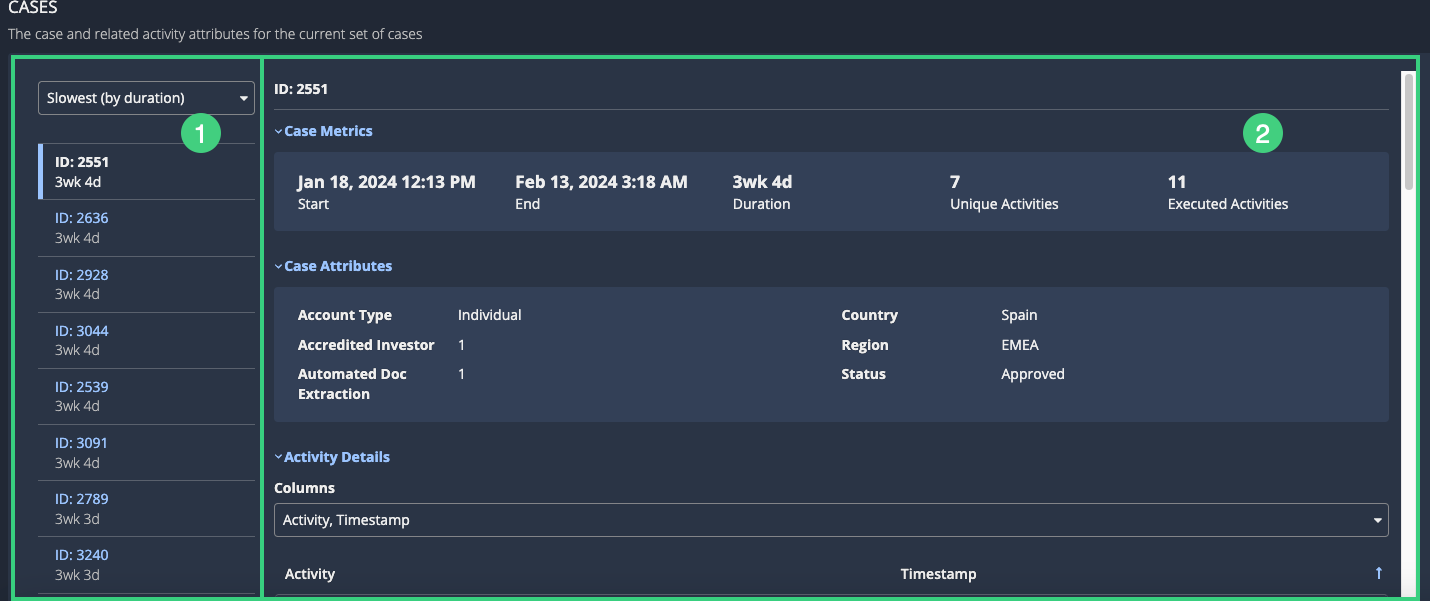
This section contains the following elements:
# |
Element |
Actions Available |
|---|---|---|
1 |
Case list |
|
2 |
Case details pane |
Review details about the selected case:
|
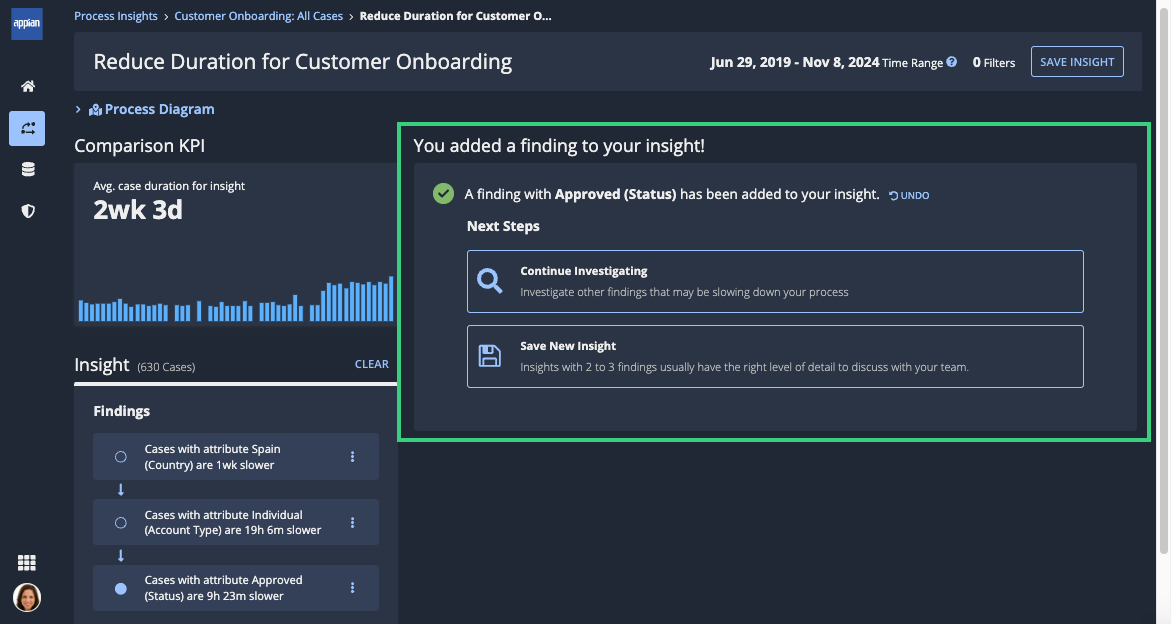
Next StepsCopy link to clipboard
As you add findings to your insight, you can use the steps below to continue your investigation:
Step |
Description |
|---|---|
Continue Investigating |
Click this step to review additional findings. |
Save New Insight |
Click this step to save the current findings as a new insight. Insights with 2 to 3 findings usually have the right level of detail to discuss with your team. |
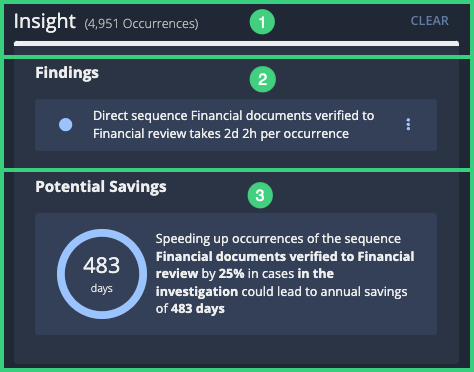
Insight paneCopy link to clipboard
As you add individual findings to an insight, the Insight pane displays those findings in a hierarchical format to represent the cumulative filtering of cases in the insight.
The following image highlights the elements of the Insight pane:
# |
Element |
Actions Available |
|---|---|---|
1 |
Header |
|
2 |
Findings section |
|
3 |
Potential Savings/Reduction section |
View the potential improvement that Process HQ has calculated for combined findings in this insight, displayed as either potential savings or potential reduction depending on the investigation type. |