| This content applies solely to Connected KYC, which must be purchased separately from the Appian base platform. This content was written for Appian 23.3 and may not reflect the interfaces or functionality of other Appian versions. |
IntroductionCopy link to clipboard
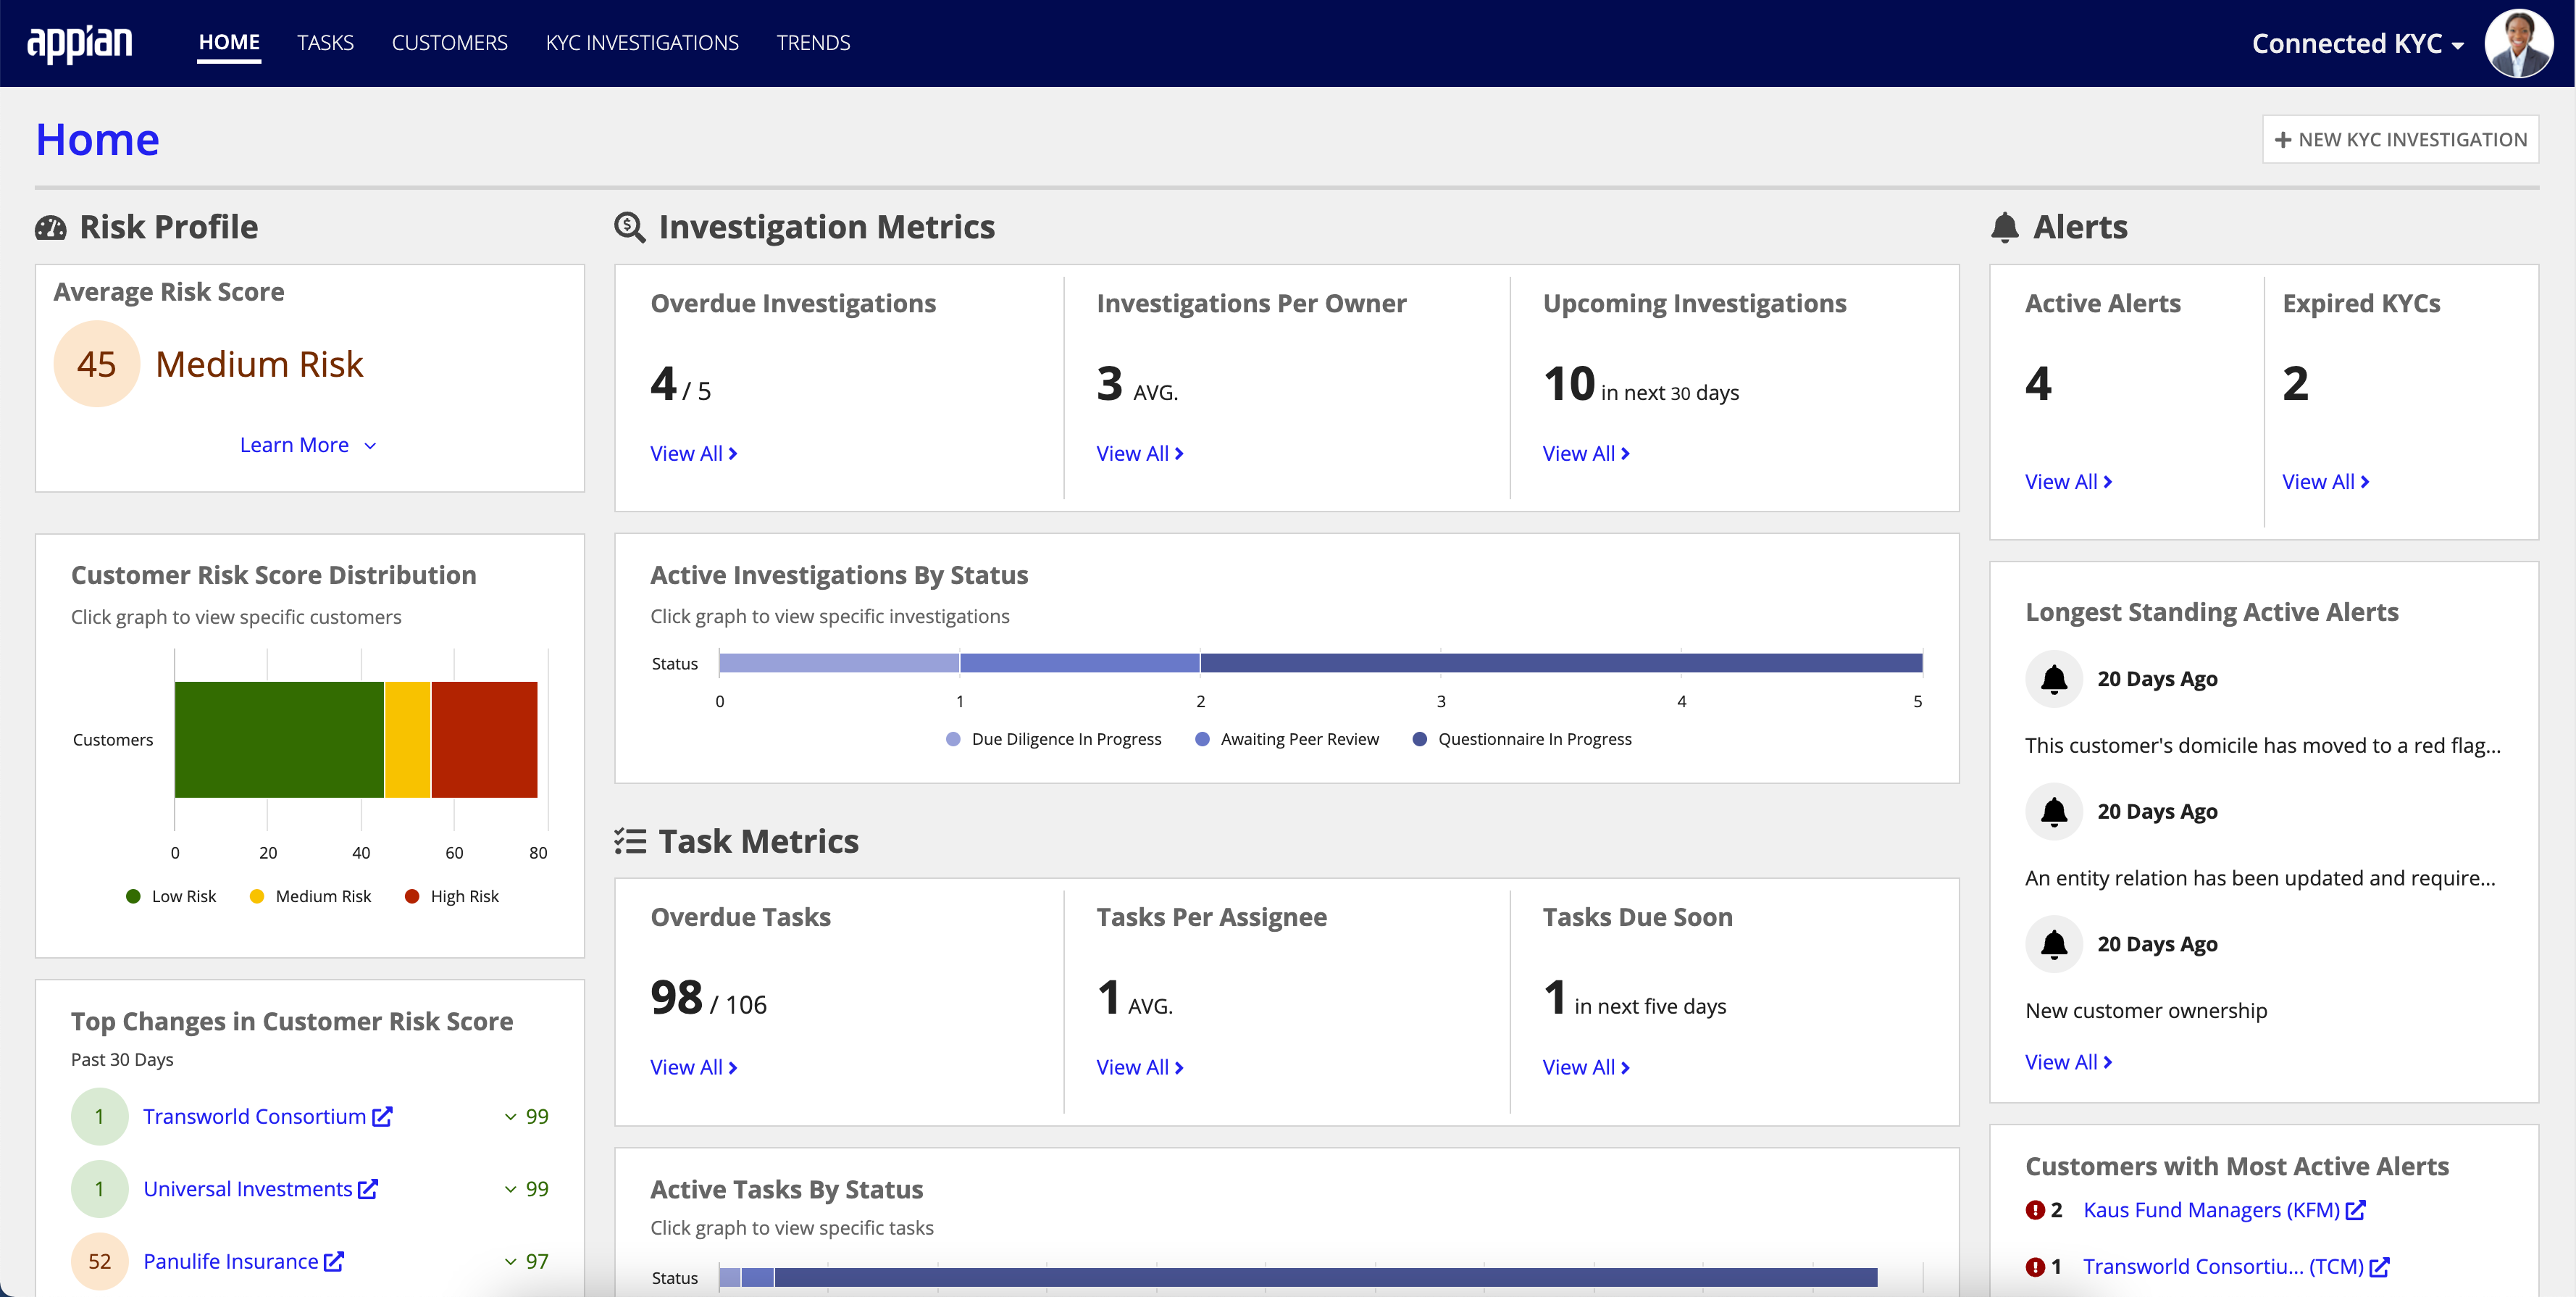
The Connected KYC Home page is the primary page to complete tasks and track Investigations. It is an invaluable tool to track Investigations at a high level and to identify issues.
Connected KYC offers two distinct views:
-
Manager View: Focuses on the overarching status of everything going on.
-
Case Worker View: Focuses on the individual's task and investigations.
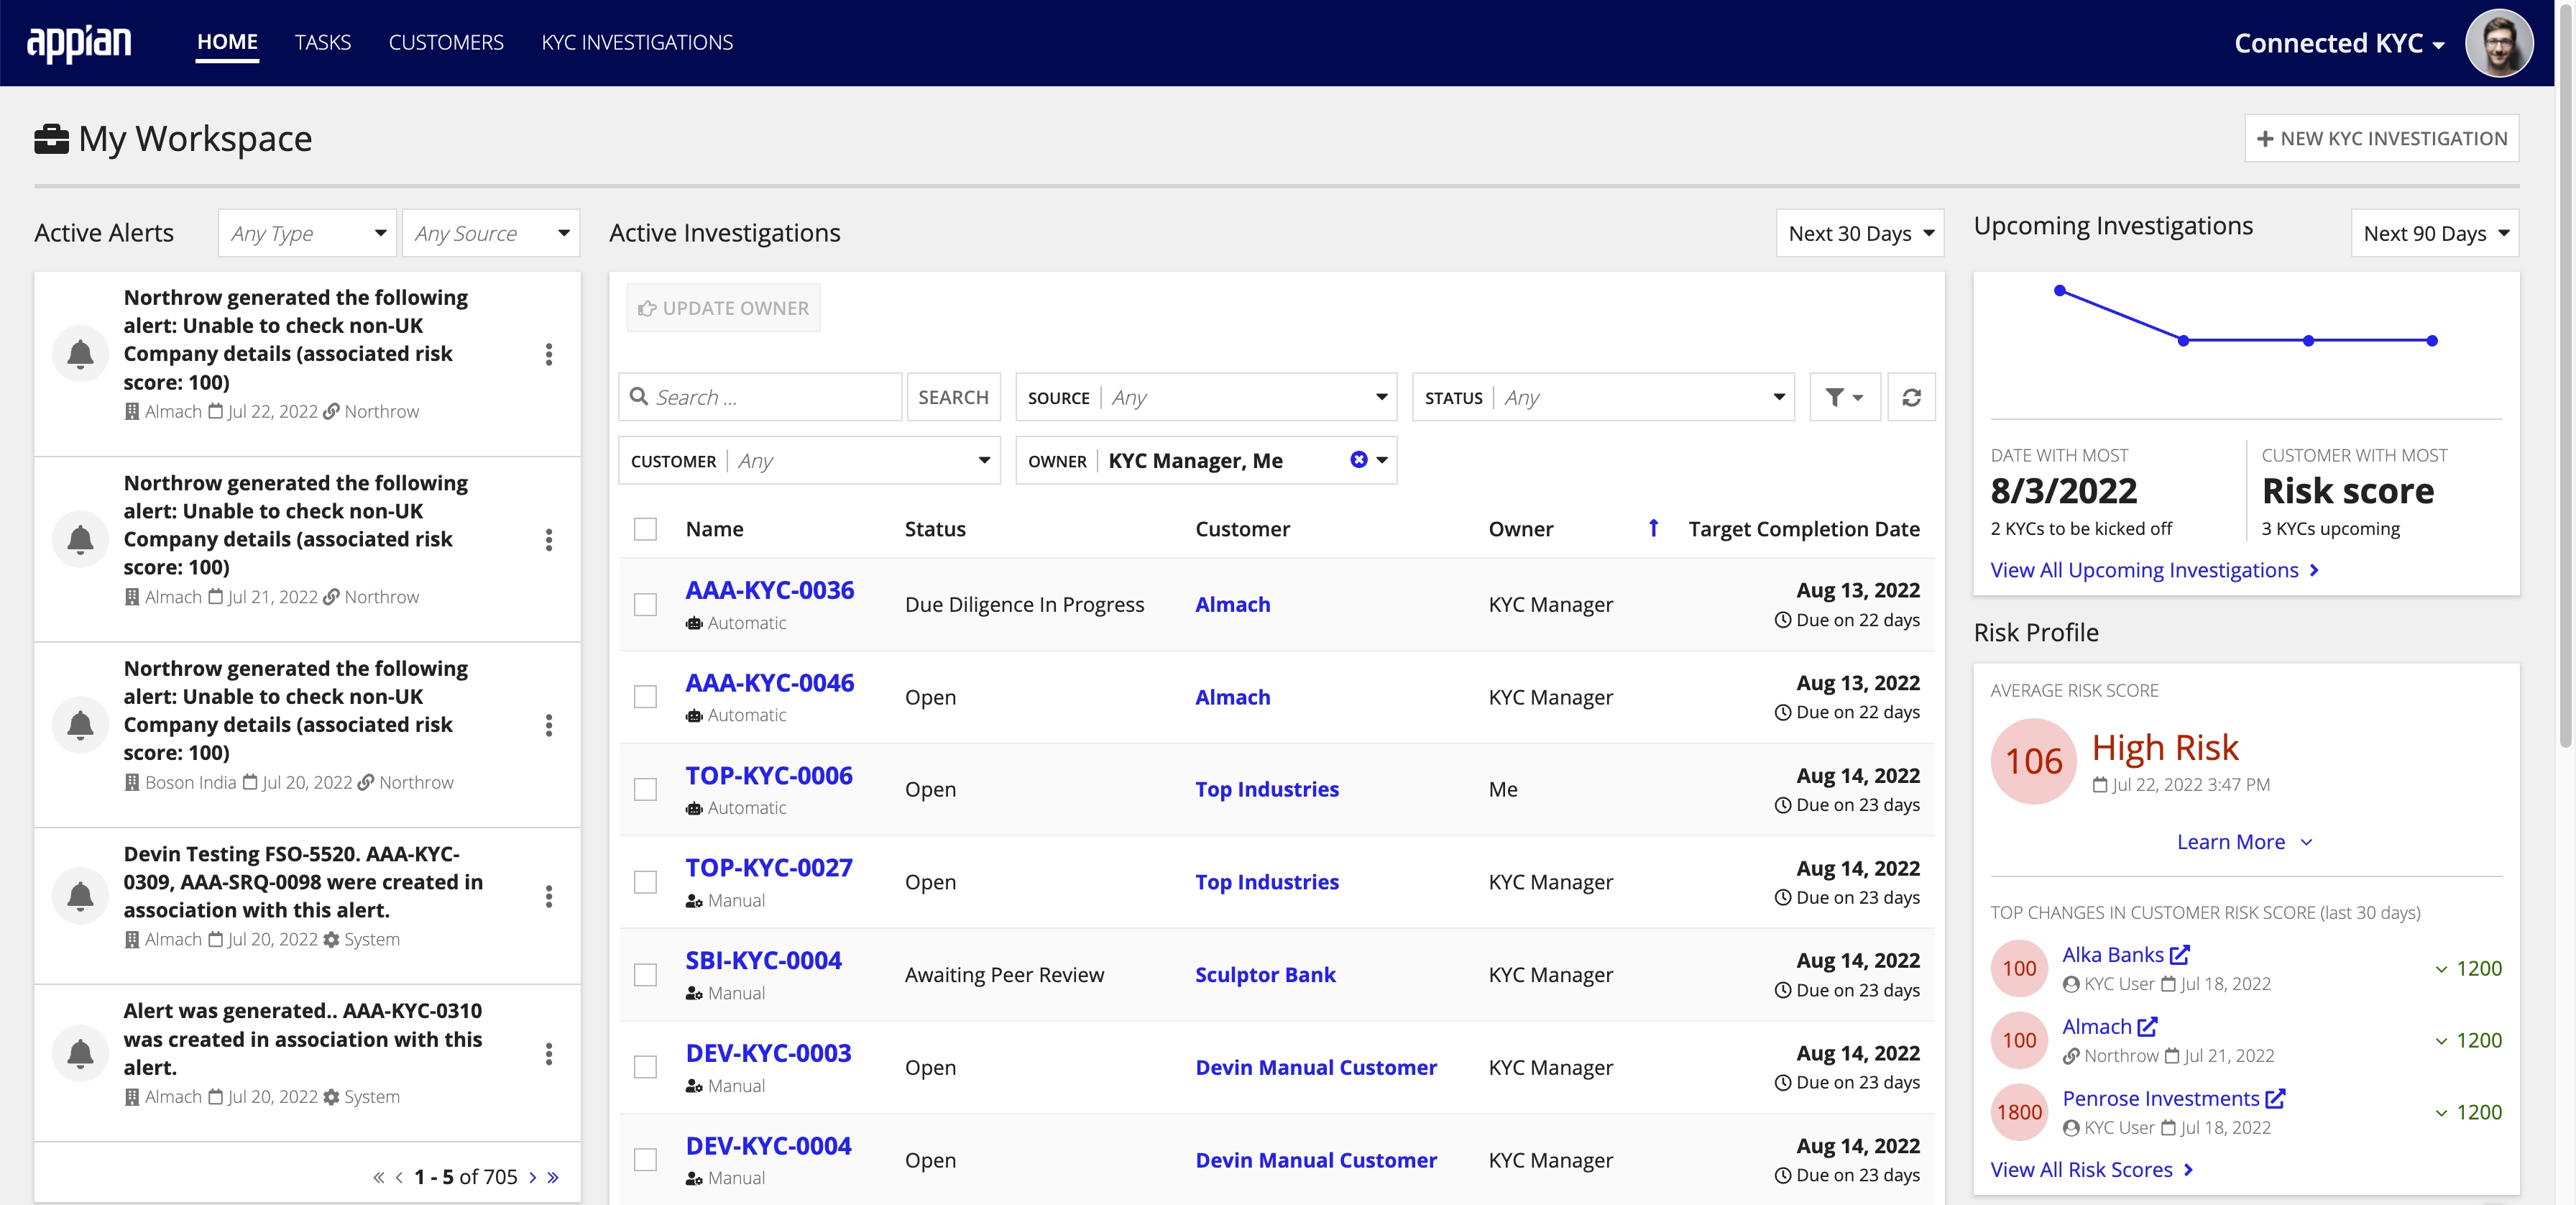
Each view has different metrics and data to help specific users manage their work.
Active AlertsCopy link to clipboard
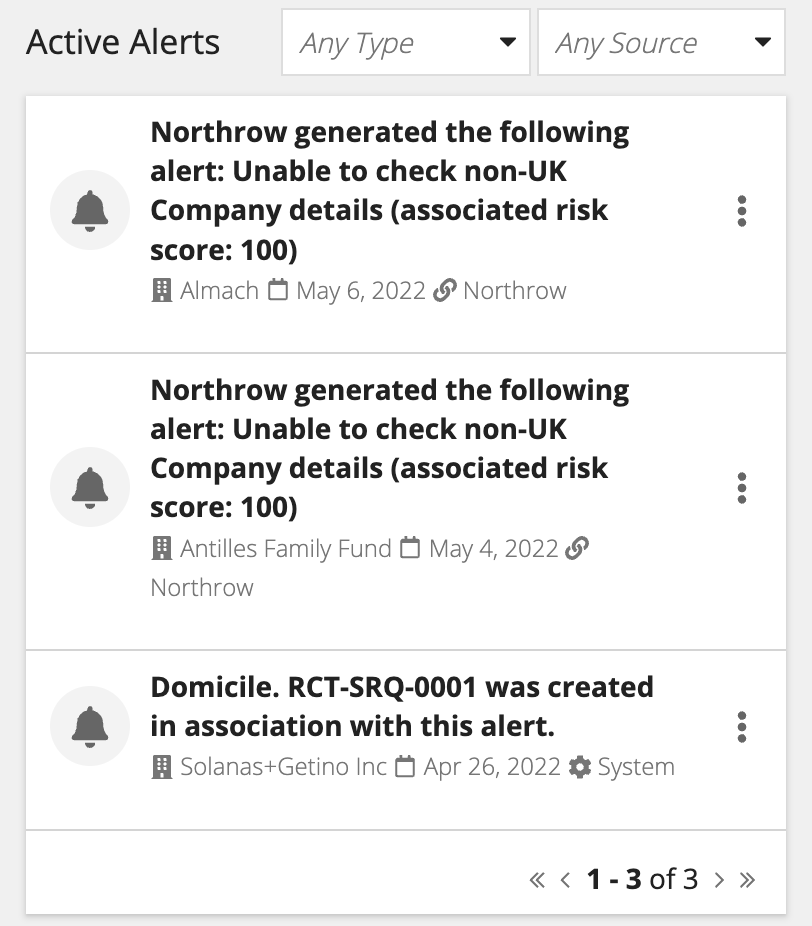
The Active Alerts section displays any alerts that are currently open for any customer. An alert shows information about when and why it was triggered. The user can dismiss the alert from this page. For more information about configuring alert conditions, see Configure Alerts.
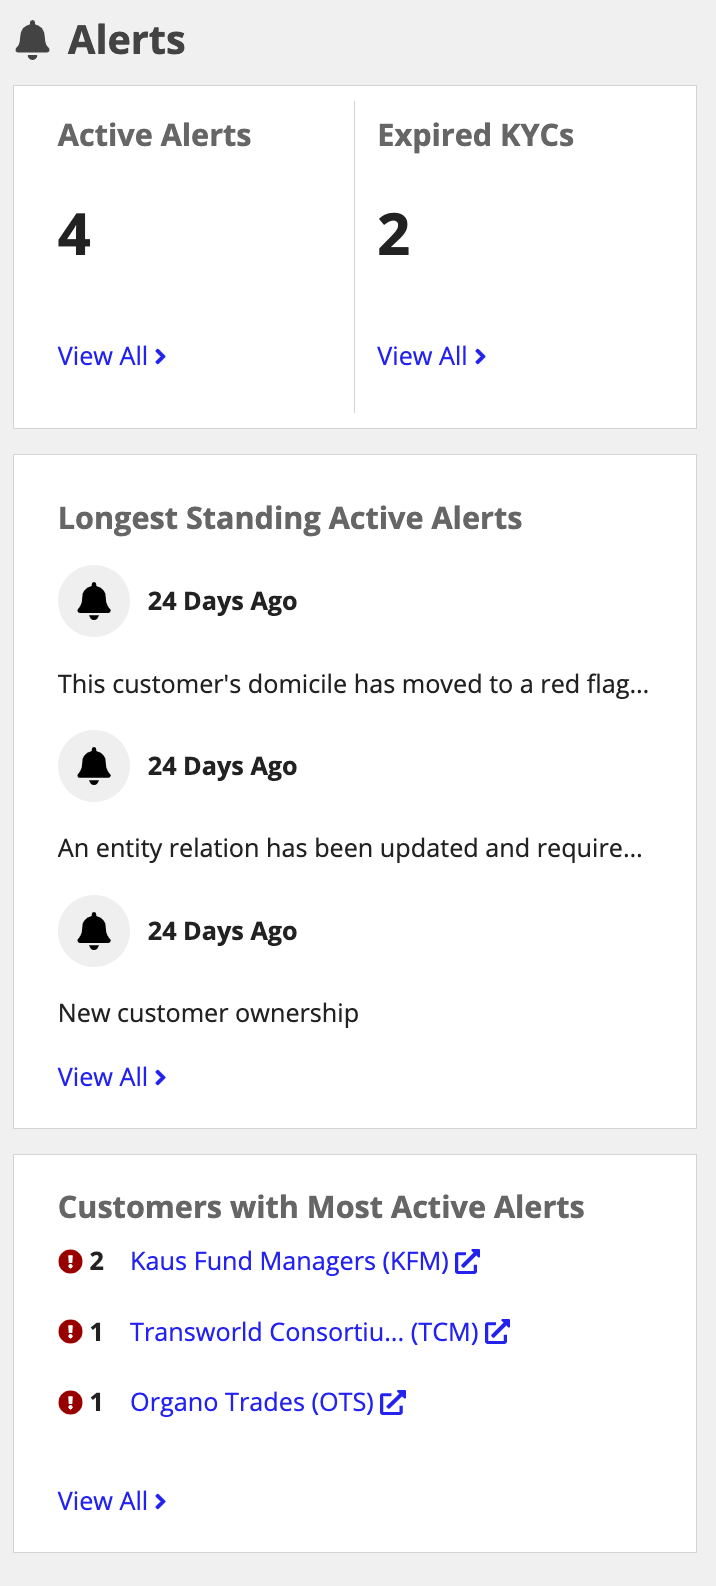
To better understand alert status, the Alerts section provides KYC managers with a. high-level view of outstanding alerts..
Active InvestigationsCopy link to clipboard
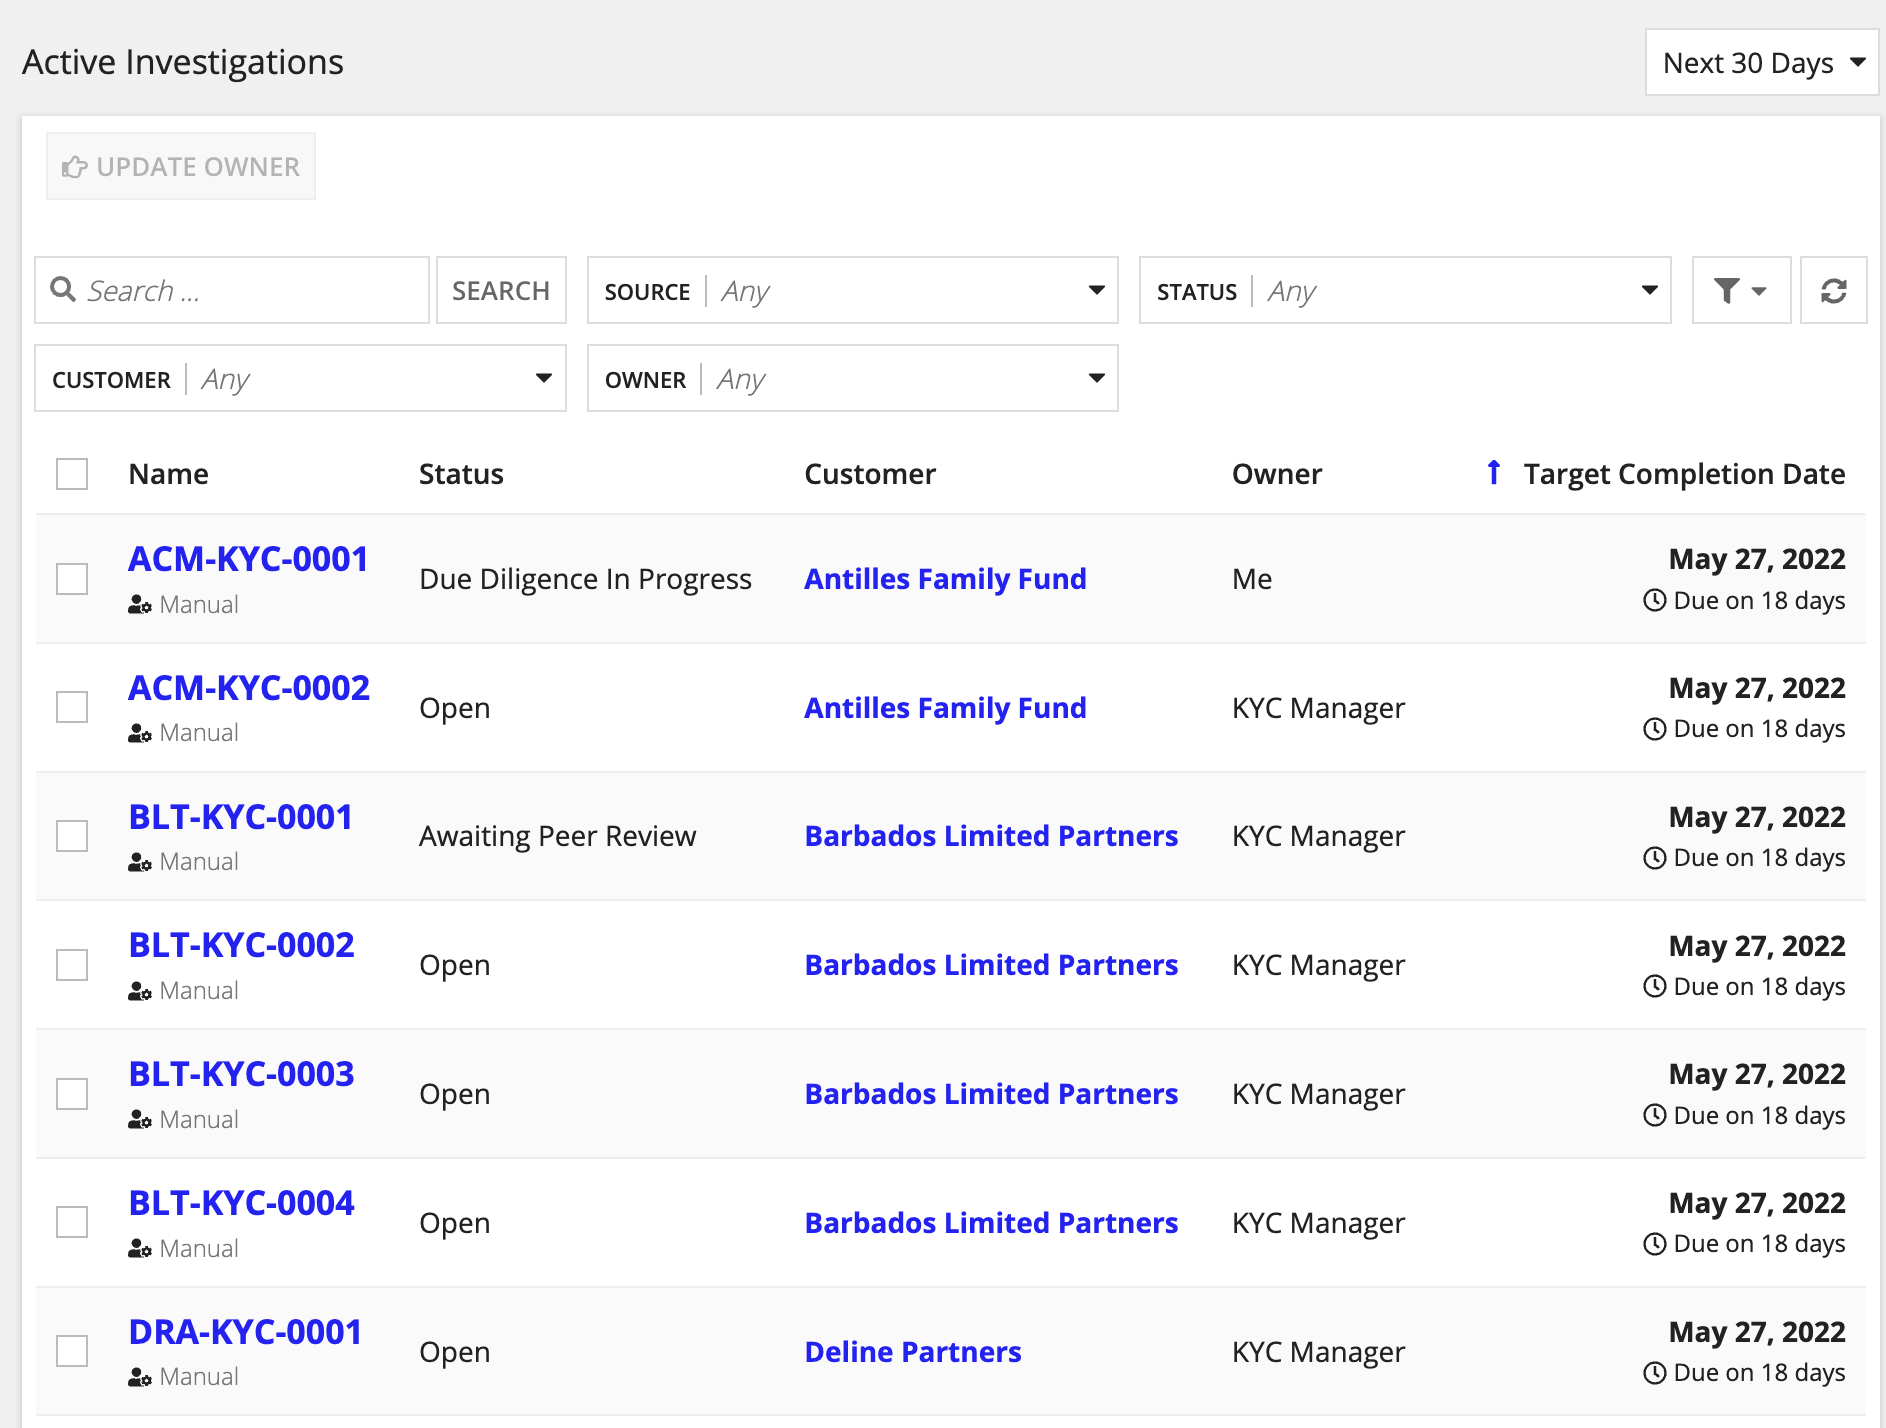
The central portion of the home page displays the Active Investigations grid which initially will filter to active Investigations assigned to the logged-in user.
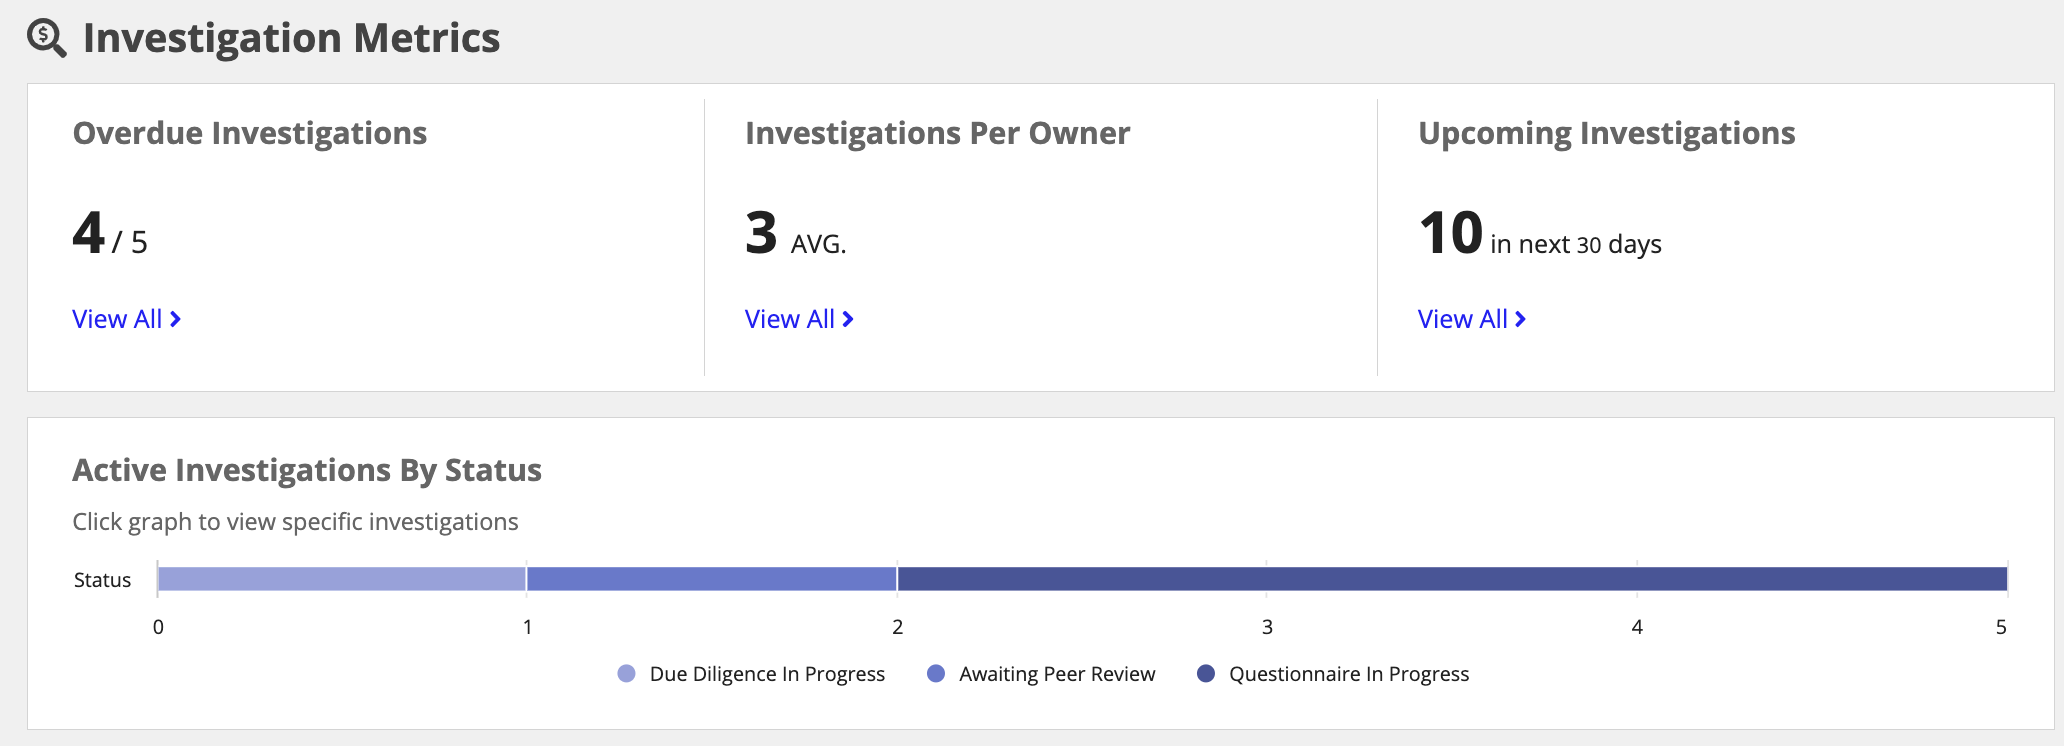
The Investigation Metrics chart provides KYC managers with an overview , which allows them properly manage their investigation workload and address any issues.
Clicking an Investigation name opens the Investigation summary page.
Active TasksCopy link to clipboard
The Active Tasks section displays all tasks that are either assigned directly to the user or to a group they are a member of. The task name, task type, due date, and Investigation link are displayed to the user.
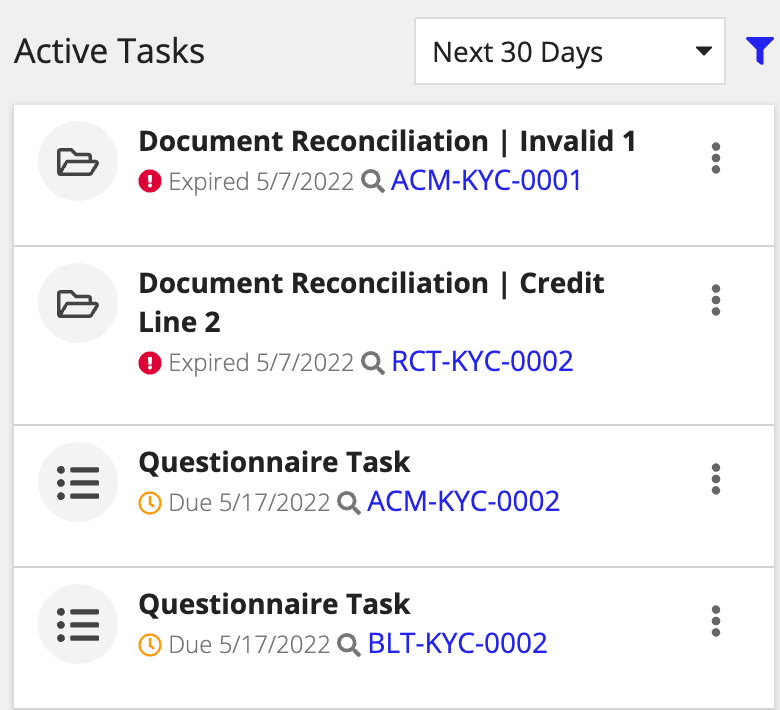
Tasks due in the Next 30 Days are shown by default. To filter the tasks further, click the filter icon.

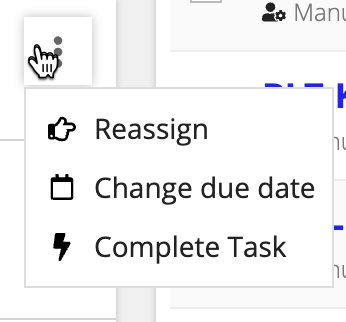
The user can complete, reassign or change the due date by clicking on the menu bar icon next to each task.
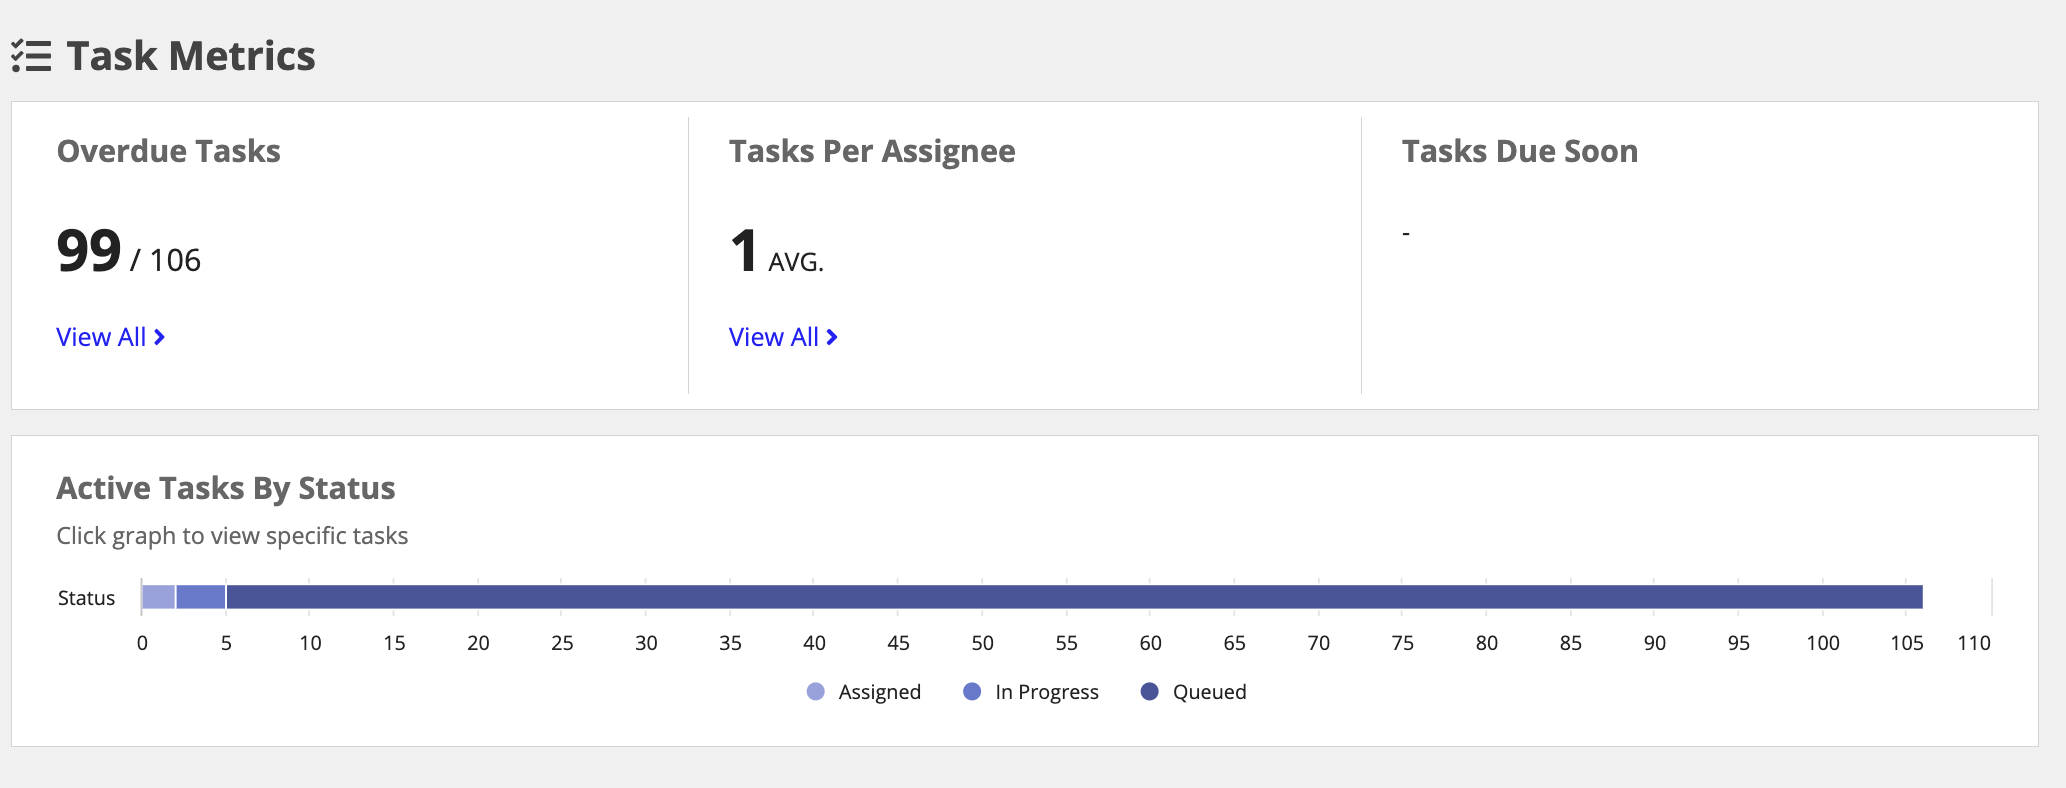
KYC managers will have an overview of the Task Metrics to be able to properly manage workload and see any issues arise. This overview summarizes key metrics associated to Investigation tasks, providing a high-level insight into task-related activity. The data can be drilled into by clicking View All or a piece of data within a chart.
Risk ProfileCopy link to clipboard
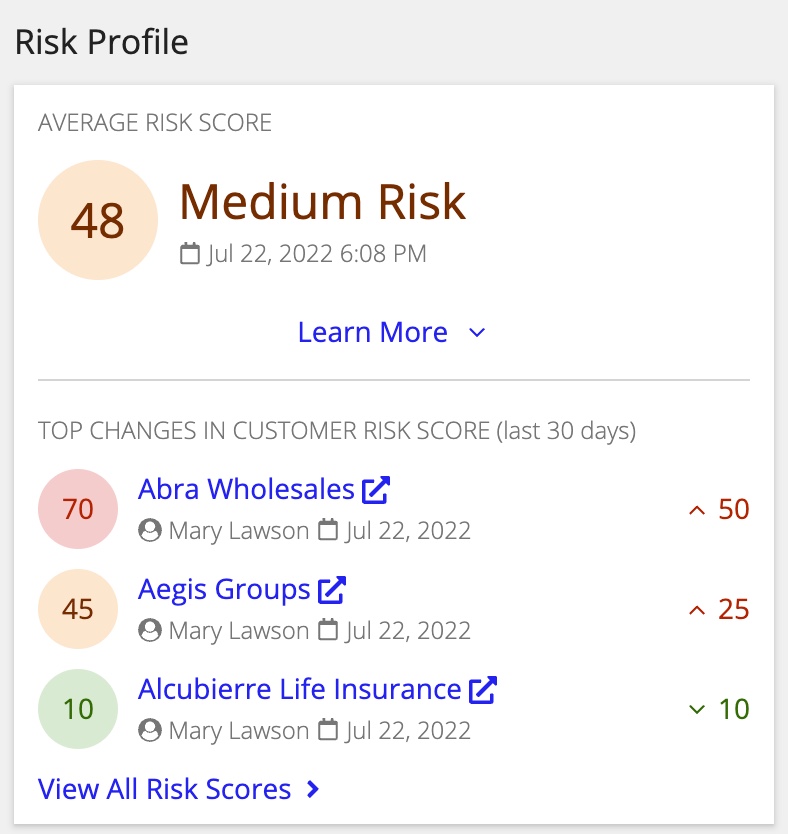
The Risk Profile section of the home page shows users the average risk score across their customers, and the top three customers with the highest risk score change. This provides the KYC group insight into the changing risk levels across the organization.
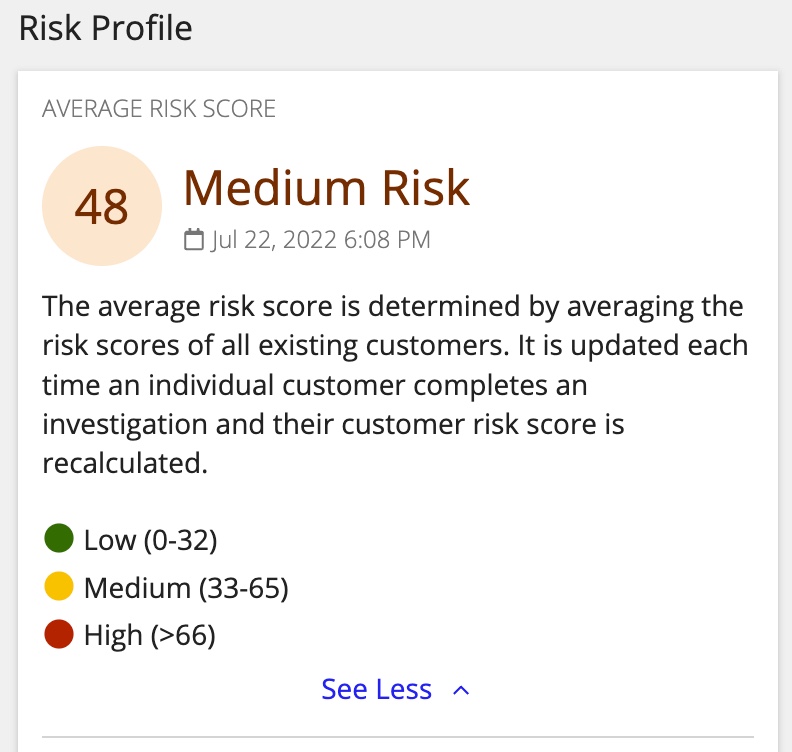
Click Learn More to discover what risk score indicates.
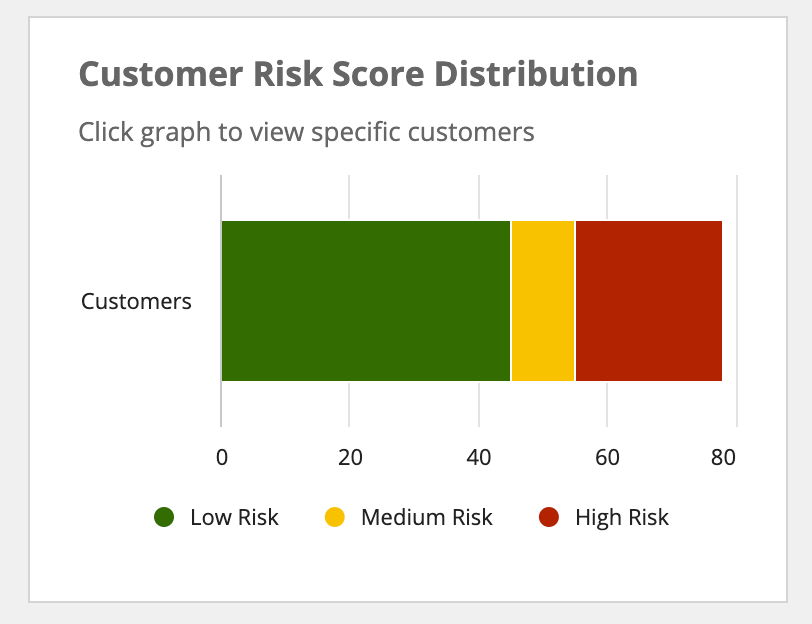
Managers will also have access to an overall Customer Risk Distribution chart to quickly monitor risk scores across all customers, and how the risk score has fluctuated over time. This chart helps to show how Investigations activities have impacted inherent risk for an organization.
To view all customer risk scores, click View All Risk Scores.

OwnersCopy link to clipboard
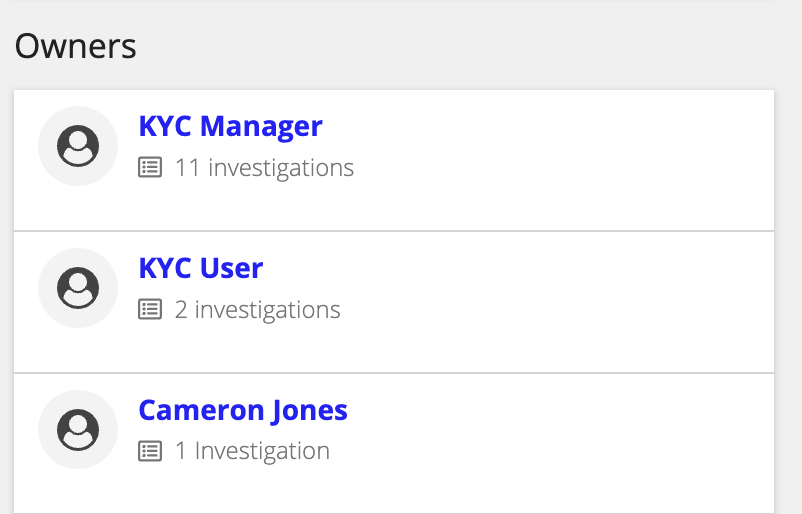
The Owners section of the home page shows users the number of investigations per owner to balance workload appropriately.
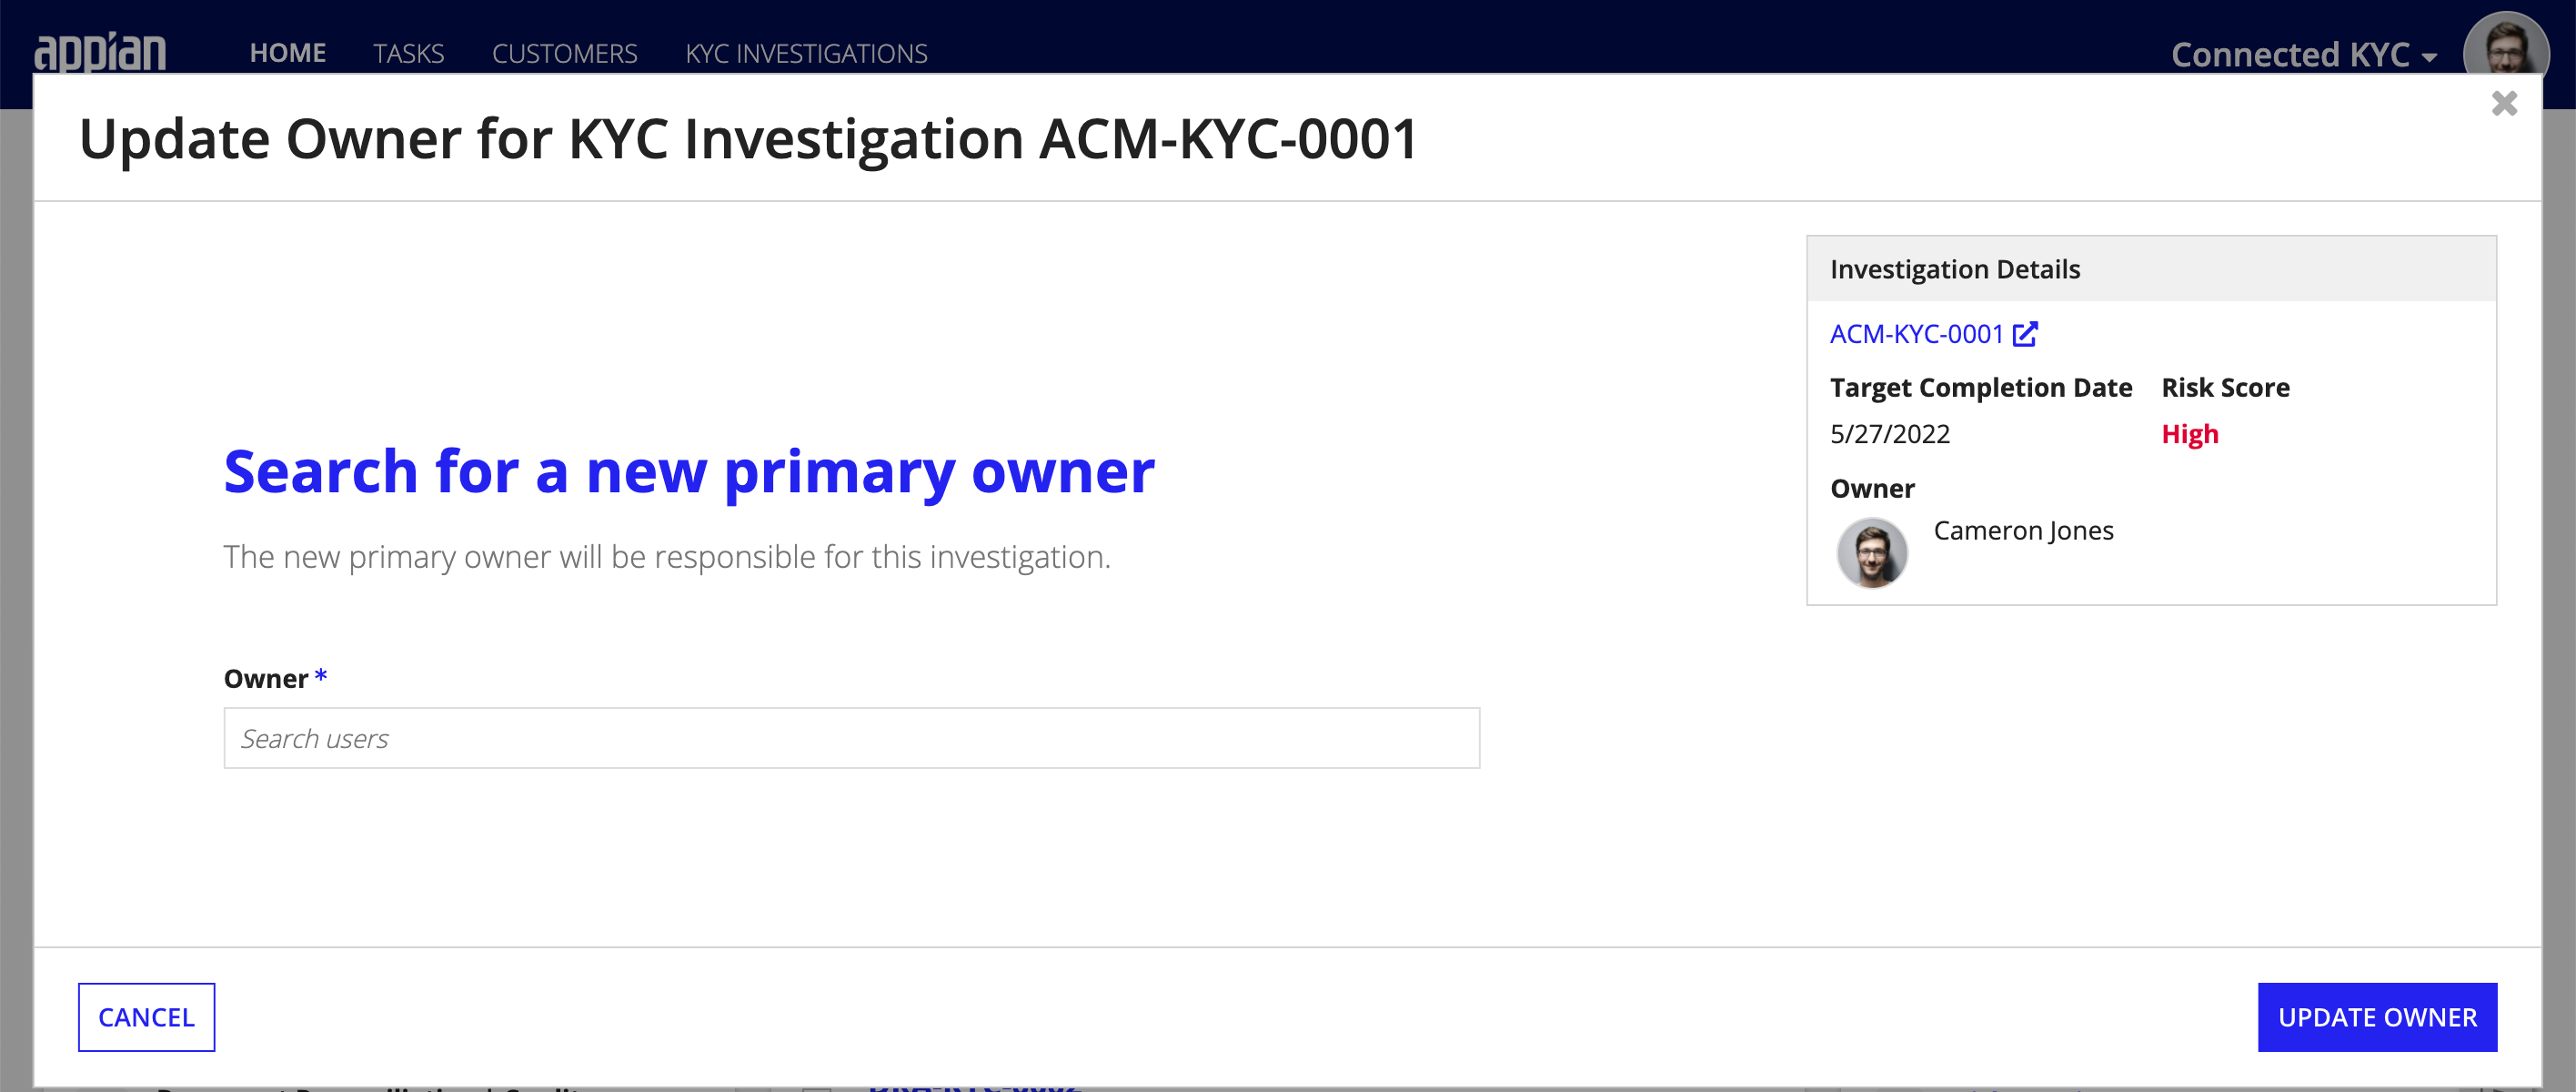
To reassign KYC investigations:
- From the Active Investigation grid, click UPDATE OWNER.
- Search for a new primary owner.
- Click UPDATE OWNER.
Create a New InvestigationCopy link to clipboard
You can start a new Investigation directly from the homepage.
To begin a new KYC, click + NEW KYC INVESTIGATION and follow the Create a New Investigation steps.

