
| The capabilities described on this page are included in Appian's standard capability tier. Usage limits may apply. |
OverviewCopy link to clipboard
When a user encounters an error in a portal, there are various options for you to identify and troubleshoot the issue. You can also monitor how your portals are performing when users interact with them.
This page details the various options you have for identifying issues in a portal and troubleshooting them, as well as some common errors in portals and how to resolve them.
Identifying issues in a portalCopy link to clipboard
There are several places to help you identify and troubleshoot issues with a portal. The following grid details the types of troubleshooting information that are available and their locations.
| Name | Location | Description |
|---|---|---|
| Email error alerts | An email that is automatically sent to administrators of a portal object when a user encounters an error in a portal. | |
| Portal Errors grid |
|
Grid that displays errors that users have encountered on a portal. |
| Portal Error Log |
|
Log file that displays error messages that users have encountered on a portal. |
| Portal Server Log |
|
Log file that displays system-level log entries for the microservice that runs the portals in an environment. |
| Latency, traffic, and error rate metrics |
|
Latency, traffic, and error rate metrics for each portal in the environment and any connected environments. |
*Certain environments don't have a Troubleshoot tab. See Environment support for enhanced portal logs for more information.
The following sections go into more detail about this and other troubleshooting information that is available for portals.
Environment support for enhanced portal logsCopy link to clipboard
In certain Appian Cloud environments, enhanced portal logs aren't available.
In these environments:
- Email error alerts will not be sent.
- The Troubleshoot tab doesn't display. Instead, at the bottom of the portal object a Resources section provides access to the Portal Monitoring view and the Portal Server Log.
- On the Portal Monitoring tab in the Monitor view, the number in the Error Count column will not be clickable to open the Portal Errors grid or download the Portal Error Log.
If these capabilities aren't available in your environment, use the Portal Server Log to help troubleshoot portals.
Email error alertsCopy link to clipboard
When a user encounters an error in a portal, an email alert will be automatically sent to the administrators of the portal object with details about the error.
In order to access the portal object from the link in the email, you must have the Designer user role assigned, which gives access to Appian Designer. If your environment has enhanced portal logs and connected environments, you can still view the error details from an environment you have access to in the Portal Monitoring tab. See Viewing metrics and errors in connected environments for more information.
Only one email will be sent per error message every hour. To see all the instances of an error, check the Portal Errors grid.
To receive email error alerts for a portal, make sure:
- Outbound emails are turned on for the environment.
- You have Administrator permissions to the portal object in that environment.
Portal Errors gridCopy link to clipboard
The Portal Errors grid displays up to 50 of the most recent error messages that users have encountered on a published portal. It can display errors from the last 90 days.
There are two ways to access the Portal Errors grid:
- From a portal, go to the Troubleshoot tab.
- From the Portal Monitoring tab in the Monitor view, click on a number in the Error Count column.
- To view the error grid for portals in connected environments, you can use the icon to switch between environments.
Portal Error LogCopy link to clipboard
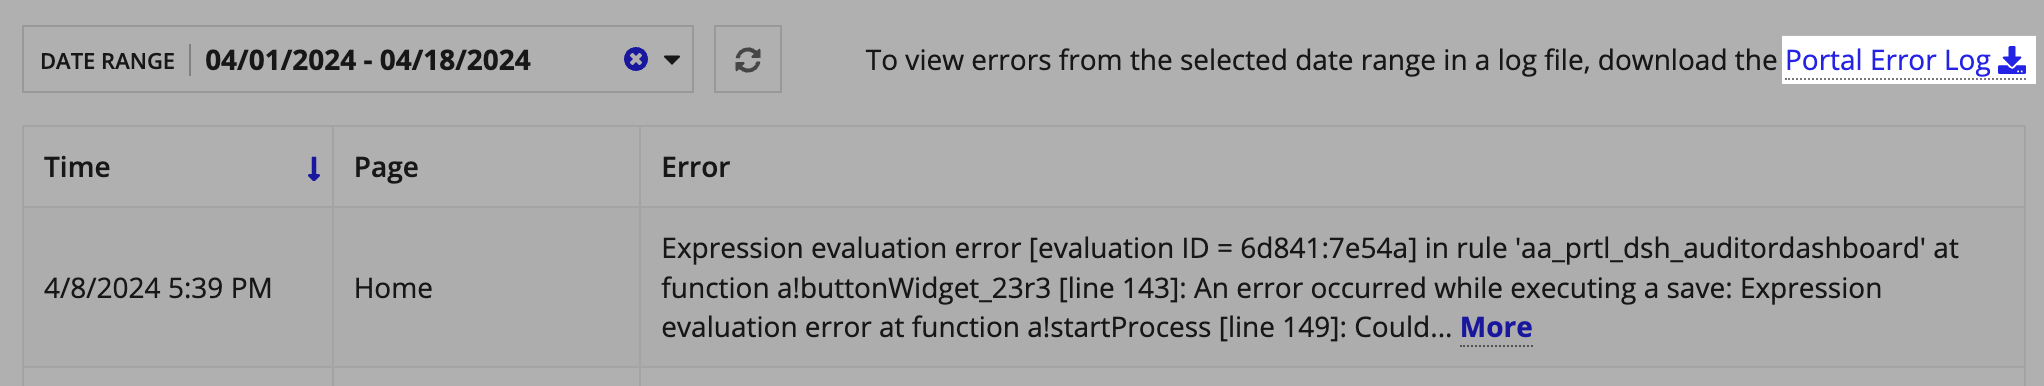
To view more than 50 errors for a selected date range, or to search, sort, and filter them, download the Portal Error Log, which can be accessed above the Portal Errors grid. This error log can display errors from the last 90 days.
To download the Portal Error Log:
- Access the Portal Errors grid.
- From the portal object, go to the Troubleshoot tab.
- From Appian Designer, go to the Monitor view and click Portal Monitoring.
- Select a DATE RANGE that you want to download error details for. Error details are only available for the last 90 days.
- Click the Portal Error Log link to download the error details for the selected date range.
Portal Server LogCopy link to clipboard
If enhanced portal logs aren't available in your environment, or to view more details about the activity on the published portal, check the Portal Server Log.
This log file contains system-level log entries for the microservice that runs a portal. These logs can provide insights about user activity and errors that users might be encountering when they interact with a portal.
The Portal Server Log does not include every error related to a portal or the objects and connections it uses. See Other logs for other places to check for troubleshooting information.
Note: In environments that don't support enhanced portal logs, the Troubleshoot tab doesn't display. Instead, access the Portal Server Log from the Resources section at the bottom of the portal object.
To download a Portal Server Log:
- In a portal object, go to the Troubleshoot tab.
- In the View System Activity section, select a Time Range that you want to view log entries from. You can choose to view log entries from the last 15 minutes, hour, day, or week.
- (Optional) To reduce the log file download time, select Limit to 1000 entries to see only the last 1000 log entries.
- Click Download the Portal Server Log to download the log entries for the selected time range.
Latency, traffic, and error rate metricsCopy link to clipboard
The Portal Monitoring tab of the Monitor view allows you to view key metrics and details that can help you understand how users are interacting with your portals and whether they are experiencing issues. Regularly monitoring these metrics alerts you to any potential issues related to portal performance and availability. For more information, see Latency, traffic, and error rate metrics explained.
See Troubleshooting errors and Troubleshooting latency issues for details about how to troubleshoot errors and latency issues.
Viewing metrics and errors in connected environmentsCopy link to clipboard
If you have connected environments set up, you can switch between them to view the following for each environment:
This can be especially helpful to view metrics and errors for portals in a production environment without requiring Designer access to the environment.
You must have at least Viewer permissions to portals in the current environment in order to view their metrics from another environment.
To view metrics and error details for other connected environments:
- In the Portal Monitoring tab of the Monitor view, click the icon.
- Select an environment and click VIEW PORTAL MONITORING to view the metrics for that environment.
- If there is a number in the Error Count column, click it to open the Portal Errors grid, where you can also download the Portal Error Log.
Other logsCopy link to clipboard
You can find more information for portal processes, performance, and activities in the following logs:
- To help troubleshoot errors that deal with connecting back to Appian, integrations, databases, or APIs, download the application server log for an environment.
- To help troubleshoot latency issues, download the Portals rule performance details log (available in Appian Cloud environments where enhanced portal logs are available).
- To help troubleshoot errors with external systems or databases, view the server logs for the system or database.
Troubleshooting errorsCopy link to clipboard
When troubleshooting errors, start by looking at the error message to see what may be causing the error. From there, you can determine the best place to look for more information. The following is a high level overview of the steps you can take to troubleshoot errors in a portal.
- To determine which object is affected and what the issue is, view the error details in the email alert.
- To help identify how often the error has occurred, as well as other errors that may be related, click VIEW THE PORTAL OBJECT in the email to open the portal object. Go to the Troubleshoot tab to view the the Errors grid.
- To search, filter, and sort the error details, or to view more than 50 errors for a selected time period, download the Portal Error Log.
- For a more comprehensive log file that may highlight issues that affect objects besides interfaces and expression rules, such as connected systems, download the Portal Server log from the Troubleshoot tab of the portal object.
- If the error is about connecting back to Appian, integrations, databases, or APIs, check out the application server log for your environment.
- If the error is for external system or databases, view the external server logs for the system or database.
- To view the error rate and error count for a portal, go to the the Portal Monitoring tab in the Monitor view.
In environments that support enhanced portal logs, if you have connected environments set up, you can view error details for portals in other environments by switching between environments using the icon. This is especially helpful to view errors for portals in a production environment without requiring designer access to the environment.
Troubleshooting latency issuesCopy link to clipboard
The speed with which the server responds to a traffic request depends on a variety of factors. When issues arise, it may not always be clear what's causing the problem.
Design issues in an interface or slow rule evaluations could be to blame when your users are subjected to longer than normal response times when interacting with your portals.
If you identify latency issues in the Portal Monitoring tab, download the portals rule performance details log to help troubleshoot. This log captures the performance details for every rule and interface within any published portal in an environment.
Common errorsCopy link to clipboard
Tip: The error messages on this page are examples. Your actual error message may be different.
| Error Message | Cause/Next Steps |
|---|---|
| [title=Connection failed, message=Could not authenticate with the connected system or connect to the external system at the specified URL, detail=HTTP/1.1 404 Not Found] For integrations that don't use connected systems: [title=The requested URL cannot be found, message=The external system did not find the requested URL or is refusing to allow access, detail=HTTP/1.1 404 Not Found] More information about this error can be found in the Portal Server Log which you can download from the portal object. There are two different ways to view this error: - If the integration queries info (GET), then the error will be available in the error field of the dictionary returned. - If the integration modifies data (POST), then the error can be accessed by fv!error in the onError parameter of the integration rule. |
Cause: Incorrect API key or credentials in the connected system, or invalid URL for web API. Next Steps: 1. If you're in a development environment, check your connected system to make sure your credentials are correct by clicking the TEST CONNECTION button in the connected system object. If you're in a staging or production environment, make sure that the credentials or API keys listed in the import customization file that you used for deployment are correct and have permission to your Appian web API. 2. Ensure that the integration used by your interface can connect to the Appian web API. |
| File upload authentication failed. No service account was found. A service account is required to upload files. | Cause: Missing or incorrect service account for file upload. Next Steps: Check that the service account used when publishing your portal has permission to upload documents to the target document folder. |
| Expression evaluation error at function a!queryEntity [line 21]: Connection to the data store entity failed. The connected system data source was not found at the specified URL or is refusing to allow access. | Cause: Scenarios such as invalid database/data store entity, wrong credentials in the import customization file, or data store entity not verified. Next Steps: 1. Check that the data source is configured correctly and can be connected to from the interface. 2. If you're in a development environment, check your objects to make sure that they are using the correct credentials or API keys. If you're in a staging or production environment, make sure that the credentials or API keys listed in the import customization file that you used for deployment are correct and able to authenticate to the data source connected system. |
| Varies based on function or component used. Example: Expression evaluation error at function a!userRecordLink: Invalid function a!recordlink (not available as []) |
Cause: The parent interface or child objects use incompatible functions or components. Next Steps: Ensure all functions and components used in the interface are compatible with Appian Portals and that partially compatible functions are connected using an integration and web API. |
| HTTP Code: 404 Could not find portal interface with uuid: _a-0000e827-7a29-8000-9bd3-011c48011c48_11234 | Cause: A precedent of the portal has been deleted or is missing from this environment. All interface precedents must be included in the environment that is being used to publish the portal. Next Steps: Ensure there are no missing precedents of the portal in the current environment. |
| Varies depending on error from Google. Example: reCAPTCHA connection failed. Check that proper credentials have been provided in the reCAPTCHA connected system and test the connection. |
Cause: Issue with reCAPTCHA. Next Steps: See Testing, monitoring, and troubleshooting reCAPTCHA for more information. 1. Ensure that the reCAPTCHA Site key, API key, and Project ID are correct in the portal object. 2. Ensure that your Google project is set up correctly to use reCAPTCHA. |