Note: Use the Analyze option on the Health tab in MyAppian to access the most complete Health Check analysis data.
Health Check provides insights into application design patterns and performance risks in your environment. The results are summarized in a report (.xls) that covers the following four areas of your environment:
Each Health Check report includes:
To easily manage the results of your Health Check reports and track historical risk trends overtime, see MyAppian.
Each Health Check report is a spreadsheet that consists of four sheets titled Summary, Details, Dashboard, and Process Sizing.
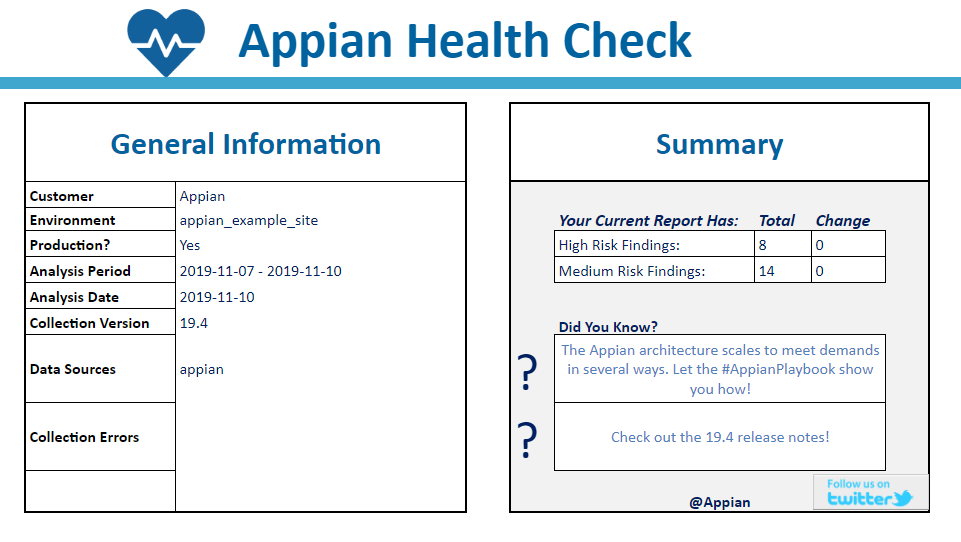
The Summary sheet provides you with a brief overview about the individual Health Check run. It highlights the total number of high and medium risk findings identified for your environment, and whether there has been any overall change in risk since your last Health Check report. For easy reference, the Summary sheet also includes the relevant environment name, the date the report was generated, and the analysis period (the period of time covered by the report).
If any errors occur during data collection, they will be listed on the Summary sheet. Collection errors are usually caused by unexpected data or configurations.They don’t cause the overall data collection to fail, but they could potentially reduce the scope and accuracy of a report.
The Details sheet provides you with a list of the different design, configuration, and user experience risks that Health Check has identified in your environment. Each row contains a risk identifier and category, a short description of the risk, a risk level (high, medium, or low), and a detailed breakdown of the objects and applications prone to the risk. For many risks, the report also links to documentation to help you better understand the risk and make changes to mitigate it.
To view the specific objects and applications that are associated with a risk, click on the expand (+) button to the far left of the row. If the risk is more general, the row in the report will not have this option.
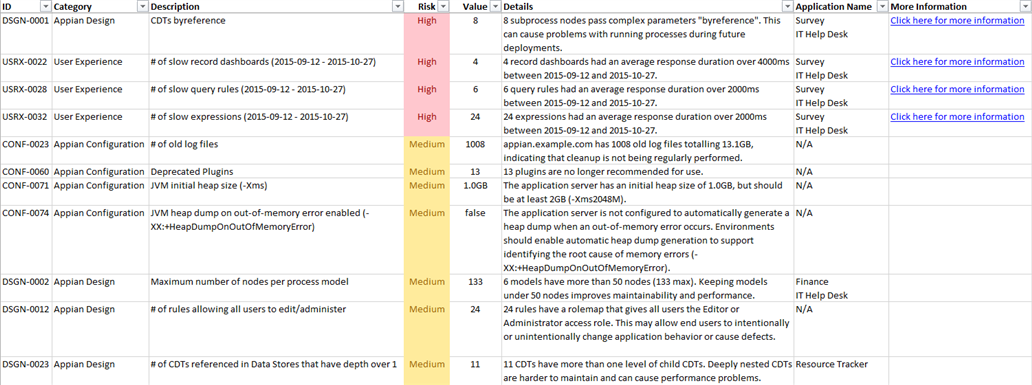

At the bottom of the Details sheet you will find a collection of rows in the Analysis Metrics category, whose risk level is Info. These rows highlight usage metrics for your environment, such as total unique logins per month, total users utilizing sites per month,and total web API requests per month.
Some risks may have a risk level of Unknown in your report. Unknown risk levels occur when Health Check is unable to perform an analysis for that particular risk. The common causes include missing data (such as log files that are only available on a newer version of Appian), an environment configuration that has disabled the logs, or removal of a log file from the data collection zip file before analysis.
See the Health Check Risks and Findings section for a full list of the risks and findings that might appear on the Details sheet of your report.
The term ‘peak average’ is used on the Details sheet when highlighting risks related to slow performance, such as slow related actions or queries. Peak average represents the typical average response time during peak usage. It offers a number of benefits over a conventional performance average, including:
Peak average is an exponential weighted moving average (EWMA). The performance of high-usage periods is more heavily weighted than low-usage periods and more recent data is weighted more heavily than older data.
The EWMA is calculated on a weekly basis. This helps to ensure that low usage periods (such as weekends) do not negatively affect the result, while high usage periods are accurately reflected.
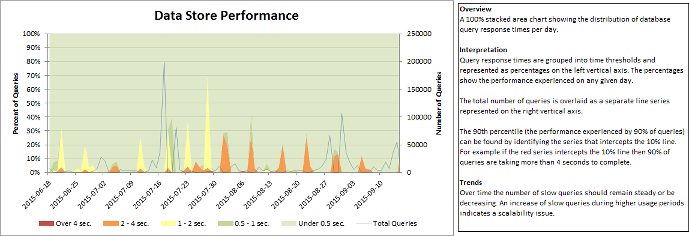
The Dashboard sheet provides you with insight into your environment’s historical trends. This sheet highlights user activity, average response times, and resource utilization.
The source data for the charts can be accessed for manual analysis by unhiding the worksheets that are prefixed with Data_.
The Process Sizing sheet displays details about how the process instances in your environment are using memory in your Appian execution engines. It helps identify potential problems in your process model design and data management configurations.
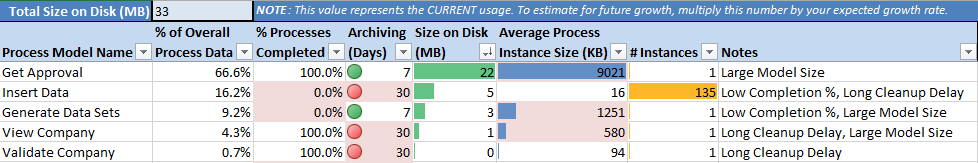
Potential process problems are highlighted in red. The Notes column provides descriptions for these highlighted cells. Potential problems include:
For faster feedback about your process models and their metrics, Appian recommends monitoring process model metrics in the Monitor view. On Appian 18.4 and later, memory usage of process models and their instances are sized periodically in the background.
This section contains a list of all of the unique risks and findings that a Health Check report may include. For each item there is a description, and for some, there is additional information on how best to mitigate the risk.
This finding is also analyzed in real-time as a process model recommendation called Data types passed by reference. Learn more about Appian design guidance.
Passing process variables to subprocesses by reference can be beneficial in many cases. Updates to the process variable from the subprocess are automatically available in the parent process and memory is used more efficiently. However, when a CDT is passed into a subprocess by reference it creates a maintenance risk that could potentially cause all active instances of the parent process model to pause by exception and would require significant manual effort to recover from.
When a new version of the CDT is published, active processes are not updated and continue to use the older version. If an active process later reaches a subprocess node and tries to pass the old CDT by reference the subprocess node will fail because the input is expecting the latest CDT version. CDTs passed by value are automatically cast to the new version and therefore do not fail.
The risk is higher if:
Although there may be cases where the risk is low, it is often difficult to verify and maintain that low risk over time. Therefore the recommendation is to always pass CDTs by value, never by reference.
This finding is also analyzed in real-time as a security warning called Missing viewer or editor group. Learn more about object security.
Under most circumstances, a data store object should have groups assigned viewer rights in its security role map as there will be a variety of users outside of the Administrator group who need the ability to query, read, and/or write data to data store entities. Check the security settings and assign Viewer rights to a user or group for your data store. This can also indicate an anti-pattern where all users are Application Administrators when actually only a small subset of users need to be Application Administrators.
To update a data store's security, follow the instructions to edit object security. Then architect the application to account for the viewer role throughout.
Runtime problems with expressions block users from completing their tasks. They are very common during development however should appear infrequently in a production environment.
The risk is higher if:
Expressions errors are identified in start forms, task forms, Tempo reports, Record views, related actions, and Web APIs.
The error message contains contextual information for taking remedial action. The application object type impacted in addition to the expression rule name and values passed in can be used to replicate the issue.
The Appian Health Check reports on the context size of interfaces for Record List Views, Record Views, Related Actions and Reports.
The context contains data that is held between interface reevaluations. This includes data from load() variables, process variables, activity-class parameters, and record fields.
To reduce the context size, reduce the amount of data held in the specific variables listed above. Refer to the relevant best practices where data comes from a database query or web service call.
The context may be sent to the client like a web browser or mobile app, so it is important to keep it small to minimize the performance impact.
The maximum context sizes should be comparable to the average. A maximum context size being much larger than the average indicates an edge cases exists. This could indicate a larger than normal case or a logical error that is not handled correctly resulting in more data than necessary being retrieved.
The risk of a large context size for an interface is higher if:
load() variables hold duplicate data (for example, one load variable is a web service response as JSON, and another load variables is that same response just transformed to Appian dictionary).with() variables do not affect context size, as these are always calculated during an expression evaluation and never cached. While moving some data in a with() variable could reduce the context size, it is always important to balance caching and evaluating. For example, do not move a query into a with() to avoid caching the query response.
The Appian Health Check reports on the size of interfaces for Record List Views, Record Views, Related Actions and Reports.
The interface size is determined by the number of visible components at runtime and the data held within those visible components.
To reduce the interface size, minimize the number of visible components on the form. Use pagination on grids and dynamic behavior to show large amounts of data when needed.
The maximum interface size should be comparable to the average. A maximum interface size being much larger than the average indicates an edge cases exists. This could be a larger than normal case or a logical error that is not handled correctly resulting in more components than necessary being displayed.
The risk of a large interface size is higher if:
This finding is also analyzed in real-time as a security warning called Missing viewer or editor group. Learn more about object security.
When a Knowledge Center is created, permission levels must be assigned to groups to control access to the Knowledge Center and avoid security issues. Permission levels include Administrator, Editor, Viewer, and Deny (In the legacy designer interface, permission levels are referenced as Administrator, Author, Read Only, and Deny, respectively). Check the security settings on your Knowledge Center and assign explicit Editor (Author) and Viewer (Read Only) groups.
A group can be assigned permission levels for the Knowledge Center by clicking the checkbox next to the Knowledge Center in the application design view, then clicking the "Security" button at the top of the page, and assigning appropriate permissions levels to a group. We recommend using inheritance with appropriate group security at the parent to more efficiently assign groups as security natively inherits downwards in Appian.
The risk is higher if:
See also: For additional details on permission levels and Knowledge Center security, see Knowledge Center Security
Data for processes that have completed, which are no longer needed for auditing or reporting purposes, must be archived regularly. Archiving a process removes it from being used by the process execution and analytics engines. Be sure to enable auto archiving with a delay value of 7 days or below in order to reduce memory usage and increase performance.
The risk is higher if:
The Process Sizing sheet can be used to identify the models that are consuming the most amounts of memory on the Appian engines.
See also: Managing Process Archives
This finding is also analyzed in real-time as a process model recommendation called Too many process variables. Learn more about Appian design guidance.
While there is no limit to the number of process variables in a given process, there are two thresholds for this finding. Generating 100 process variables is a medium risk by this finding and 300 or more is a high risk. Memory needs to be allocated for each process variable created throughout the lifespan of a process. For this reason, whenever possible, utilize activity class parameters within a node to minimize memory allocation for the entire duration of a process.
The risk is higher if:
An activity can be executed multiple times in a process flow using the Multiple Node Instances (MNI) functionality (found in the "Other Tab" of a process model node). However, an activity can only be activated up to 1,000 times within a process using MNI. If you find yourself needing to exceed this limit, consider altering your process design to minimize reliance on MNI (See Transferring/Processing Large Data Sets for ways to efficiently handle large data sets and process flows).
The risk is higher if:
For additional information on MNI see Multiple Node Instances.
This finding is also analyzed in real-time as a process model recommendation called Multiple node instances (MNI) with activity chaining. Learn more about Appian design guidance.
Unattended activity chained nodes with Multiple Node Instances (MNI) can make processes more likely to exceed the activity chaining limit. Additionally this can extend load times between chained nodes. In the end, this leads to a poor user experience and can cause performance issues.
Instead of MNI, attempt to flatten the operation by inserting all rows into a database at once instead of piecemeal or leveraging Looping Functions to perform the operations in a single script task.
The risk is higher if:
This finding is also analyzed in real-time as a data type recommendation called Too many fields. Learn more about Appian design guidance.
This finding indicates the number of custom data types (CDTs) that have more than 200 fields. Large CDTs are harder to maintain and can cause performance problems due to a strain on memory. If an application has one or more large CDTs, consider reworking the data structure of the application through either a complete redesign or, if possible, breaking up large CDTs into smaller more related data types that can be used separately.
The risk is higher if:
a!queryEntity() calls.This finding is also analyzed in real-time as a data type recommendation called Primitive type array. Learn more about Appian design guidance.
Maintaining CDTs with lists of primitive values is poor CDT design which can cause a variety of problems including inefficient query rules and data duplication. Appian treats lists of primitive values in a CDT field as one to many relationships, and values stored in these primitive type variables cannot be updated (you can only insert additional values into the list subsequently increasing the risk of duplicate data). Queries can then return redundant and/or unexpected values from the database.
Instead, design data types such that information can be structured into nested CDTs (however do not exceed a depth of one nesting for additional performance and maintainability reasons.
This finding is also analyzed in real-time as a data type recommendation called Multiple levels of nesting. Learn more about Appian design guidance.
As a best practice, custom data types (CDTs) should contain no more than 1 level of nesting. Highly nested CDTs (CDTs containing fields of another CDT that in turn have a CDT field within them) can complicate data access at child levels and result in complex relationships (for example, many to many) between CDTs and can greatly reduce query performance. This phenomenon has been referred to as the “N + 1 select problem". Consequently, we strongly advise against design incorporating multiple nestings.
If nesting CDTs is found to be necessary, the effects can be mitigated by:
Querying data once upfront and passing it through to where it is used rather than querying for each time it is to be used.
Refactoring the query to retrieve all the data in a single call and avoiding using looping functions to execute database queries.
Merging multiple individual calls to the same entity into a single query that retrieves all the data at once.
The risk is higher if:
This finding is also analyzed in real-time as a process model recommendation called Too many nodes. Learn more about Appian design guidance.
While there is no limit to the number of nodes you can have in a process model, process models with an excessive amount of nodes can become convoluted and difficult to understand, and application designs that have a large number of nodes per process model are generally inefficient. Completed activities cannot take advantage of archival/deletion strategies, and occupy additional memory.
The risk is higher if:
For more information on creating efficient process models, reference: Creating Memory Efficient Models Best Practices and Process Execution Metrics Log.
This finding is also analyzed in real-time as a security warning called Missing administrator group. Learn more about object security.
All objects should be assigned a group in the object security settings. A group with administrator rights is the only group (besides the system administrator) with the right to view or modify security settings in that object. Check the security settings and assign administrator rights to a group on all objects.
A group can be assigned Administrator rights on an object by selecting the object checkbox in the application view, clicking on the Security button at the top of the page, and assigning administrator as the permission level for a group.
The risk is higher if:
See also: Editing Object Security and Application Authorization
Executing process reports in process models can increase the load on the analytics engines and adversely impact end-user report performance.
The risk is higher if:
For more information on using process report nodes in process models see the Execute Process Report Smart Service.
This finding indicates the number of subprocess nodes configured with the multiple node instance (MNI) feature. Using MNI on subprocess nodes combined with other factors can lead to scalability and performance issues.
The risk is higher if:
Additional details / links: For more information on MNI see Multiple Node Instances.
This finding is also analyzed in real-time as a data type warning called Outdated data type reference. Learn more about Appian design guidance.
When a custom data type (CDT) is updated, a new version is created. Other design objects continue to reference the old version until they are updated and republished (in development environments) or an application containing those objects is imported (in a non-development environment).
Referencing outdated CDT versions in different objects in an application causes unexpected behavior and errors, including data loss. These issues may already be occurring or may appear after a future application releases.
In future versions of Appian, updating a data type will automatically update all dependent objects to use the new version of the data type. This will simplify data type management, but it is highly recommended that you resolve all outdated references on your current Appian version to avoid unexpected application behavior.
The risk is higher if:
Prioritize incompatible references first. Resolve all outdated references by republishing and deploying the impacted objects. Use Update All when editing a CDT. Use the Health Check and the outdated type references audit and metrics logs to ensure that all references remain up to date.
See also: Tracing Relationships for Impact Analysis
The work queues contain process activities from the execution engines that are waiting to run on the application server. The work queue size in tracked over time in the engine performance logs. Sustained periods of work queue growth mean that the application server is receiving more activities than it can handle at the time.
Look at the process history to determine which processes were running when the increase in the work queue size occurred. Determine possible performance or scalability improvements for the process model(s) identified during the periods of heavy load. Look at the application server logs to see if any errors occurred during the periods of work queue growth.
Looping is typically an indication of using processes to perform extract-transform-load (ETL) type operations. It is recommended to offload these actions to a dedicated ETL tool (such as a database) as they are capable of handling them much more efficiently. Appian performs best when actions can be executed in bulk without looping.
The risk is higher if:
The risk breakdown displays the name of the process models with the loop followed by the task name that initiates the loop.
See Processing Large Datasets for recommendations on how to redesign the process to better handle this case.
Health Check reports on the context size of interfaces for record list views, record views, related actions, and reports.
The context contains data that is held between interface reevaluations. This includes data from load() variables, process variables, activity class parameters, and record fields.
To reduce the context size, reduce the amount of data held in the specific variables listed above. Refer to the relevant best practices where data comes from a database query or web service call.
The context may be sent to the client (for example web browser or mobile app) so it is important to keep it small to minimize the performance impact.
The maximum context sizes should be comparable to the average. A maximum context size being much larger than the average indicates an edge cases exists. This could indicate a larger than normal case or a logical error that is not handled correctly resulting in more data than necessary being retrieved.
The risk of a large context size for an interface is higher if:
load() variables hold duplicate data (for example one load variable is a web service response as JSON, and another load variable is that same response just transformed to Appian dictionary).Note: with() variables do not affect context size, as these are always calculated during a SAIL evaluation and never cached. While moving some data into a with() variable could reduce the context size, it is always important to balance caching and evaluating (for example you shouldn't move a query into a with() to avoid caching the query response).
Health Check reports on the size of interfaces for record list views, record views, related actions, and reports.
The interface size is determined by the number of visible components at runtime and the data held within those visible components.
To reduce the interface size, minimize the number of visible components on the form. Use pagination on grids and dynamic behavior to show large amounts of data when needed.
The maximum interface size should be comparable to the average. A maximum interface size being much larger than the average indicates an edge cases exists. This could be a larger than normal case or a logical error that is not handled correctly resulting in more SAIL components than necessary being displayed.
The risk of a large interface size is higher if:
This finding is also analyzed in real-time as a process model recommendation called No target process for send message event. Learn more about Appian design guidance.
Targeting specific process instances for messages by their process IDs is much more efficient than sending messages to multiple processes or a process model because only the Receive Message Events for the process ID are scanned, rather than all events in the other processes.
The risk is higher if:
Set the DestinationProcessID property in the Data tab of each Send Message Event to the process ID that should receive the message. If the process ID is not already available update the application design to capture it in process or store in the database.
See also: Messaging Best Practices
This finding is also analyzed in real-time as a process model recommendation called Asynchronous subprocess. Learn more about Appian design guidance.
Appian evenly distributes newly initiated processes across all available execution engines. However, processes that are initiated as a subprocess will run on the same execution engine as the parent process. An imbalance in the number of process instances running on different execution engines can adversely impact process and UI performance.
The imbalance is caused by a single parent process triggering a large number of subprocesses. Resolve this design issue by initiating bulk subprocesses with the start process smart service or by splitting the load across more parent processes.
Note: If execution engines were recently added to an installation there is no automatic redistribution of process instances among execution engines. The process distribution will rebalance over time as old instances are archived and new instances are started.
There are few use cases in which using the Query Database node is preferred. Only use this node if it does not fit one of the use cases for leveraging other database interaction capabilities.
Where possible, use one of the following before relying on the Query Database node:
As a best practice, we recommend placing the Query Database Smart Service in a subprocess to be used in situations when:
For more information on using a query database node in a process model see Querying the Database Smart Service.
Activity chaining between two user input tasks allows the user to avoid going back to their task list to pick up their next task, creating a smoother user experience. However, if there are slow background steps in-between the tasks, the user must wait for them to complete, which can create a worse experience than asking them to pick up the next task in their task list.
The risk is higher if:
Use the Process Monitor and slow process nodes finding (USRX-0058) to identify which node(s) in the flow are slowest. Poor node performance is typically caused by slow expressions, data store operations, and smart services. Use an AND gate to push independent activities into the background and out of the chain.
Process flows that execute in the background are usually a lower risk than slow foreground flows due to the lack of user interaction.
The risk is higher if:
See also: Processing Large Datasets
The performance of data store operations (query rules, write to data store nodes, etc) is logged and can be analyzed to identify which queries are taking a long time and what phase of those operations is taking the most time. Since reading and writing to data stores is an extremely common activity the performance of these individual operations often has a significant impact on the overall responsiveness of an application.
The risk is higher if:
Focus on the slow operations that have the biggest impact first (slowest updates, most frequent queries, critical features, etc). Convert query rules to a!queryEntity(). Optimize based on which phase of the operation is slowest:
a!queryEntity() to reference the tables directly.a!queryEntity(). Let the database handle filtering and aggregation rather than post-processing results in Appian expressions.The performance of expressions (rules and functions) is logged and can be used to identify which expressions are contributing to slow interface or process performance. The Appian Health Check reports on rules created by developers and on functions provided by Appian or by custom plug-ins. Since both rules and functions are used throughout an application the performance of individual calls often has a significant impact on overall responsiveness.
The risk is higher if:
Focus on the slow expressions that have the biggest impact first (slowest, called frequently, critical features, etc). Keep in mind that the reported time for a rule will include the execution time for each function or rule it calls (including query rules); an expression may only be slow because it calls a subrule that is slow. In cases where a rule represents an interface, use the Performance View to help identify the root causes of expression performance problems and follow other SAIL performance best practices.
Appian functions may be slow because they are passed very large inputs or because of more general infrastructure performance concerns (high CPU or memory utilization, for example). Running a rule with apply() or other looping functions over large arrays will magnify the impact of that rule's performance. Connector functions will be slow when the external system takes a long time to respond, in which case the performance of the external system must be improved. Functions defined by custom plug-ins may be slow because of poor implementation or because they perform an large amount of work and/or over-utilize system resources.
Slow process nodes cause chaining between user input tasks to be less responsive and background processing to be slower. Additionally, it is an indicator the application will have trouble scaling to higher volumes.
The risk is higher if:
Investigate the nodes using the Process Modeler. Poor node performance is typically caused by slow expressions, data store operations, and smart services so may require optimization outside of the model.
Dashboards which display data from slow process reports will have an increased rendering time which provides a poor user experience. Furthermore, slow process reports place unnecessary strain on the analytics engines. That extra strain will slow down other requests to the analytics engines.
Determine if the slow running reports are used and needed in their current form. For example, if there is a report that has 10 or more columns, it is highly unlikely that all of those columns are used all of the time. Instead, offer drill down when necessary to present more information to end users only when needed.
Review the documentation for analyzing report performance. Determine if there is a specific column that is responsible for the bottleneck in the report. Work to remove or optimize the columns that are taking the longest to run in the slow running process report.
Slow record list and record view findings are also analyzed in real-time on the record response times tab of the Monitor view.
The Records tab in Appian is comprised of various interfaces and actions, including list views, record views, and related actions. Slow record interfaces and actions negatively affect the user experience and make it harder for users to find the data they need and perform actions important to their work.
The risk is higher if:
The performance of different record interfaces and actions is recorded in the interface performance logs. The Health Check matches the appropriate URL pattern to the type of interface or action and aggregates their performance.
Slow interfaces and actions may have a variety of different causes, as explained below.
Common sources of slowness
The speed of record lists and record views depends primarily on the speed of the underlying data source. If a record is sourced from a slow database query or slow external integration, then the record list and record view will be slow as well. This can be especially noticeable on the record list because Appian queries for up to 100 records at once.
Review the guidance above regarding slow data store operations or work with the owners of the data source to increase performance.
The record type default filter can also be a common source of interface slowness. Default filters are applied to the source data when any of the following occur:
a!queryRecordType().If the default filter value uses an expression, check the Expression Details Log to see if the expression itself is slow. If the default filter value evaluates to an array, this may be causing the data source to perform slowly due to the overhead of transferring the array and filtering the source data against the array. Minimize the amount of data being returned by the default filter value expression to improve performance.
See also: Record Level Security for Entity-Backed Records Best Practice
Slow record list views
In addition to the common sources of slowness described above, slow list view expressions can cause record list views to perform poorly. The list view expression is evaluated once for each item in the list view. Do not call integrations or use looping functions in the list view expression. We recommend storing the list view expression in a rule so you can use the Expression Details Log to check its performance.
Slow record views
In addition to the common sources of slowness described above, record views may perform poorly because of the amount or complexity of the record data. In addition, inefficient or very complex interface may reduce record view performance.
Make sure to pass record data for the record view rule as rule inputs and use the interface performance view to investigate the performance of the record view expression.
The Summary view is the default record view that all users see when first loading a record. We recommend dividing a complex Summary view into multiple views and putting only the most important and fastest performing information on the Summary view. Place less important or slower loading information on additional record views.
See also: Interface Evaluation Lifecycle
Slow related action lists
In addition to the common sources of slowness described above, the number of related actions and the visibility expression for each action can lead to slow loading related action lists.
Review the Expression Details Log to check the performance of the related action visibility expressions. If necessary, reduce the number of related actions or simplify the visibility expressions.
Slow visibility expressions on related actions may also affect the record view loading time if related actions are used as related actions shortcuts.
Slow record related actions
When a related action is clicked, the system evaluates the context expression and performs whatever steps are necessary to render the subsequent user interface, whether it be process start form, activity chained task form, or error message.
Check the context expression to ensure no slow integrations or rules are being used. If the related action causes a process to start and activity chain to an attended task, review the process details to check the performance of the nodes between the start node and the attended task to identify the source of the slowness. Consider moving any slow unattended activities to a parallel flow.
In addition, the visibility expression is checked when clicking a related action, so follow the guidance above to address slow visibility expressions.
The performance of sites is logged and can be analyzed to determine the impact it has on the business users and operations. Sites allow users to focus on a limited set of activities.
Slow sites should be avoided as they negatively affect the user experience. Slow sites that are used infrequently or by few concurrent users are typically lower risk.
The risk is higher if:
Focus on the sites that have the biggest impact first (slowest, most frequently used, critical features, etc).
The performance of smart services is logged and can be analyzed to determine the impact it has on the business users and operations. The use of smart services ranges from internal Appian operations (such as document management) to external integrations (such as data store operations or LDAP synchronization). Unlike data store logging, smart service logs are not granular to each operation being executed, instead they are aggregated across all operations. This is useful for understanding the overall average performance, but will require further investigation to identify if extreme cases are unfairly affecting the average.
Slow smart services that are part of an activity chain should be avoided as they negatively affect the user experience. Slow smart services that are executed infrequently or outside normal business hours are typically lower risk.
The risk is higher if:
Focus on the smart services that have the biggest impact first (slowest, most frequently used, critical features, etc). Remove chaining where it's not required and consider moving into parallel flows, particularly where there's multiple slow smart services.
Tempo reports are a way of pulling in data from tasks, records, relational databases, and other third-party data sources and displaying it on a single form in Tempo for end users to view. Slow Tempo reports negatively affect the user experience as it makes it more difficult for users to view and analyze aggregate data. Tempo reports may perform poorly because of the amount or complexity of the underlying data. In addition, inefficient or complex interfaces may reduce Tempo report performance. Make sure to use the interface performance view to investigate the performance of the report expression.
The risk is higher if:
The performance of Tempo reports is recorded in the Interface Performance logs. The Health Check matches the appropriate URL pattern to the report and aggregates their performance.
See also: Interface Evaluation Lifecycle and Tempo Report Design Best Practices
The performance view shows you detailed information for your web API. This allows you to identify and address performance bottlenecks and to understand the impact of particular rules and functions on the overall form or rule.
The risk is higher if:
Web APIs may be slow because they are passed large inputs, the executions within them are complex, or because of more general infrastructure performance concerns (high CPU or memory utilization, for example). Sometimes executions can be designed in a simpler manner (for example, reducing the use of apply() or other looping functions in the associated expression), however if design changes are not an option, you may need to upgrade the system infrastructure to meet business requirements.
Appian Cloud customers can view key metrics and configuration information about their cloud environments, similar to these Infrastructure findings, via MyAppian's cloud resources.
Indicates the periods of time during which the CPU utilization averaged above 75% for at least a 10 min. interval on the engine server.
Identify the scheduled or CPU-intensive processes that may be the cause of the high CPU utilization. High-CPU utilization throughout the business day indicates the system resources are inadequate and may require additional CPU to carry the load. Review process design as high-CPU utilization could be a result of inadequate design, especially if an unnecessarily large number of process nodes are launched concurrently. If design is as efficient as possible, you may need to increase the number of CPUs available to the system.
Identify disk utilization as a percentage of total disk space. Anything over 50% utilization is a medium risk finding while over 75% is a high risk finding.
Disk utilization % (Appian gateways)
If your disk utilization percentage is high for Appian gateways, you have relatively low storage capacity available for Appian engine data on your server.
In this case you may need to configure the out of the box Cleanup Script to clean up old kdb files to prevent the server from running out of disk space.
Disk utilization % (archived processes)
If your disk utilization percentage is high for archived processes, consider deleting completed processes that do not need to be archived, moving the archived processes to a different storage location using the Cleanup Script, or adding disk space.
Disk utilization % (logs)
If disk utilization is high for archived logs, the system may not be cleaning up older log files. Review the contents of the Appian logs folder and setup the Cleanup Script to delete old log files, move the log files to a different backup location or add more disk space.
Disk Utilization % (Appian documents) If your disk utilization percentage is high for Appian documents, ensure that unnecessary documents are deleted in process. If the documents are properly deleted, consider adding disk space.
The Appian engines are in-memory, real-time databases based on KDB and the K language. Appian Engines depends on having sufficient memory to function. The Execution and Analytics engines are typically responsible for the highest memory consumption as they hold data from all processes including those that have been completed, but not yet archived.
Use the process model sizing health check results to identify the models with the highest memory utilization and take steps to resolve such as decreasing the time completed processes take to archive or implementing a modular design using subprocesses that can be archived sooner. Refer to Creating Memory Efficient Models Best Practices for additional information on optimizing process model design.
If no further steps can be taken to reduce the memory consumption after taking the above actions, it may be necessary to increase the amount of memory available on the server. Refer to Using the Sizing Script for Engine Capacity Planning.
See also: Long cleanup delay for completed processes
Indicate the number of times that the app server host CPU utilization averaged above 80% for a 10 min. interval. This finding could arise for two reasons:
In the first case, attempt to redesign the process through some of the Processing Large Data Sets “Dos and Don’ts” to decrease the load on the Application Server. If design is immutable, consider scaling up the application server layer of your environment.
Identify the number of times the app server host heap utilization averaged above 80% for a 10 min. interval. This finding could arise due to any of, but not limited to the following three reasons:
In most cases, memory leakage traces back to a plugin and Solution Engineering can help you find the root cause. It is possible that your use case simply requires more heap due to the nature and volume of the application in which case you will need to scale the application server layer.
Identify the engines corresponding to the OS processes that are experiencing the high load. Usually, the high load will be on either the process execution engines or the process analytics engines. The underlying cause of a high load can be either inadequate design or hardware. If process design is immutable, consider adding additional engines (or CPUs if CPU utilization is also high as a high load is related to CPU usage).
Process execution engine
High load on the execution engine directly relates to one or more processes launched within Appian. If the cause is not evident from the active processes on the system then:
Process analytics engine
A high load on the analytics engine is indicative of loading or exporting large, complex, or a high volume of reports within the environment at a given time. Review the corresponding perf logs to identify any processes that are executing relevant smart services such as “Execute Process Report.” If reports are designed well and high loads continue to cause performance problems, you may need to scale your hardware.
In some cases, the Analytics engine logs might also have information on specific reports that are executed. If available, correlate this data with the Analytics perf logs to help identify the particular report(s) that is (or are) executed at that time.
Additional details/links: Process Design and Personalization engines are less likely to create issues, however there is more information on finding the cause and solutions to each here.
Configuring Appian to share the primary data source with the business data source causes the primary data source data to be available to all processes which is a security risk. Due to security concerns, we strongly recommend using a secondary data source to store business data and maintain a separate data source for primary Appian metadata.
Additional details / links: For more information on configuring separate data sources: Business Data Sources.
Appian can restrict the communication between the application servers and engine servers to prevent unauthorized calls, such as those from a network intrusion or malicious user.
See Engine Connection Restrictions for configuration steps.
The default application node limit of 1,000 has been increased. We do not recommend this property exceed 1,000. If the application relies on using more than 1,000 nodes, we recommend redesigning the application. See Transferring/Processing Large Data Sets for ways to efficiently handle large data sets and process flows.
The risk is higher if:
For additional information on MNI see Multiple Node Instances.
Overriding Spring unsecured config indicates that the URL path is not secure as the default Appian configuration has been modified to allow authorization to bypass Appian authentication. In other words, the link does not require authentication to view a given page and can be accessed by anyone who knows the link itself.
Modifying spring files is a deprecated practice that may compromise the security of the platform. It is recommended to migrate away from such modifications as soon as possible in order to remain supported. Instead of an unsecure spring configuration, secure the URL path with one of the supported authentication mechanisms.
Appian plug-ins, such as those provided by the community through AppMarket or custom built, will require maintenance over time. Health Check helps highlight 3 areas that impact the maintenance of plug-ins:
Deprecated: A new product release may deprecate existing functionality that is no longer recommended for use. Deprecations are usually accompanied by alternatives that work better (such as a new feature that makes it redundant). A deprecated API will continue to work until it is removed; an API will usually remain deprecated for two product releases before it is removed.
Removed: An API may be completely removed after it has been deprecated for two product releases. Plug-ins that are referencing removed APIs will no longer function until they are updated.
Private: Using an API that is not part of the public API is not supported and may stop functioning at any time (such as after a hotfix or new product release). Refactor the plug-in to use the public API.
To request assistance with updating a plug-in, contact Appian Customer Success.
The default limit on data returned by the Query Database Smart Service is ten rows of data (1,000 rows for Appian Cloud users). We do not recommend this property exceed 1,000 to prevent large query results from affecting performance. If the application relies on querying more than 1,000 rows of data at one time, we recommend redesigning the application and reducing the number back down to 1,000 rows or fewer.
The risk is higher if:
See also: Row Return Limits for the Query Database Smart Service and Transferring/Processing Large Data Sets
No recursive rules should exceed a total depth of 20. If recursive rules exceed a depth of 20, they can adversely affect performance and/or contribute to a poor user experience.
The risk is higher if:
Consider using looping functions such as apply() or reduce() instead of recursive rules. For more information on recursive depth limits and looping functions see the Project Implementation Best Practices Checklist and Looping Functions Documentation.
These system event log error entries indicate inconsistencies in data, which can cause the database to fail. The rollback procedure is triggered by a failed write transaction. The engine then logs an error and attempts to restart the engine. This type of error requires review by the system administrator.
If you see rollback, transaction log, or write to disk errors, please open a support ticket.
For more information on rollback, transaction log, or write to disk errors see (System Event Log Files).
Understanding the Health Check Report
