Overview
This page covers all of the features of the Monitor view in Appian Designer.
To access this view, click Monitor in the navigation pane at the environment level or in an application.
When you access this view at the environment level, it contains information about deployments in the current environment. When you access the view from within an application, it contains information about deployments in the individual application.
Purpose
The Monitor view helps you keep an eye on health and activity indicators for your applications.
Elements
The Monitor view consists of a header bar, navigation pane, and the following tabs:
Health dashboard
The Health Dashboard tab provides an at-a-glance overview of the health of your environment or application. It includes both runtime and design-time information, and surfaces related metrics and key performance indicators.
The dashboard is composed of three sections. The first section displays a high-level summary card for the contents of each of the other four Monitor tabs (A). The second section highlights application specific design-related metrics (B). This section is only displayed when viewing the Health Dashboard from within an application. The third section shows all of the active Appian design guidance that has been triggered for the objects within the environment or application (C).
Note: Only objects for which a developer has at least Viewer permissions are reflected in the dashboard's various summary cards and displayed in its Appian Design Guidance grid. The only exception to this is the Process Activity section, which displays processes that a developer has Initiator or higher permissions to.
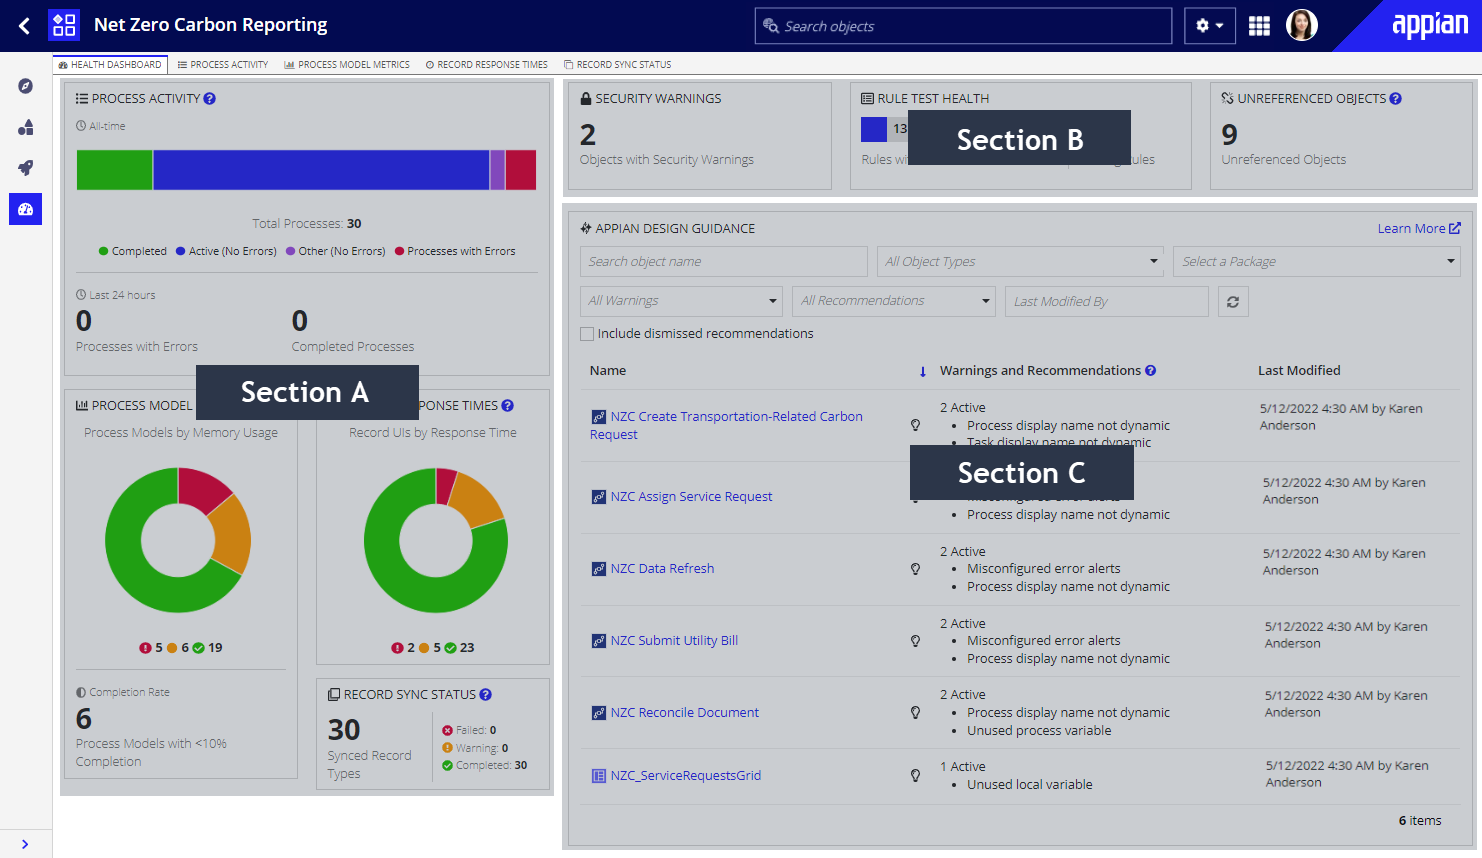
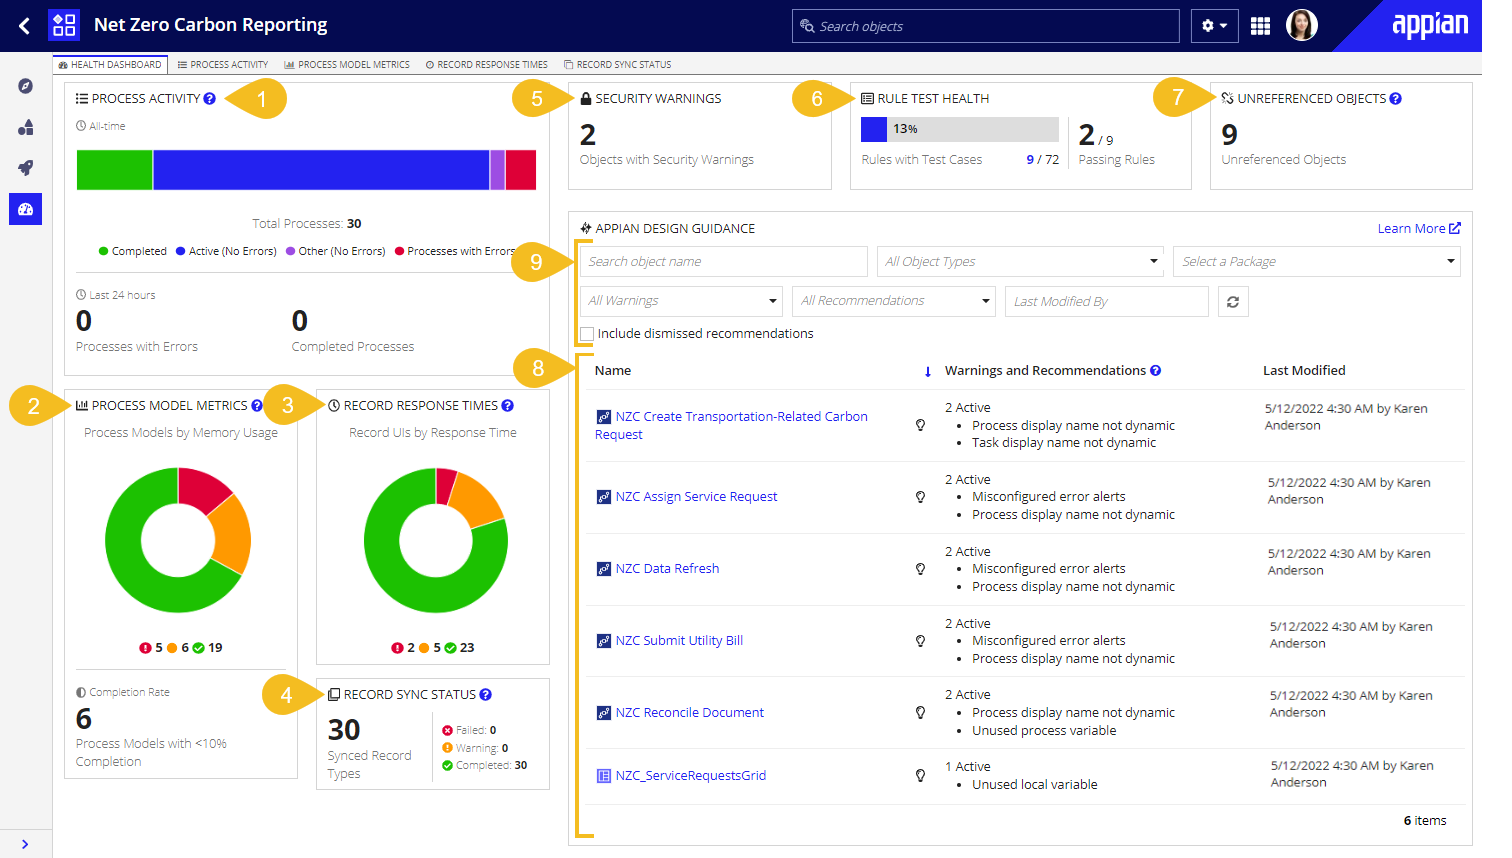
The annotated screenshot above and descriptions below define the metrics and information displayed on the Health Dashboard tab.
- Process Activity: Provides a summary of the contents visible on the Process Activity tab. This card includes a breakdown of all process instances by status. It also displays the number of processes with unresolved errors and the number of processes that have completed within the last 24 hours. Clicking this card navigates you to the Process Activity tab.
- Process Model Metrics: Provides a summary of the contents visible on the Process Model Metrics tab. This card displays the number of process models with low, medium, and high memory usage. It also displays the number of process models whose instances have completed less than 10% of the time. Clicking this card navigates you to the Process Model Metrics tab.
- Record Response Times: Provides a summary of the contents visible on the Record Response Times tab. This card displays the number of record UIs (record lists and views) with low, medium, or high response times. Clicking this card navigates you to the Record Response Times tab.
- Record Sync Status: Provides a summary of the contents visible on the Record Sync Status tab. This card displays the total number of synced record types and the number of record types whose latest sync status was Completed, Failed, or Warning (which represents the Approaching Limit status). Clicking this card navigates you to the Record Sync Status tab.
- Security Warnings: Displays the number of objects with at least one security warning. Clicking this card opens the Security Summary, where you can edit object security in bulk. This card is only visible from within an application.
- Test Health: Displays two separate test health metrics. On the left it shows the percentage of expression rules with at least one test case. On the right it shows the number of expression rules that have all of their test cases passing out of the total number of expression rules with test cases. Clicking this card opens the Manage Test Cases dialog, which allows you to run test cases in bulk and identify expression rules that are missing test cases. This card is only visible from within an application.
- Unreferenced objects: Displays the number of unreferenced objects. Clicking this card navigates you to the Unreferenced Objects tab of the Build view. This card is only visible from within an application.
- Appian Design Guidance: Displays a grid of all of the objects that have at least one warning or recommendation, whether active or dismissed. By default the grid only shows objects with warnings or active recommendations, and displays objects which contain warnings first. Each row in the grid displays:
- Name: The name of the object and its type. Clicking the hyperlinked name opens the object in a new tab.
- Warnings and Recommendations: The list of warnings and recommendations that have been triggered for the object. By default only warnings and active recommendations – those that have not yet been resolved or explicitly dismissed – are displayed in the grid. To view dismissed recommendations, select the Display dismissed recommendations filter checkbox.
- Last Modified: The timestamp that the object was last modified on, and the user who modified it.
- Appian design guidance grid filters. These include:
- Object Name search: Filters objects in the grid by search term. The entered term is searched against all of the object names available in the grid.
- Object Types dropdown: Displays objects in the grid of the selected type(s). Note that only object types that can have warnings or recommendations are listed in this dropdown.
- Packages dropdown: Only displays objects in the grid that are in a selected package. This filter is only available when viewing the Health Dashboard within an application.
- All Warnings dropdown: Displays objects in the grid that have the selected warning(s).
- All Recommendations dropdown: Displays objects in the grid that have the selected recommendation(s).
- Last Modified user picker: Displays objects in the grid that were last modified by the specified user or users.
- Include dismissed recommendations checkbox: Displays all dismissed recommendations for the objects in the grid.
Note: Process models must be published in order for their design guidance to appear on the Health Dashboard.
Process activity
The Process Activity tab shows a list of all process instances related to your environment or application that are currently on the system. By default, the processes list displays only processes that have started in the last 7 days and have not been archived. See Process Activity filters to change the status and time range.
Note: Developers must have at least Initiator permissions to processes in order to see them on this monitoring tab.
The annotated screenshot and descriptions below define the features and metrics displayed on the Process Activity tab.
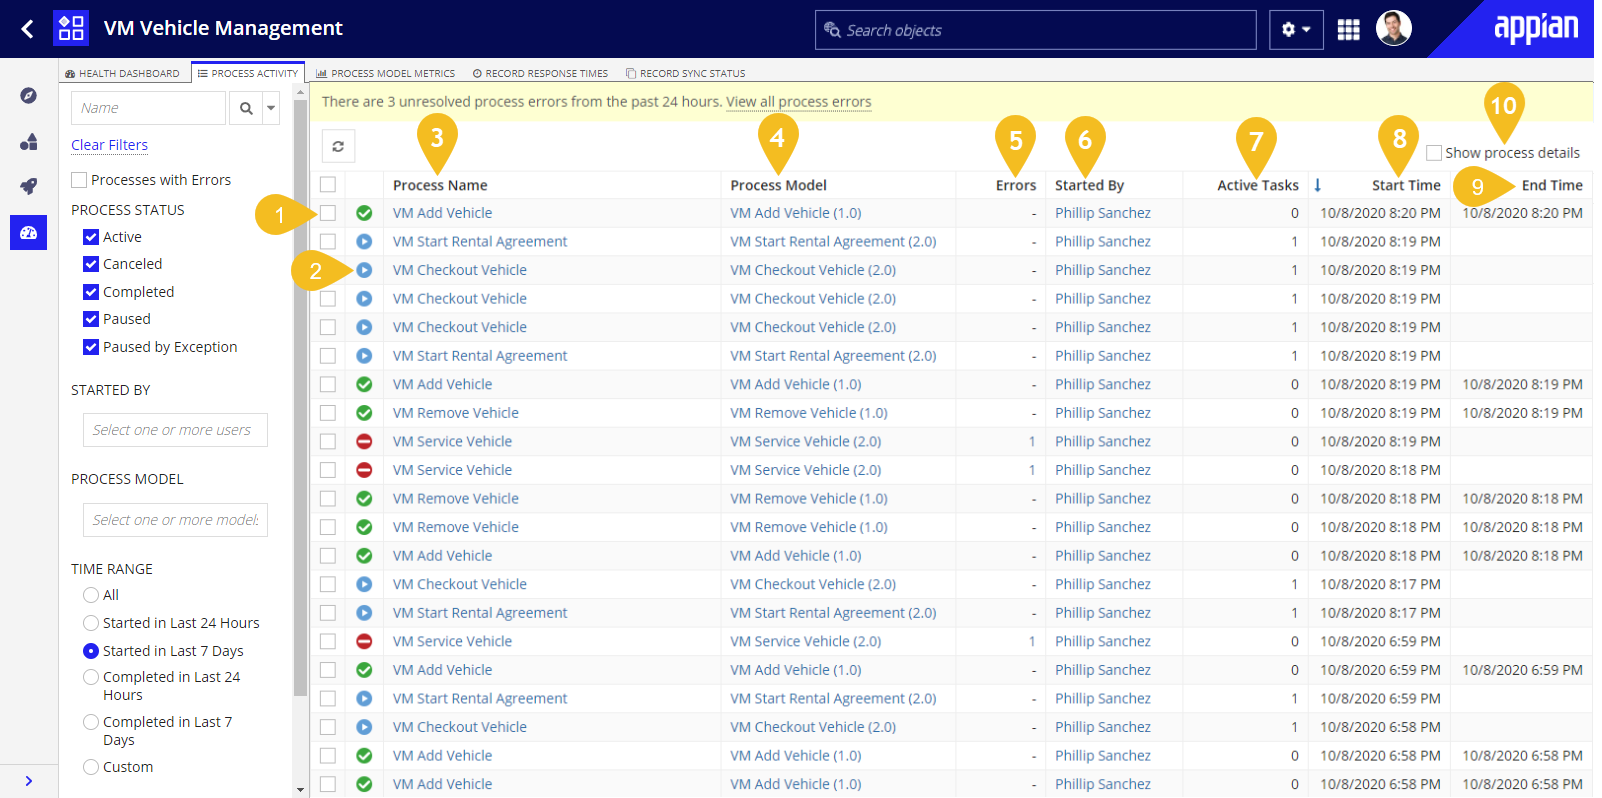

- Selection Checkbox: Allows a developer to perform various process options on the selected process instance.
- Status Icon: A quick visual indicator for each process. Possible statuses include:
 Active
 Active with Error(s)
 Completed
 Paused
 Paused by Exception
 Canceled
 Archived
Note: Currently, archived processes are available under the Process Activity tab for all new Appian Cloud sites in Appian 21.1 or later versions and will be enabled on existing Appian Cloud sites via a phased approach.
- Process Name: The name of the process. Hyperlinked to open the process in the Process Modeler.
- Process Model: The version of the process model executed by the process instance. Hyperlinked to open the related process model version in the Process Modeler.
-
Errors: Unresolved errors associated with the process. Hyperlinked to open a Process Errors dialog that displays the process' error message and its details.
- Started By: The initiator of the process. Hyperlinked to open a user profile dialog.
- Active Tasks: The number of active tasks within a process. This column will only have a non-zero value for processes that have an Active, Paused, or Paused by Exception status.
- Start Time: The date and time when the process was started.
- End Time: The date and time when the process was completed or canceled.
- Show process details: Checkbox which displays three additional columns in the list:
- Process ID: The ID of the process.
- Engine: The execution engine the process is currently running on.
- Memory (AMU): The amount of memory that the process is consuming. Process memory is expressed in AMUs. This process memory calculation runs in the background and is not reflected in real-time. Any process instance marked as "N/A" represents a calculation that has not yet occurred. See Process Model Metrics to learn more about monitoring the memory usage and performance of your processes.
Process error warnings
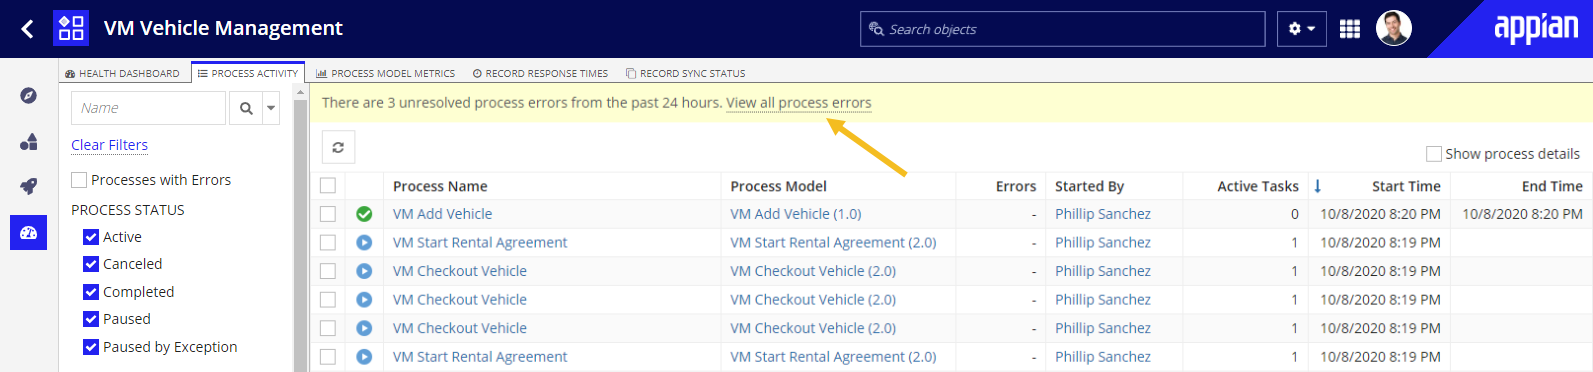
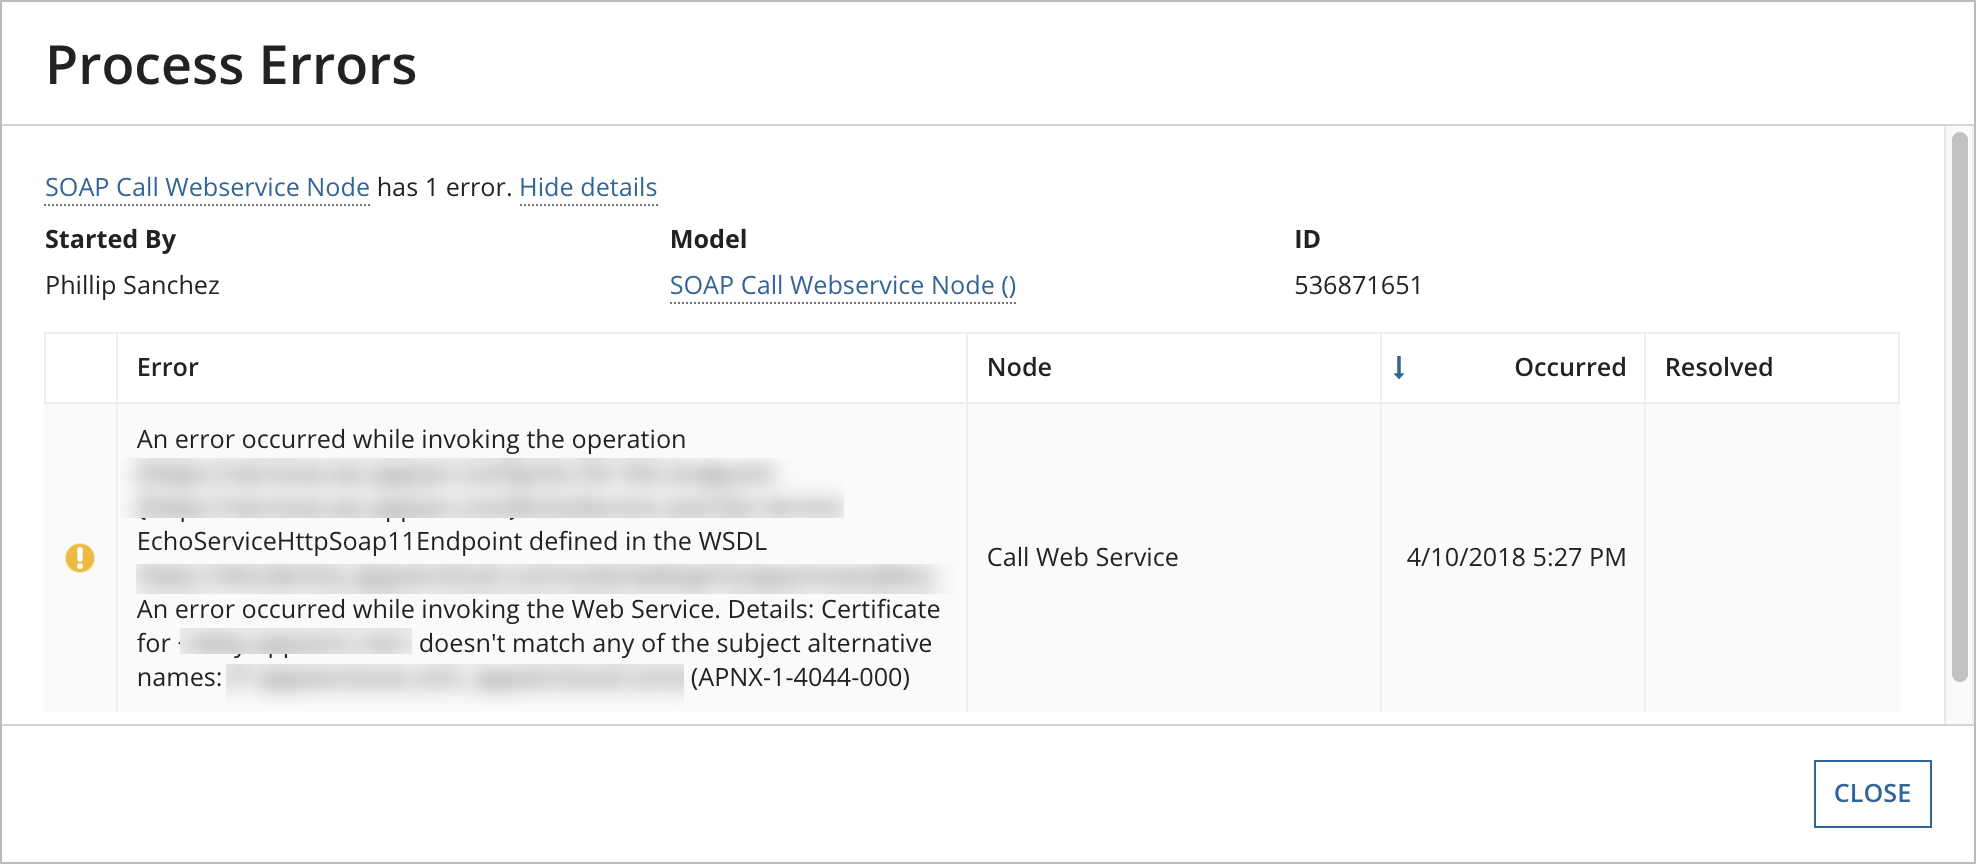
A banner above the processes list notifies developers about all of the unresolved errors which have occurred in the last 24 hours. Clicking on View all process errors opens a dialog (see image below) which provides detailed information about each process error and gives developers the ability to filter errors.
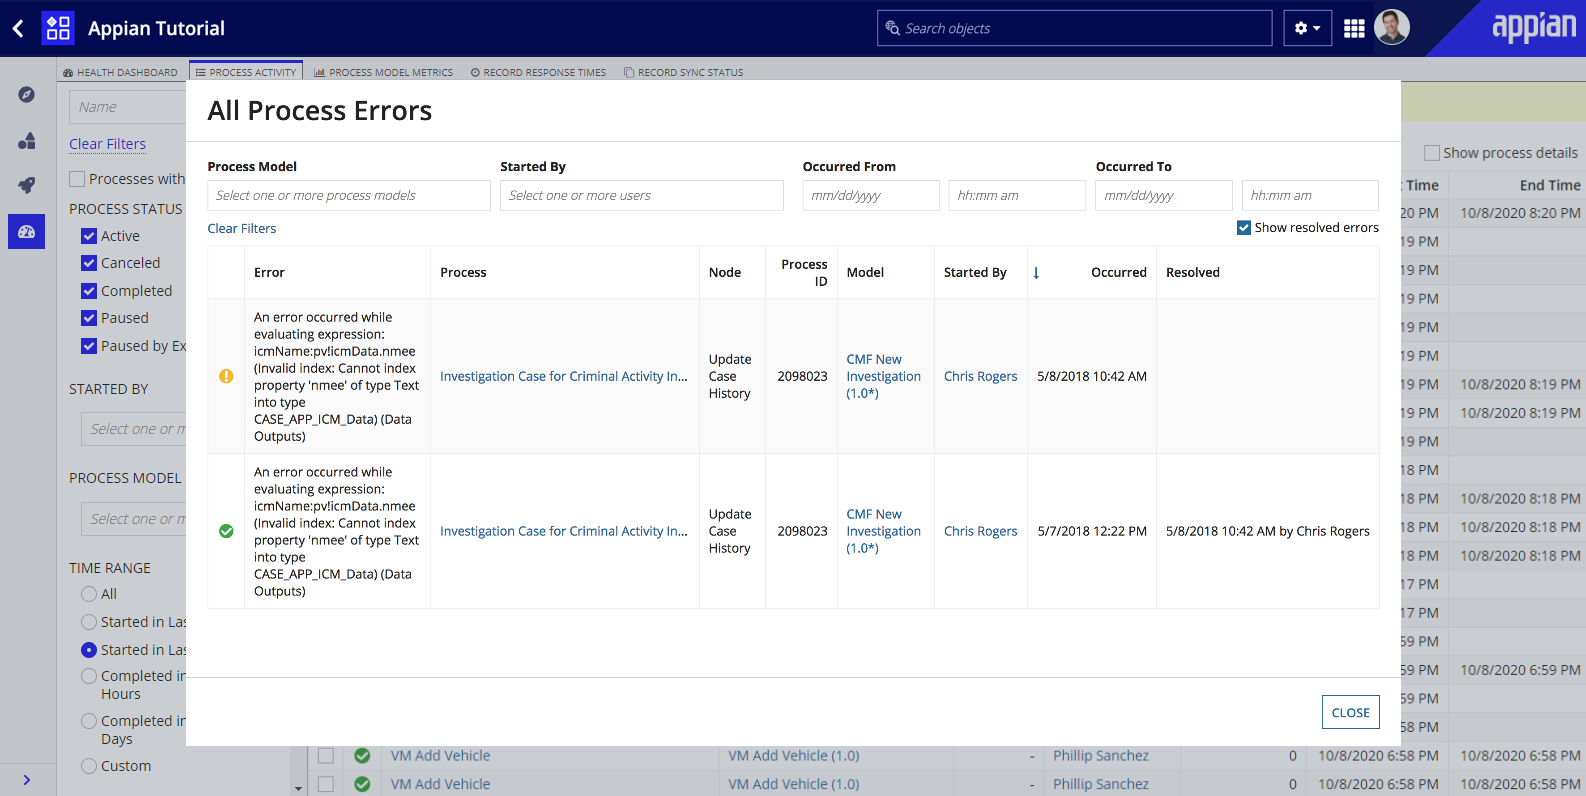
By default, the process errors list in the dialog only displays the unresolved errors that require attention. Resolved errors (including their resolution datetime and the user who resolved them) can be viewed by clicking the Show resolved errors checkbox in the dialog's upper right-hand corner.
Note: Being able to view process errors in Appian Designer is a feature that was released in Appian 18.2. Any errors that have occurred prior to being upgraded to 18.2 will not be available in the Process Activity tab. If an alert was configured and hasn't yet expired, the error can still be viewed on the Alerts page in the legacy Application Portal.
Search and filters
The left-hand pane of the Process Activity tab contains search and filter options.
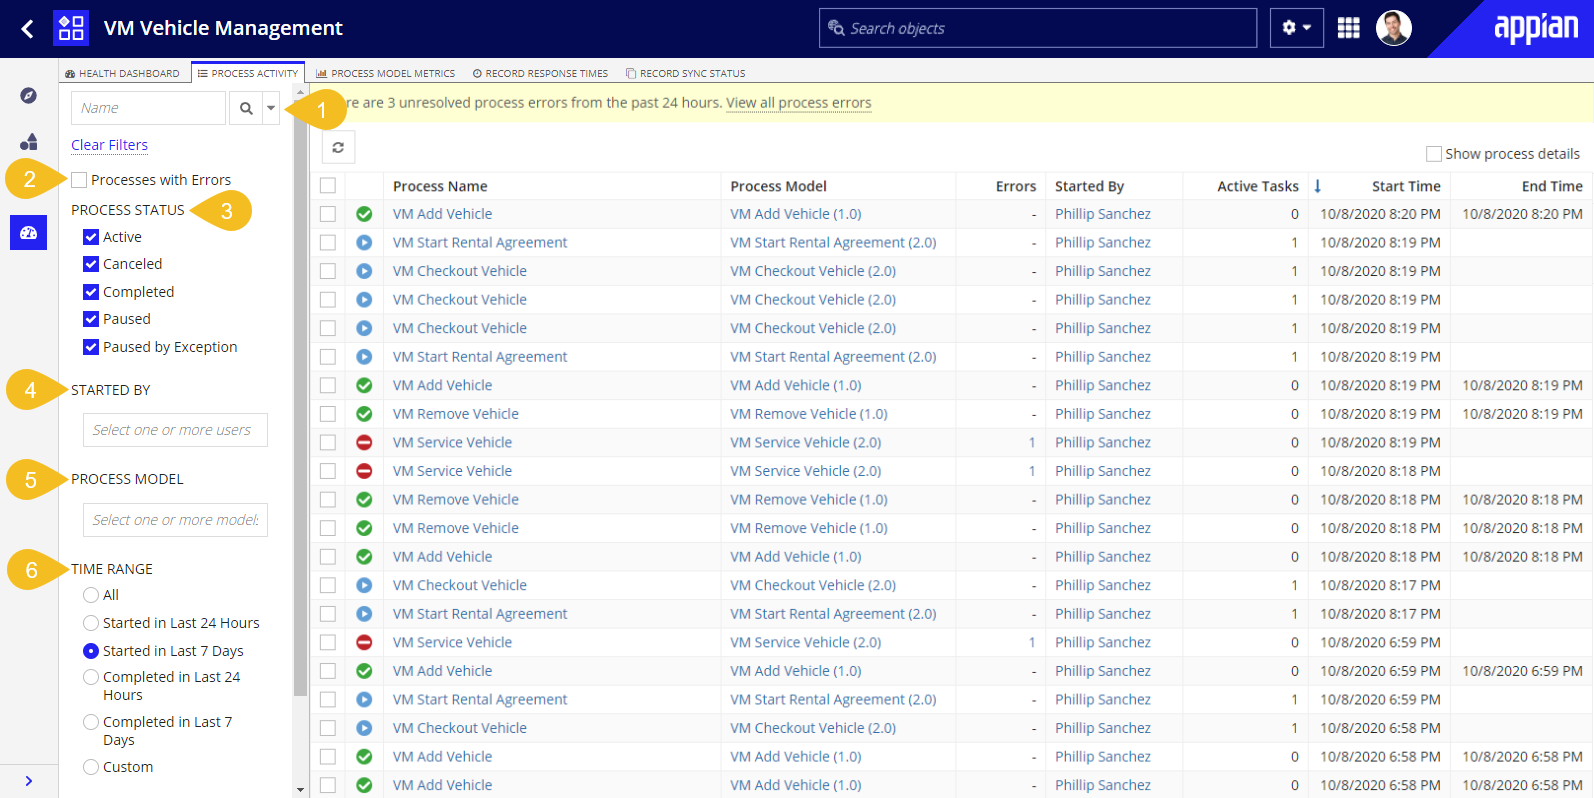
Developers can filter listed processes in the following ways:
- Search: Displays processes that meet the entered search term. By default, entered terms are searched against process names. Developers can also change the search option to ID, which will run the entered term against process IDs.
- Processes with Errors: Only displays processes with at least one unresolved error. Note that only processes with Active or Paused by Exception statuses can have errors.
- Process Status: Displays processes with the selected statuses. By default, the process list displays only processes that have not been archived.
- Started By: Displays processes started by the one or more selected users.
- Process Model: Displays processes from the one or more selected process models.
- Time Range: Displays processes started within the specified time range. Options include:
- All processes
- Processes started within the last 24 hours
- Processes started within the last 7 days (default)
- Processes completed in the last 24 hours
- Processes completed in the last 7 days
- A custom time range. When Custom is selected, developers can choose to filter by process start and/or end time.
Options
When a process is selected, options will appear in the toolbar above the processes list. Multiple processes can be selected at once in order to perform operations in bulk, but note that not all options support bulk operations.

The following options are available in the toolbar:
- Security (Single-Choice) Allows a process administrator to adjust the security of an individual process. For more information, see process security.
- Resume (Multiple) Allows process administrators to resume paused processes.
- Pause (Multiple) Allows process administrators to pause active processes.
- Cancel (Multiple) Allows process administrators to cancel active processes.
- Delete (Multiple) Allows process administrators to delete selected processes.
- This will also delete any synchronous subprocesses and pending tasks in the selected processes.
- When a non-adminstrator selects all processes and they have permission to delete at least one of the selected processes, the delete button will still be active. However, non-administrators will not be able to delete all processes.
- History (Single-Choice) Allows users with at least viewer access, to view the history of a process. For more information, see process security.
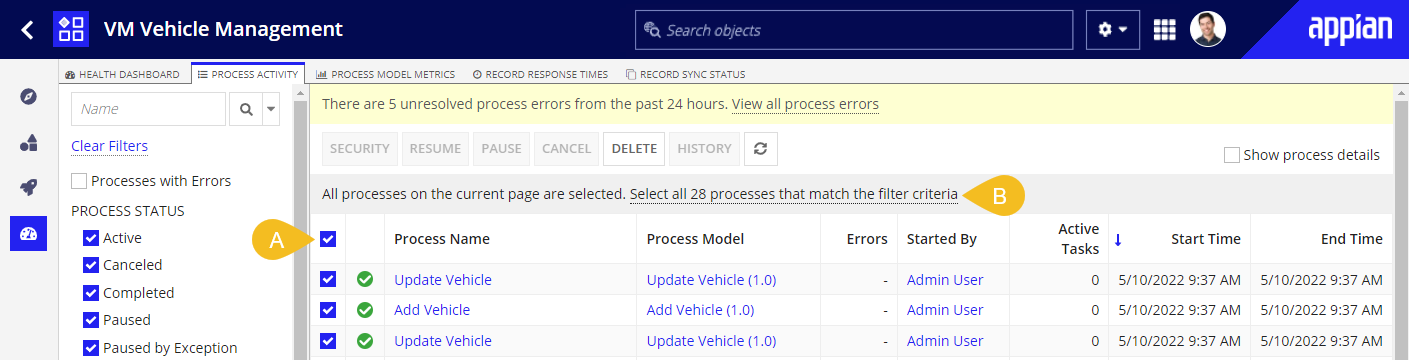
In addition to being able to select and perform operations on multiple processes on a single page, developers can select and perform operations on processes across multiple pages. To do so, select all processes on the current page (A). A grey banner will then appear (B) directly below the toolbar with the option to select all processes that match the current filter criteria, for up to 10,000 processes.
Customizable report
In addition to the search and filter options provided on the left-hand pane of the Process Activity tab, there is a link to the customizable report. Clicking this link opens the All Processes process report in a new tab. Changes to the All Processes report do not affect the Process Activity tab in Appian Designer and vice versa. This report does not allow you to view process errors.
Process model metrics
The Process Model Metrics tab shows metrics related to the memory usage of process models on the system. Only process models with process instances on the system are shown in this report. By default, process models are sorted by those consuming the most to least total memory.
Process memory is expressed in AMUs. This process memory calculation runs in the background and is not real-time.
Note: Developers are only able to view metrics on this tab for process models that they have at least Viewer permissions to.
The annotated screenshot and descriptions below define the features and metrics displayed on the Process Model Metrics tab.
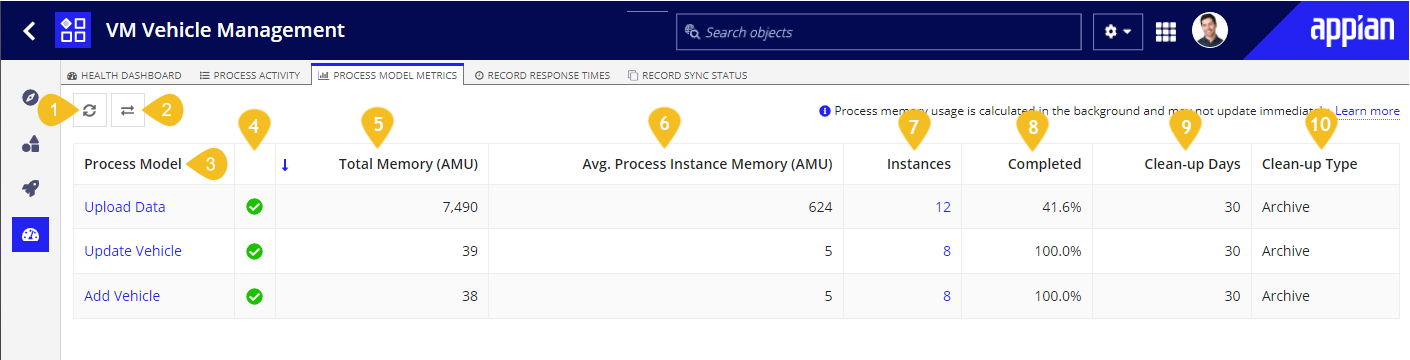
- Refresh button: Refreshes the status of the Process Model Metrics tab.
- Select Another Environment button: Allows you to view how your process models are performing in another environment. Clicking this button opens a dialog that displays a list of the connected environments that have been configured in your DevOps Infrastructure in the Admin Console. Select a different environment to view the process model metrics of that environment directly in your current tab.
Note: Developers must have at least Viewer permissions to process models in the current environment in order to view their process model metrics from another environment.
- Process Model: The name of the process model. Click the linked name to open the process model in the Process Modeler. Note that any instances on the system whose process models have been deleted will be aggregated into one row and displayed with a process model name of
[deleted].
-
Status Icon: A quick visual indicator of each process model's memory usage based on the current total calculated AMU of all active instances of that model (see #5 below). Possible statuses include:
| Icon |
Size Status |
 |
Displayed for models whose current total calculated size is less than 100,000 AMU. The memory usage of this model's instances is generally considered low. |
 |
Displayed for models whose current total calculated size is between 100,000 and 1,000,000 AMU. The memory usage of this model's instances could potentially affect the system. |
 |
Displayed for process models whose current total calculated size is greater than 1,000,000 AMU. The memory usage of this model's instances is high. |
Note: The qualifications of Low, Medium, and High memory usage are based on average resource allocation and usage. Your systems and expected usage may not reflect these boundaries. If you have concerns, contact your system administrator.
- Total Memory (AMU): The total size of the process model's memory, derived from the aggregated memory usage of the individual process instances. This size is based on the instance memory that has currently been calculated.
- Avg. Process Instance Memory (AMU): The average amount of memory each instance of the process model is consuming, based on the instance memory that has currently been calculated.
- Instances: The total number of instances that exist on the system for the given process model. Clicking the linked instance count will open the Process Activity view, filtered to show just the selected process model's instances with the Time Range filter defaulted to "All".
- Completed: The percent of instances that have completed for the given process model.
- Clean-up Days: The number of days set in the clean-up policy for the process model. This can be a number between 0 and 999, otherwise it will be "Never" if the process model is set to not automatically clean-up processes.
- Clean-up Type: The clean-up policy for the process model. This value displays either Archive, Delete, or N/A if the process model is configured to not automatically clean-up processes.
Monitoring process model AMU
It is important to look at all of the various dimensions available in the Process Model Metrics tab, when trying to optimize the performance of your process models and their instances on your system. While Total Size is a good initial indicator of potentially memory intensive process models, it is often necessary to look beyond just this value on its own.
For process models using a significant amount of memory:
- Is the average instance's memory high? View the memory of the individual instances in the Process Activity tab to verify that there are no outliers that may be causing the average memory to spike. If all of the instances are consistently using a large amount of memory, then this might indicate that the model's design needs to be improved to reduce its overall memory footprint.
- Are there a lot of instances? Consider updating the clean-up policy to archive or delete completed processes more frequently, especially if the completion percentage is consistently high.
- Are the model's instances completing as expected? A low completion percentage could mean that the model is often encountering errors or generating uncommonly long-lived processes, due to incorrect or inefficient model designs. As a result, this might indicate the model's design needs to be improved to reduce its overall memory footprint.
If you're updating the design of a process model, consider the following factors which impact the memory footprint of your process models and their instances:
- The definition of the process model itself
- The definition of each process node
- The number of process variables
- The values of each process variable
- The length of the process history
- The values being stored in the process history
- Any notes and attachments that the process may carry
Record response times
The Record Response Times tab allows you to monitor the performance of your record interfaces (both record lists and record views), and identify those with the slowest interactions.
This tab displays the top ten slowest response times for each record list or view, including details about when the slowest response times occurred and who executed them. For each of these response times, Performance Views are available so that you can identify why a specific interaction might not be performant (see #9 below).
Note: Developers must have at least Viewer permissions to records in order to view their response times on this tab.
The annotated screenshot and descriptions below define the features and metrics displayed in the Record Response Times tab.
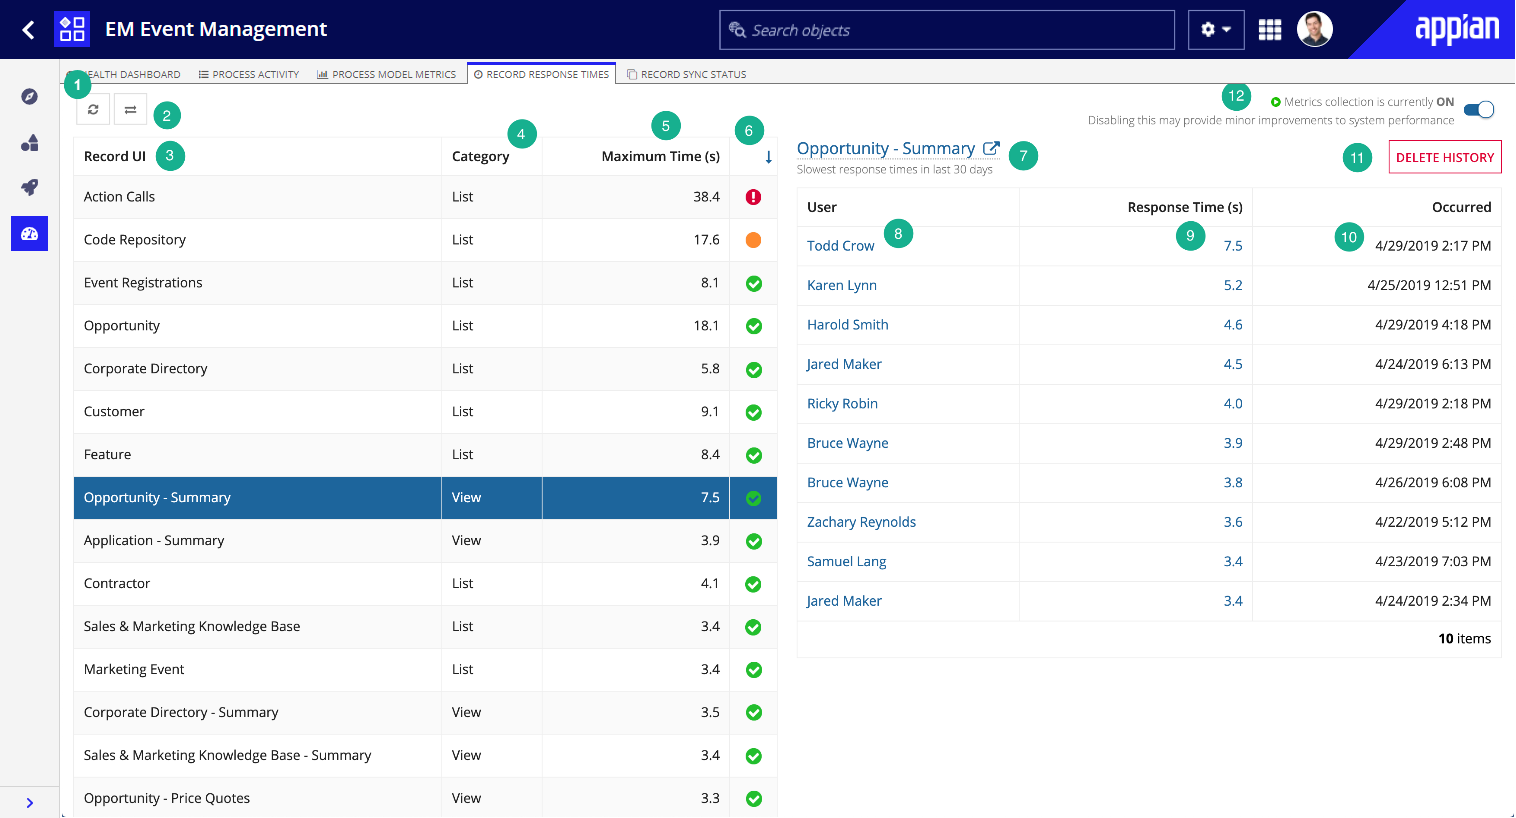
- Refresh button: Refreshes the status of the Record Response Times tab.
- Select Another Environment button: Allows you to view how your record interfaces are performing in another environment. Clicking this button opens a dialog that displays a list of the connected environments that have been configured in your DevOps Infrastructure in the Admin Console. Select a different environment to view the record response times and performance view metrics of that environment directly in your current tab.
- Record UI: The name of the record interface. Select the row to see more details about that specific record interface and its response times, including its top ten slowest responses.
- Category: The type of record interface (list or view).
- Maximum Time (s): The slowest response time (in seconds) captured for the record interface, over the last 30 days.
-
Health Icon: A quick visual indicator of each record interface's response time health, based on the average response times that were collected for the interface over the last 30 days. Possible statuses include:
| Health Icon |
Response Time Status |
|
Displays when the response times for this record are low. |
|
Displays when the response times for this record could potentially affect the system. Consider reviewing the record's performance views (#9 below) and design to reduce its overall latency. |
|
Displays when the response times for this record are high. Review the record's performance views (#9 below) and designs to reduce its overall latency. |
- Record List/View Name: The name of the selected record interface. Click the link to view the record type object of the record interface.
- User: The name of the user who executed the record interface. Click the user link to view their user properties.
- Response Time (s): The response time (in seconds) for the execution of the record interface. Click the response time link to see the real-time Performance View of the execution and evaluation metrics.
- Occurred: The time at which the record interface interaction occurred.
- Delete History button: Removes the response times and performance view metrics for the selected record interface from the system. Response times and metrics cannot be restored after deletion.
Note: Developers must have at least Viewer permissions to the selected record interface in order to delete the response time history.
- Metrics Collection toggle: Turns on or off the collection of response time and performance view metrics in the background. This toggle is only available to system administrators.
Note: This toggle is turned on by default. Turning metric collection off may improve your overall system performance.
Monitoring record response times
When record UIs have high average response times, use their performance view (#9 above) to troubleshoot and ensure that all of their rules and queries are performant.
Record sync status
The Record Sync Status tab displays status information for all record types with sync enabled. This includes the source type, sync statuses, and the time of the last sync for each record type in the grid list.
From this tab, you can easily perform cross-environment monitoring for all synced record types that you have access to view by switching between your connected environments, both local and remote. Drill down into a specific record type to view its sync history and any errors or warnings that occurred during the course of the sync activity.
The annotated screenshot provides a description of each grid column on the Record Sync Status tab.
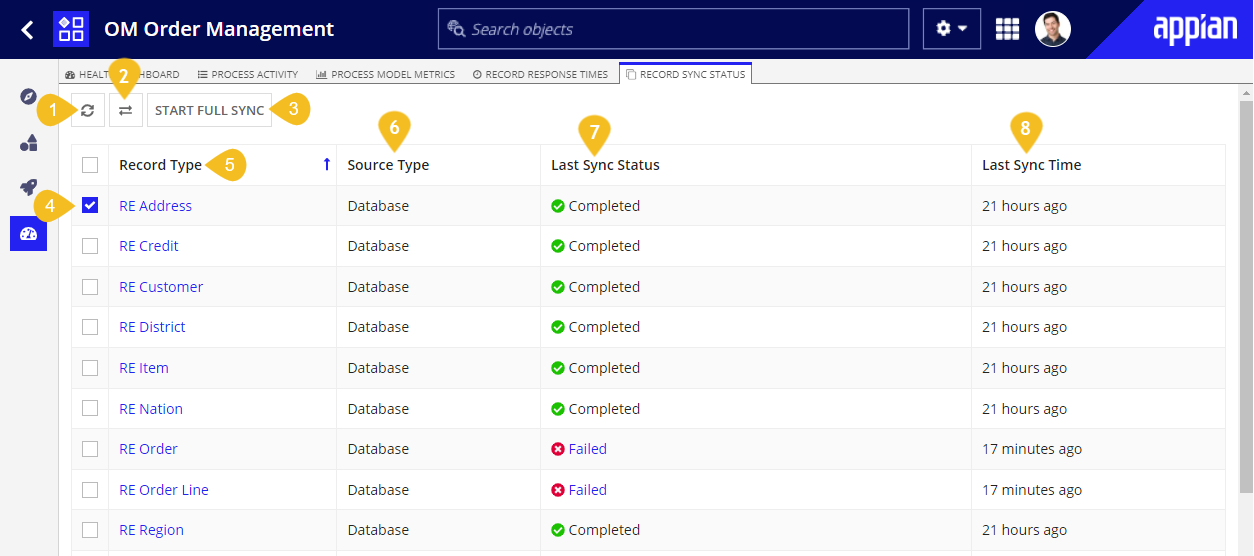
- Refresh button: Refreshes the sync statuses.
- Select Another Environment button: Allows you to select a local or remote connected environment and view the status information for all synced records in the selected environment.
- Start Sync button: Triggers a manual sync of the selected record type. The button appears only after you select a record type by checking the adjacent checkbox. If you do not have permission to edit the record type, the Start Sync button is disabled.
- Checkbox: Allows you to select a record type to sync using the Start Sync button.
- Record Type: A link displaying the name of the record type. Click the link to access the Sync History grid for the record type.
- Source Type: The data source for the record type. The possible source options are
Database, Salesforce or Expression.
-
Sync Status: The sync status of the record type. If the status is Failed or Failed and Skipped, you can click Failed next to the icon to open the Sync Alerts dialog. Possible statuses include:
| Icon |
Status |
Meaning |
|
Running |
A manual or scheduled sync is taking place, the record type is saving, or the record type is being imported to the environment. |
|
Completed |
A manual or scheduled sync, record type save, or record type import has successfully completed. |
|
Failed |
An error occurred while attempting to sync the record type and the record type is unavailable. For information on solving errors with your sync, see Troubleshooting Syncs. |
|
Failed and Skipped |
An error occurred while attempting to sync the record type, but the record type is still available. Since this sync was skipped, queries will return data from the most recent successful sync. For information on solving errors with your sync, see Troubleshooting Syncs. |
|
Failed and Retrying |
The sync initially failed and the system will retry a few times before failing. After failing, the record type will be unavailable. For information on solving errors with your sync, see Troubleshooting Syncs. |
|
Approaching Limit |
The record type was able to sync but it's approaching the row limit. |
|
Limit Reached |
The record type was able to sync but the row limit has been reached. |
- Last Sync: The amount of time that has passed since the record type last synced.
Monitoring synced records across environments
As an administrator, you need a way to restart a sync for a record type in a remote environment. You also need a way to quickly view the statuses, sync history, and errors associated with your synced record types across multiple environments. This visibility allows you to easily resolve issues that cause your syncs to fail.
The Select Another Environment button on the Record Sync Status page opens the Select Environment dialog, which lists all of your local and remote connected environments.
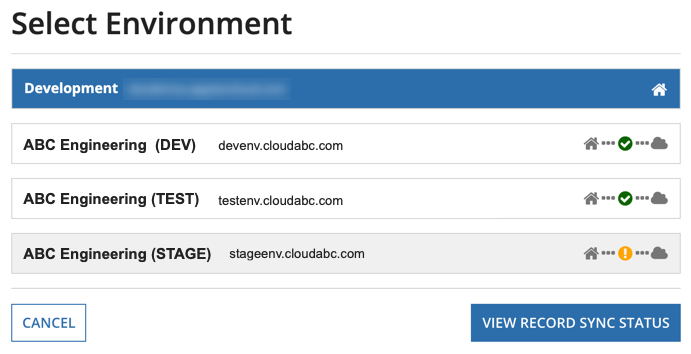
After you select a specific environment from the list, click VIEW RECORD SYNC STATUS to switch to the select environment and view the statuses for all of the synced record types deployed in the selected environment.
Note: You can view the status for synced record types if they have been deployed to an environment that allows a connection from Appian to the selected environment. See Managing Environments for more information.
The Record Sync Status tab will now show the sync statuses for all record types deployed in the selected environment only. In order to view synced records in a local environment, developers must have at least Viewer permissions to the record types. When connecting to a remote environment, developers only have access to the record types they have access to in the local environment.
Also note that only users with edit access to the record type in the selected environment can start a sync.
Record sync alerts dialog
When the sync status is Failed, you can click on the error icon in the Sync Status column to open the Record Type Sync Alerts dialog. This dialog provides more information and details about what went wrong with the sync.
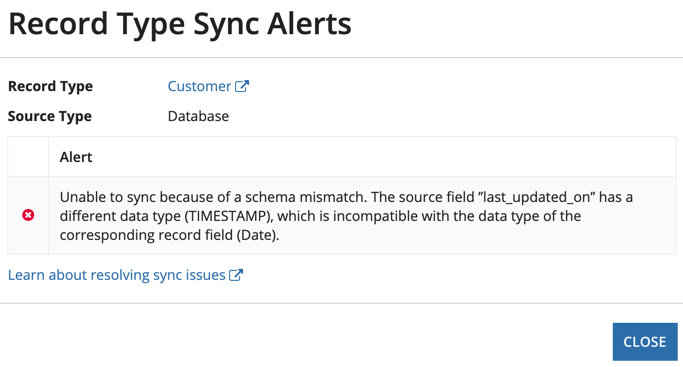
The alerts dialog displays information about your sync and any errors that occurred, and contains:
- Record Type: A link to the record type.
- Source Type: Possible values are
Database, Salesforce or Web Service.
- Initiated by: Depending on the type of sync, this value can be
System, Administrator, or the username of the user who started the sync.
- A grid displaying the error icon and the associated alert. Additional columns are displayed depending on the error that occurred:
- Caused By: This column is displayed when additional details are provided by the source to help you troubleshoot the error.
- Details: This column is displayed when a sync fails on a record type that uses a database table or Salesforce object as the source. If available, the column will provide a link to the process instance that updated the source data. The column will also display up to five of the primary keys from the source rows that were updated by the write operation, but not synced in Appian.
- Close button.
For information on resolving errors with your sync, see Troubleshooting Syncs.
Sync history
When you click into a specific record type in the grid list from the Record Sync Status tab, you are directed to the Sync History grid for the selected record type. This page shows information about the previous and currently running syncs for the record type.
You can also access this Sync History grid from the Data Sync tab in record type object.
Like the Record Sync Status tab, you can access any errors for your record type's syncs from within its history.
The annotated screenshot and descriptions below define the buttons and grid columns displayed in the Sync History grid page.
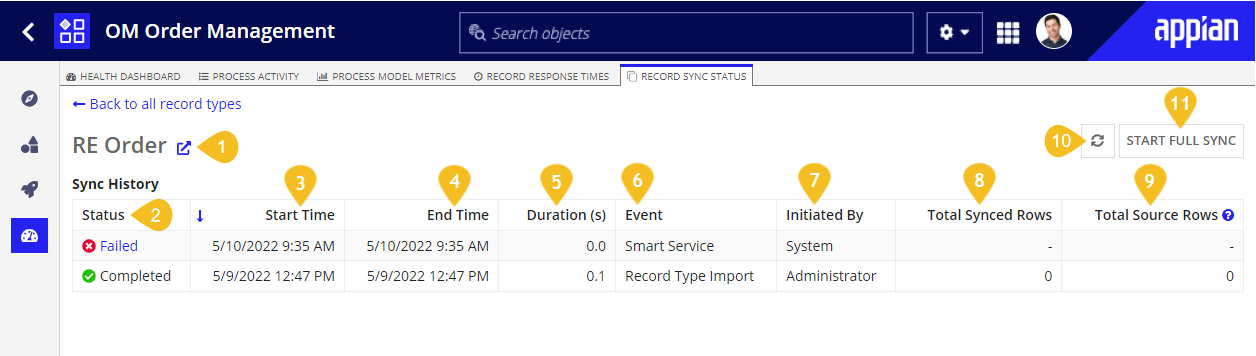
- Link to open the record type object.
-
Status: The sync status of the record type. If the status is Failed or Failed and Skipped, you can click the link to open the Sync Alerts dialog. Possible statuses include:
| Icon |
Status |
Meaning |
|
Running |
A manual or scheduled sync is taking place, the record type is saving, or the record type is being imported to the environment. |
|
Completed |
A manual or scheduled sync, record type save, or record type import has successfully completed. |
|
Failed |
An error occurred while attempting to sync the record type and the record type is unavailable. For information on solving errors with your sync, see Troubleshooting Syncs. |
|
Failed and Skipped |
An error occurred while attempting to sync the record type, but the record type is still available. Since this sync was skipped, queries will return data from the most recent successful sync. For information on solving errors with your sync, see Troubleshooting Syncs. |
|
Failed and Retrying |
The sync initially failed and the system will retry a few times before failing. After failing, the record type will be unavailable. For information on solving errors with your sync, see Troubleshooting Syncs. |
|
Approaching Limit |
The record type was able to sync but it's approaching the row limit. |
|
Limit Reached |
The record type was able to sync but the row limit has been reached. |
- Start Time: Displays the timestamp of when the sync started in the user's timezone. When checking the time of your scheduled sync, you may notice that it didn't occur at the exact time at which you scheduled it. There are a variety of possible causes:
- Limit for syncs running simultaneously:
If you have multiple record types scheduled to sync at the same time, not all of them can occur at exactly the scheduled time. Appian limits the number of simultaneous syncs running to 2 per application server. For example, if multiple record types are set to sync at 3:00 AM, one of the scheduled syncs may not complete until 3:02 or 3:10 AM. If you have other processes that have significant resource use scheduled to occur at this time, this may also cause your syncs to complete later than expected.
- Failed & retrying:
It is possible that something caused your sync to fail. In some cases, the system will try again before ultimately failing or successfully completing the sync. There are two possible methods of retrying:
- Batch Retry When a full sync occurs, the data is synced in batches of up to 1,000 records. If a single batch fails for any reason, the sync pauses and retries again only for the batch that failed. Overall it can retry up to twice for a single batch and a total of 10 times across all batches before it fails.
- Full Retry In addition to retrying a single batch, the system will also retry the entire sync in situations where it's likely to succeed. For example, if your sync failed because of a connection issue, Appian will try to sync again; however, if the sync failed because of a schema mismatch, the sync will not retry. If a completed sync had to retry multiple times, it may be a few minutes behind schedule.
- Check your timezone:
Make sure that you selected the right timezone when you set up your scheduled sync. If not, you can change this by editing the sync schedule settings in Data Sync.
- Daylight savings time:
If your timezone or region observes daylight savings and your sync is scheduled for one of the hours in which daylight savings time changes, your sync may not run when the time changes. To avoid this, choose a time after 2 AM.
- End Time: Displays the timestamp of when the sync ended in the user's timezone.
- Duration: The total time (in seconds) that it took the record type to sync.
- Events: The event that triggered the update. The possible events are:
- Initiated By: Depending on the type of sync, this value can be
System, Administrator, or the username of the user who started the sync. Only users with access to edit the record type will be able to view the Initiated By column.
- If the value is Administrator or a username, the sync was triggered by clicking START FULL SYNC, saving the record type, or by importing a record type.
- If the value is System, the system initiated the sync by writing data from Appian to your source, using a scheduled full sync, or by retrying a failed sync.
- Total Synced Records: The record count from the sync at the end of the sync.
- Total Source Rows: The record count from the source at the time of the sync.
- Refresh button: Refreshes the entire page.
- Start Sync button: Triggers a manual sync of the record type. If you do not have at least Editor permissions to the record type, this button is disabled.
You can sort the results in the Sync History grid by Start Time, End Time, Duration, Total Synced Records, and Total Source Rows.
See also
