| The capabilities described on this page are included in Appian's advanced and premium capability tiers. Usage limits may apply. |
This page applies to business users. It describes what actions are available on the Data Catalog page of Process HQ.
Note: To see this page, you must be in the Data Fabric Report Creators system group.
OverviewCopy link to clipboard
The Data Catalog page allows you to explore the breadth of your data fabric. Here, you can build custom reports by selecting a dataset or using a guided experience to pick and format your report data.
To access this page, select Process HQ from the navigation menu in the Appian header bar, then click Data Catalog in the navigation bar.
ElementsCopy link to clipboard
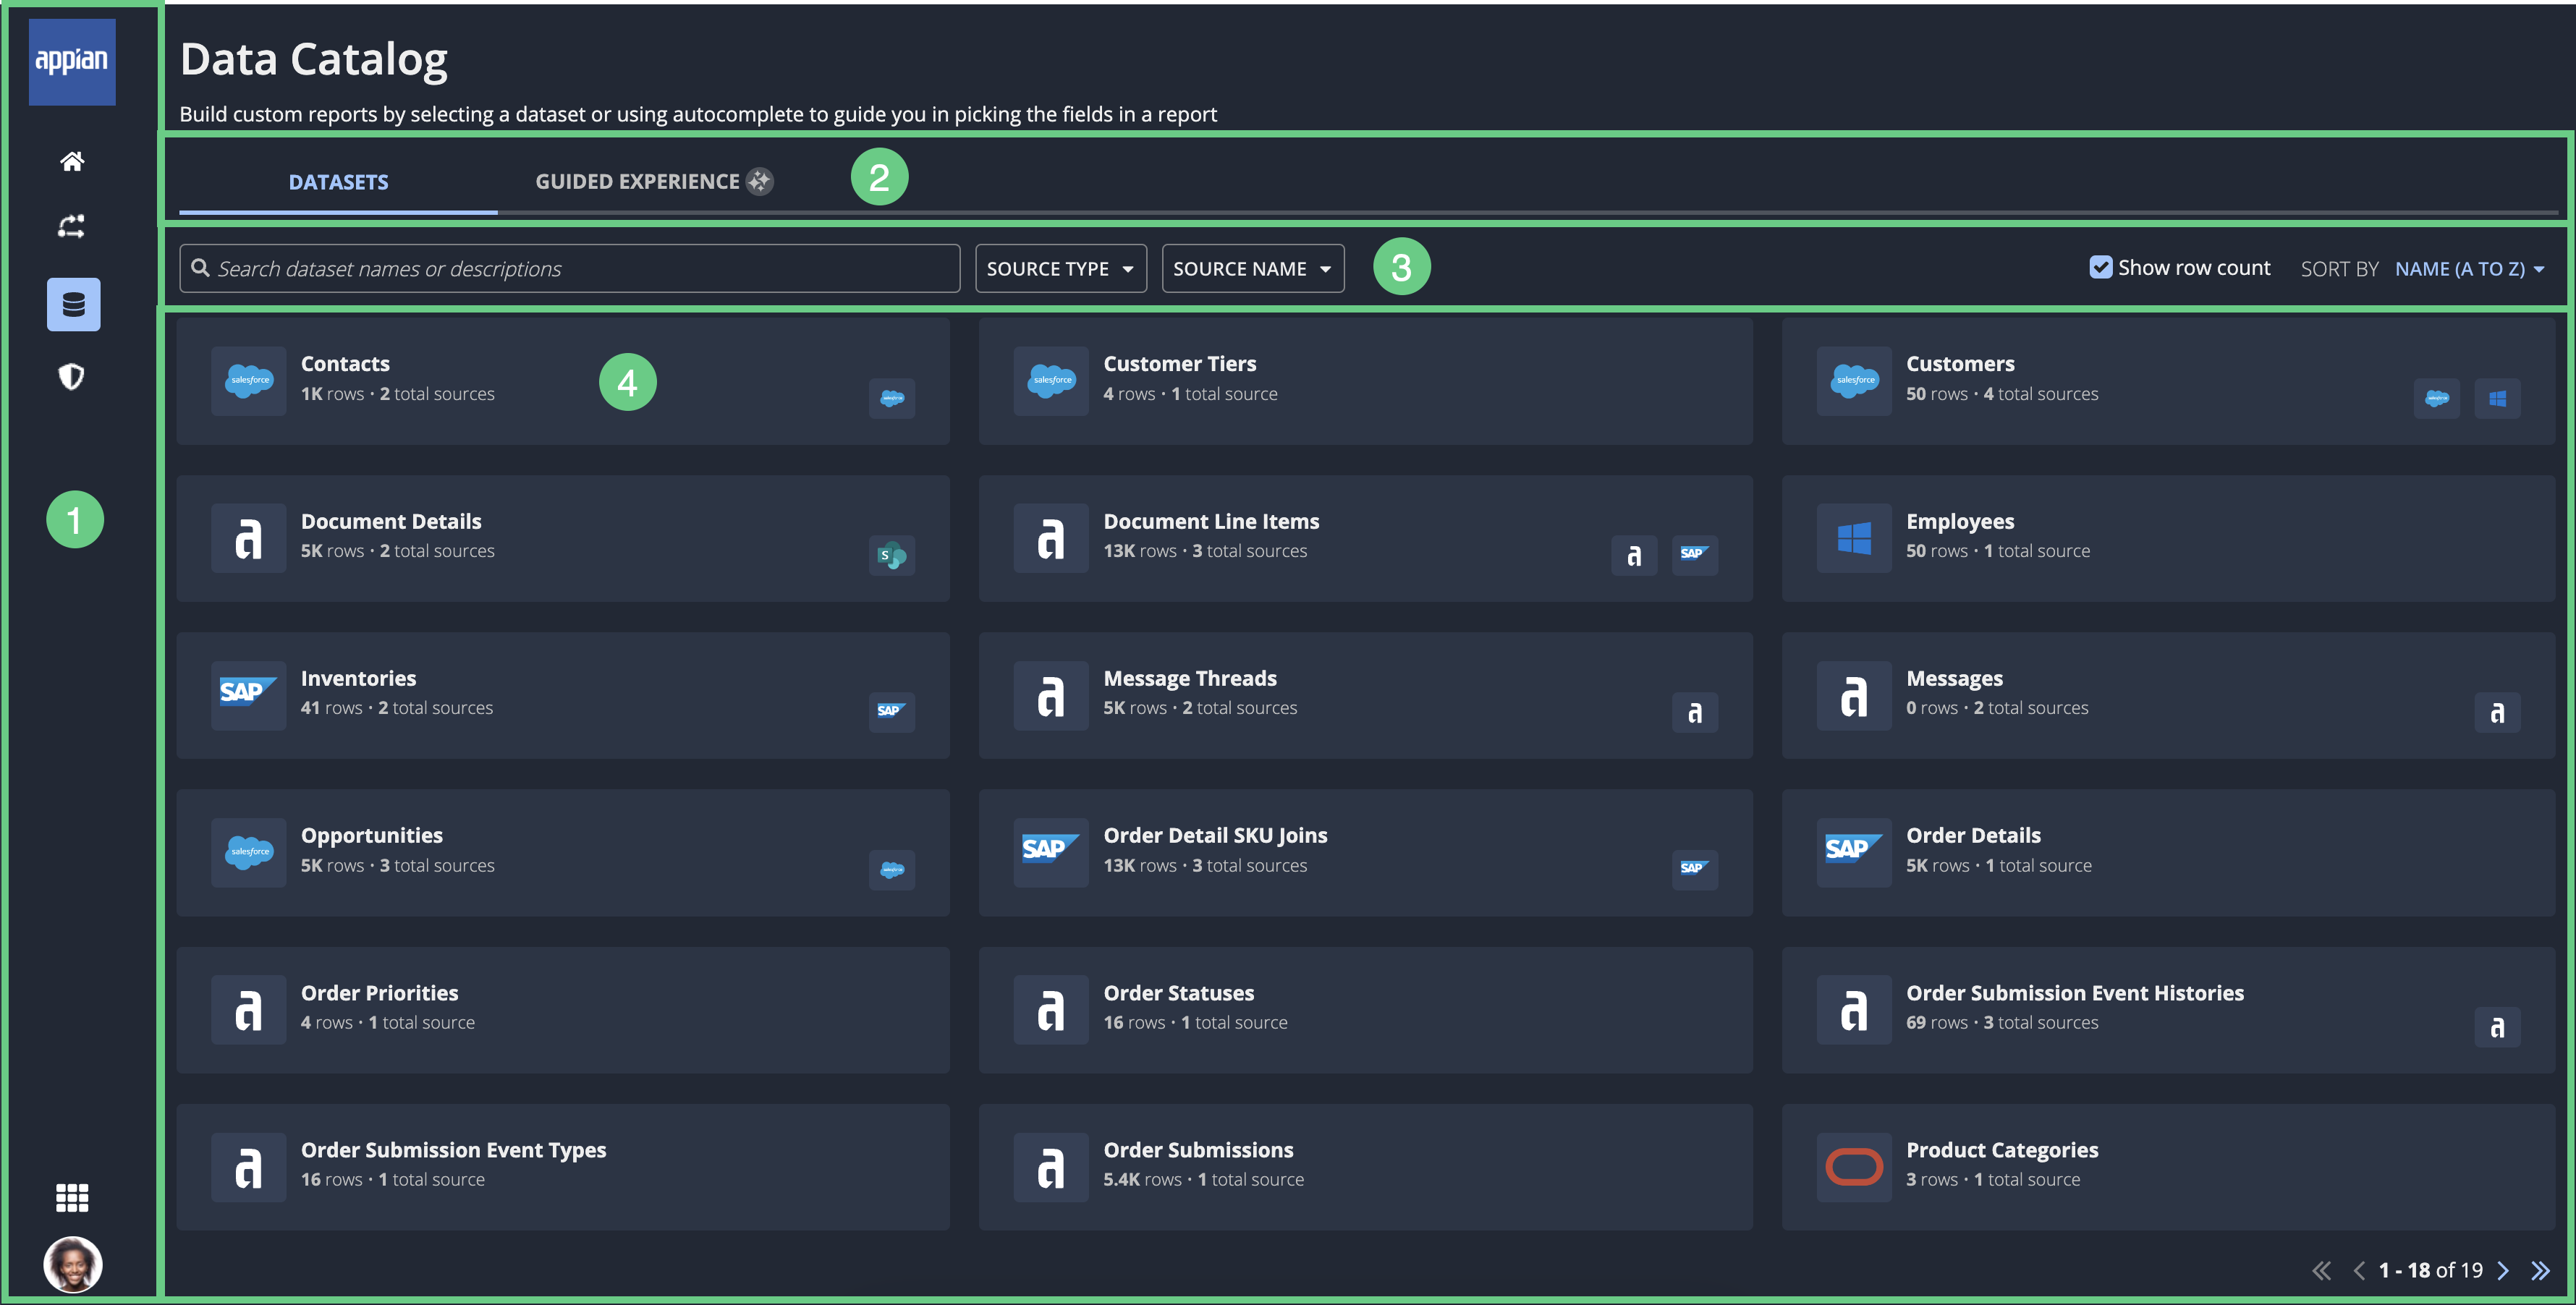
The following image highlights the elements that make up this page:
# |
Element |
Actions Available |
|---|---|---|
1 |
Navigation bar |
|
2 |
Tabs |
Go to the following tabs:
|
3 |
Toolbar |
|
4 |
List of datasets |
Click a dataset to start building a report. |
Search for a datasetCopy link to clipboard
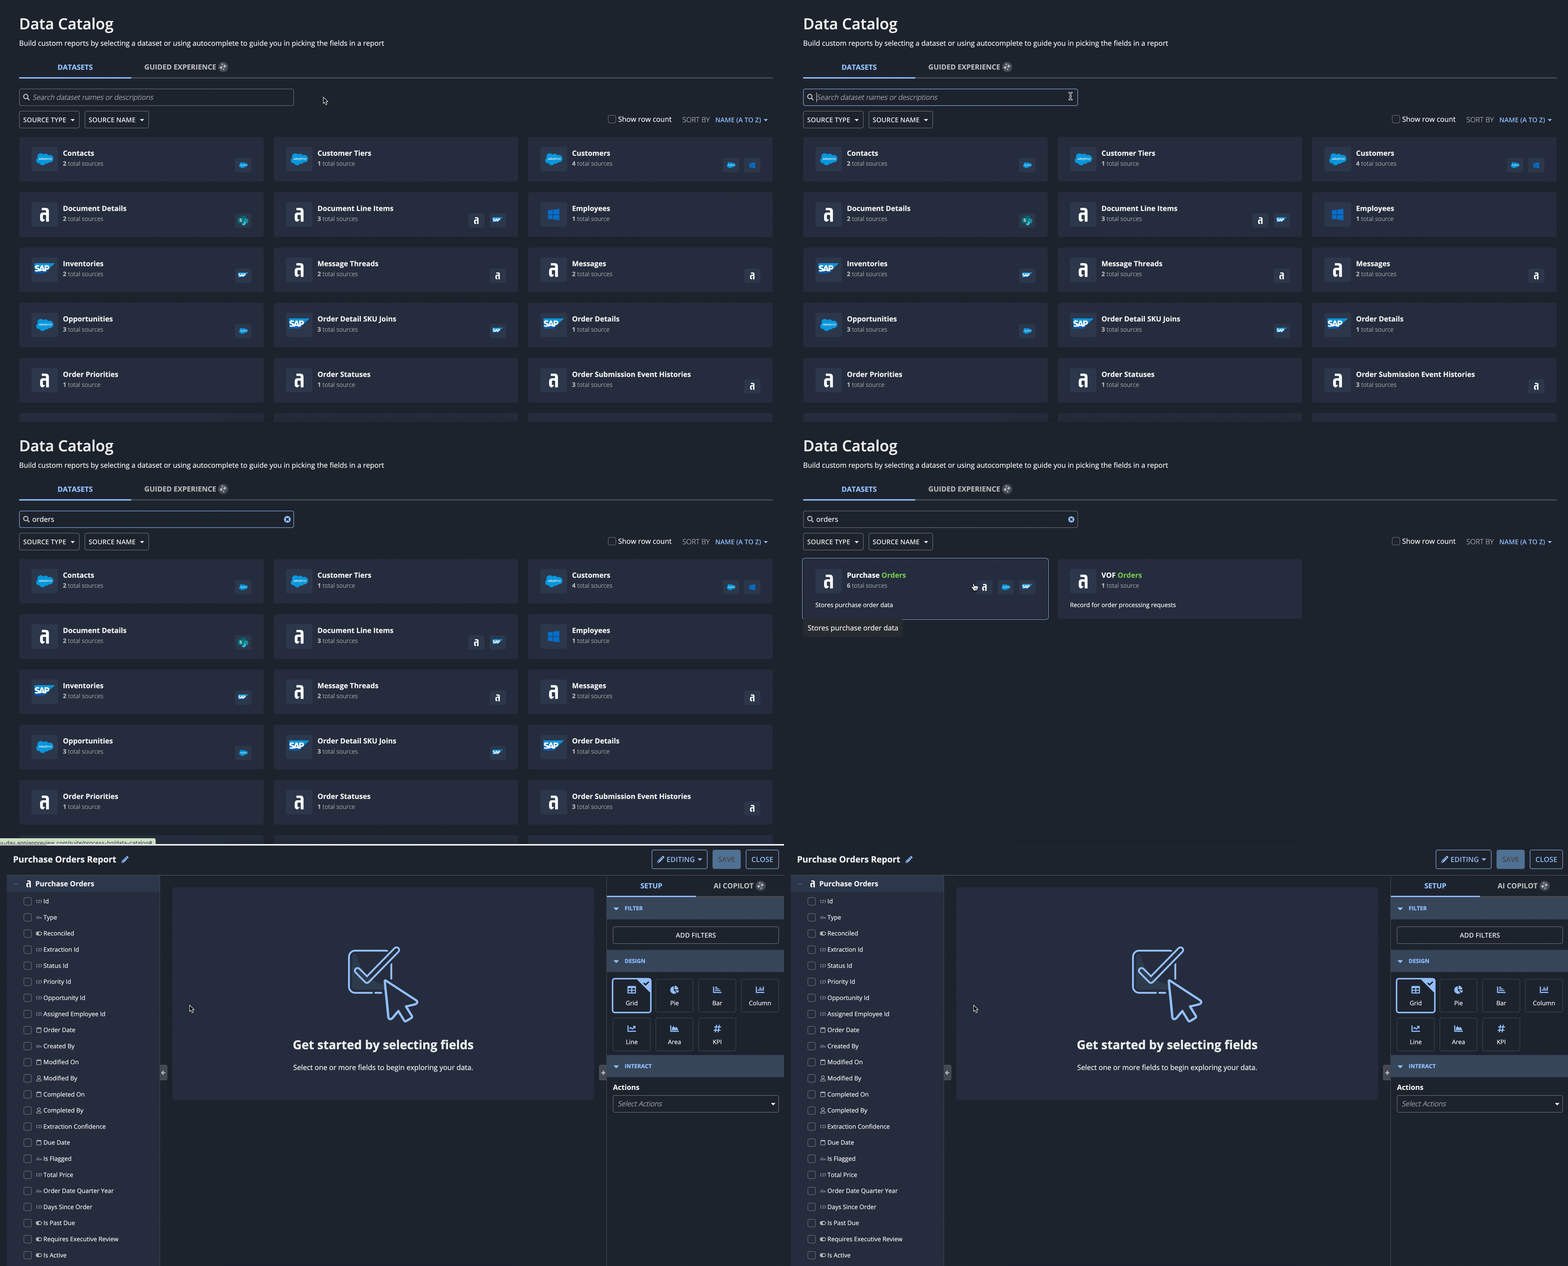
To search for a dataset, go to the Datasets tab and enter the name or description of the dataset in the search box.
Filter the list of datasetsCopy link to clipboard
In the toolbar of the Datasets tab, use the following filters:
- Source Type: Filter by the type of data source: database, Salesforce, or web service.
- Source Name: Filter by the name of the data source.
Show the row countCopy link to clipboard
By default, the row count for each dataset is hidden.
To show the row count on each dataset, go to the Dataset tab and select the Show row count checkbox.
Create a report by clicking a datasetCopy link to clipboard
If you're already familiar with the data you need, you can select that data from the Datasets tab to immediately start building a report.
Create a report using a guided experienceCopy link to clipboard
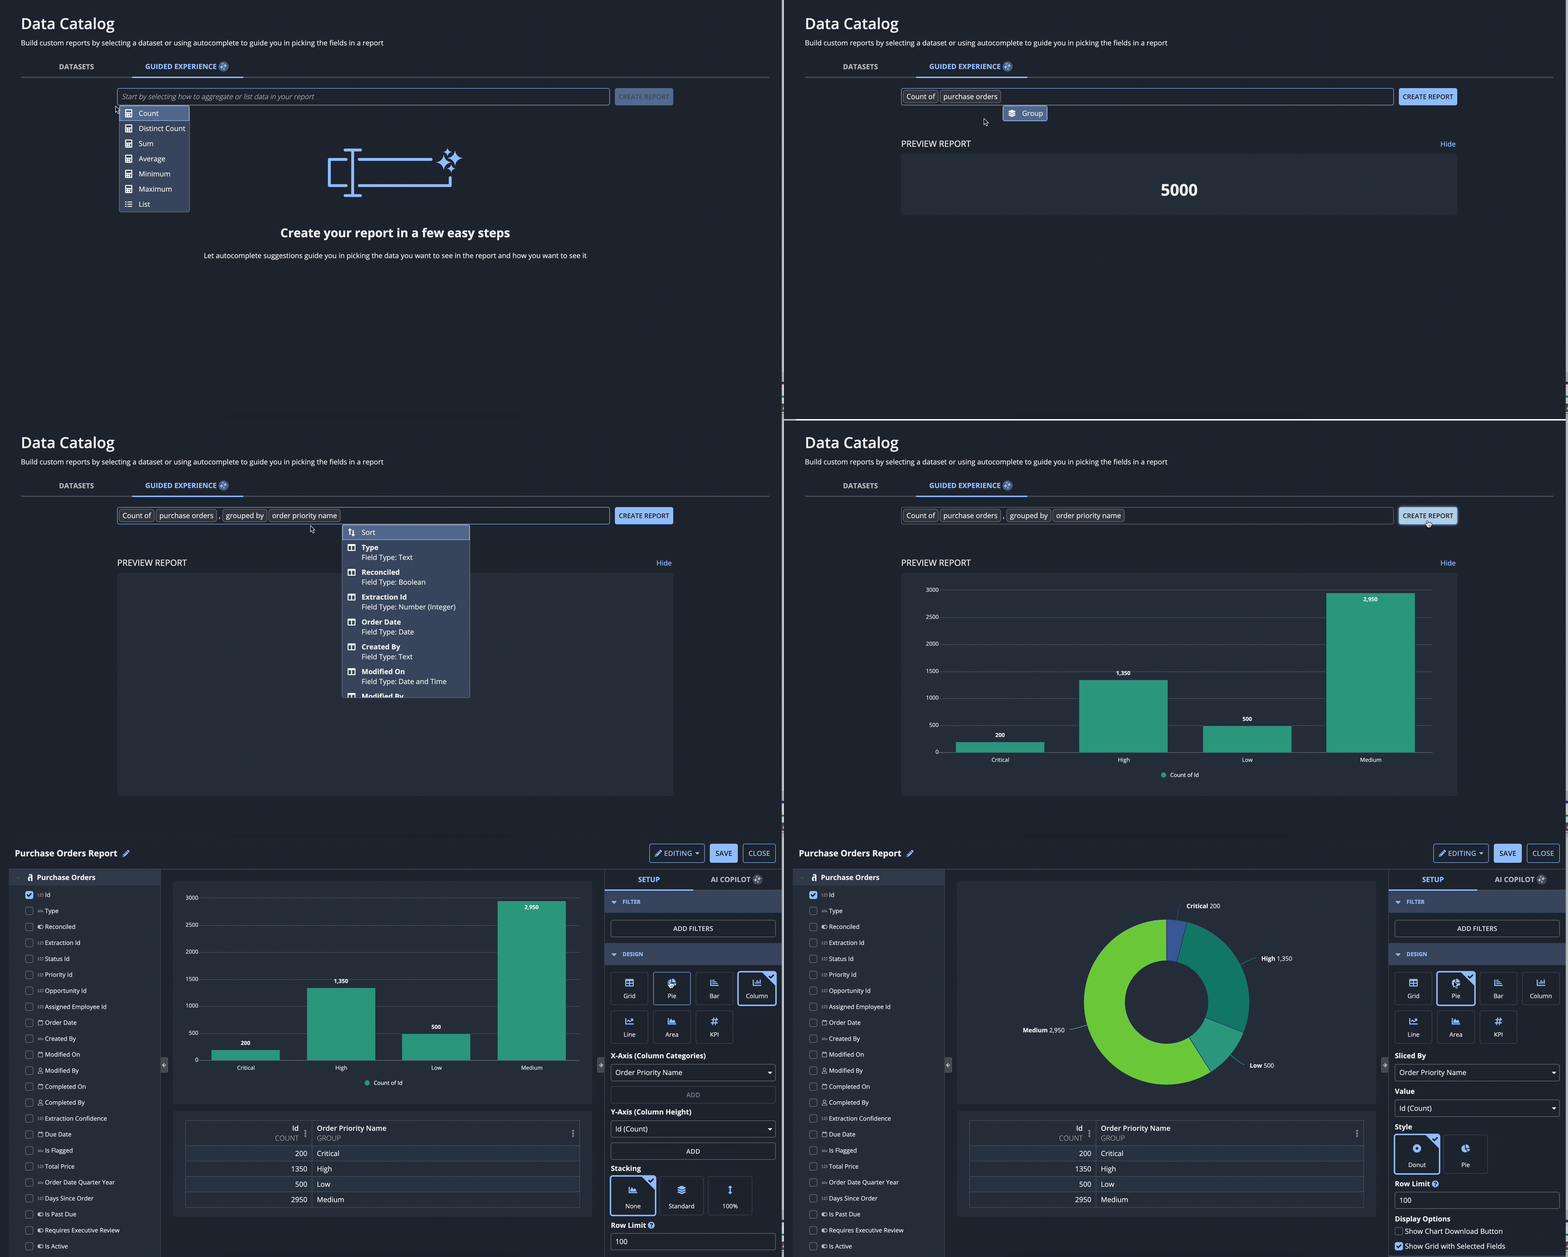
If you aren't familiar with the data you need in a report, you can explore your enterprise data using a guided experience.
From the Guided Experience tab, you can pick and format report data using autocomplete suggestions. As you select different options, you'll see a real-time preview of the report. When you're ready, click CREATE REPORT to continue refining and exploring the data.
Manage reportsCopy link to clipboard
Once you create a report, you can:
- Partner with Appian AI Copilot to discover new insights about the report.
- Save the report for future exploration.
- Share the report with all report creators.
- Add the report to a dashboard.


