| This content applies solely to Connected Claims, which must be purchased separately from the Appian base platform. |
Getting startedCopy link to clipboard
The Connected Claims Continuous Improvement module provides actionable insights into claim processes. The module provides a glimpse at how processes are functioning, as well as the ability to compare them historically. The Continuous Improvement module analyzes the data from other modules to provide insights on each of your lines of business.
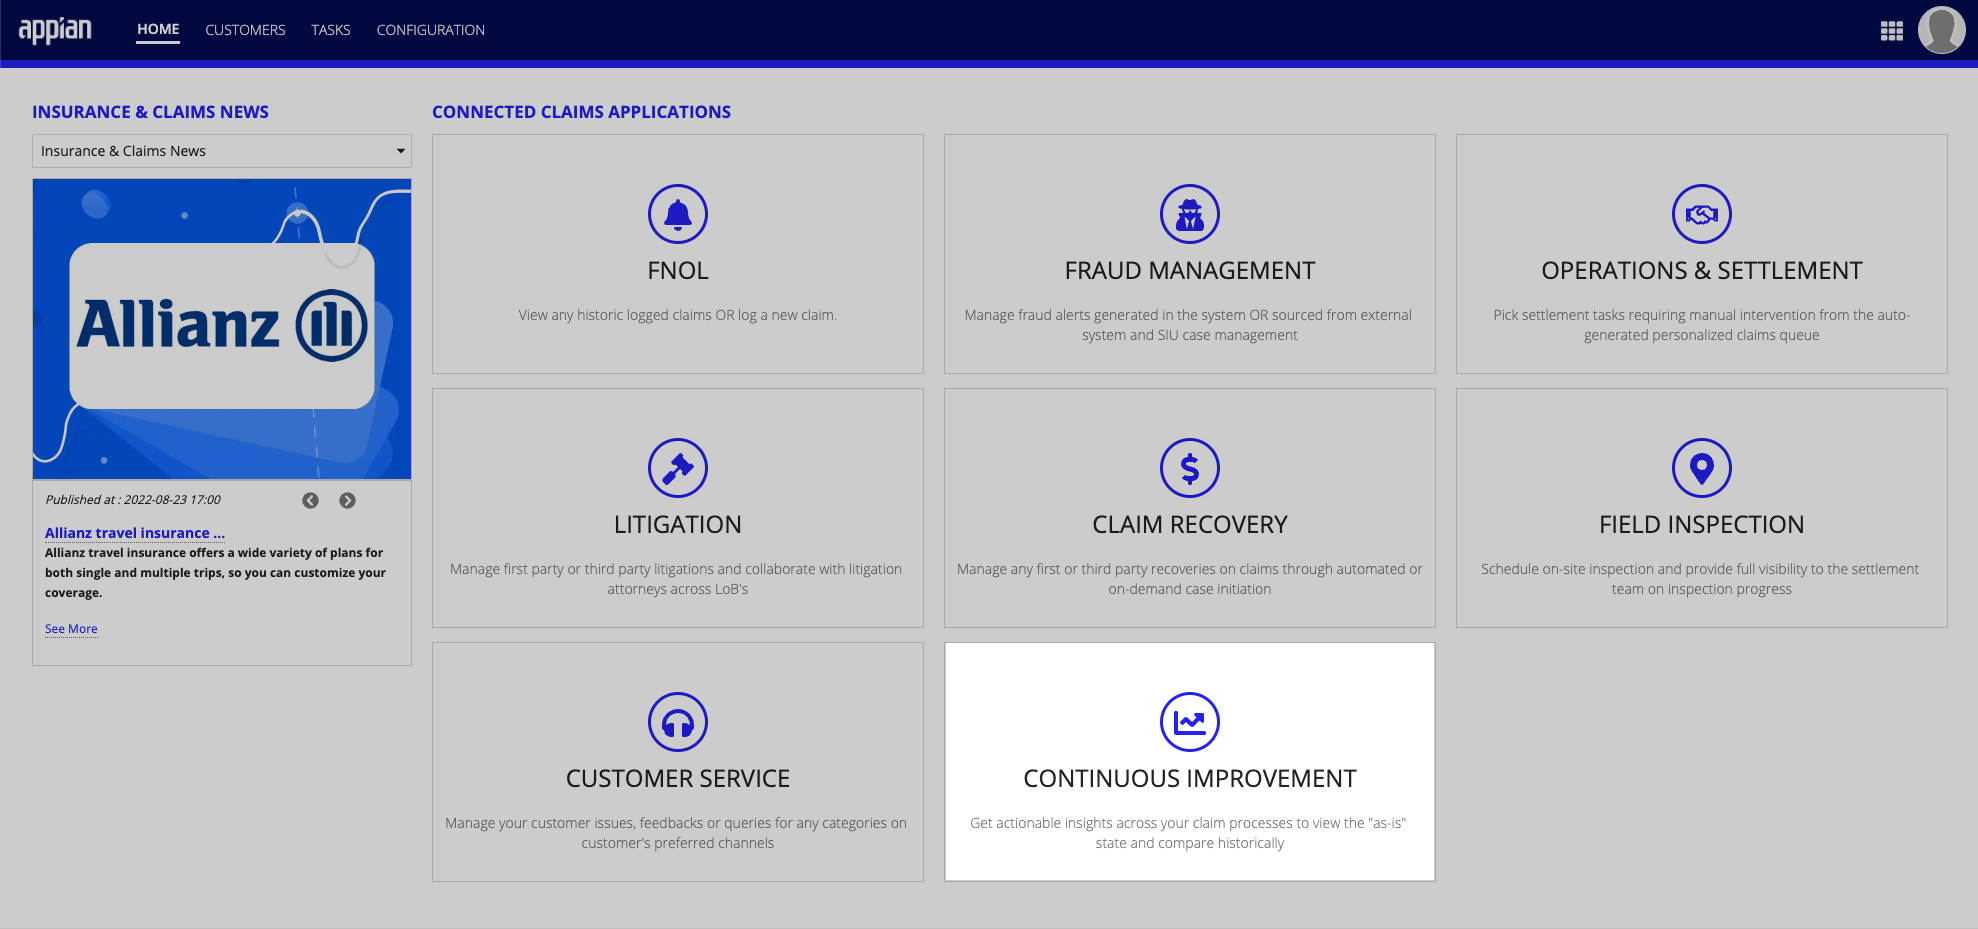
This guide demonstrates the pages and views available within the Continuous Improvement module. Note that your specific implementation of the Connected Claims application may have more or less functionality.
Data ViewsCopy link to clipboard
When viewing a line of business, several different data views are available. Each view is explained in its own section.

- [### Summary]
- [### As Is Workflow]
- [### Request Time Analysis]
- [### Milestone Time Analysis]
- [### Prediction]
- [### Version Comparison]
SummaryCopy link to clipboard
A summary view that aggregates information across all your claims for the selected line of business.
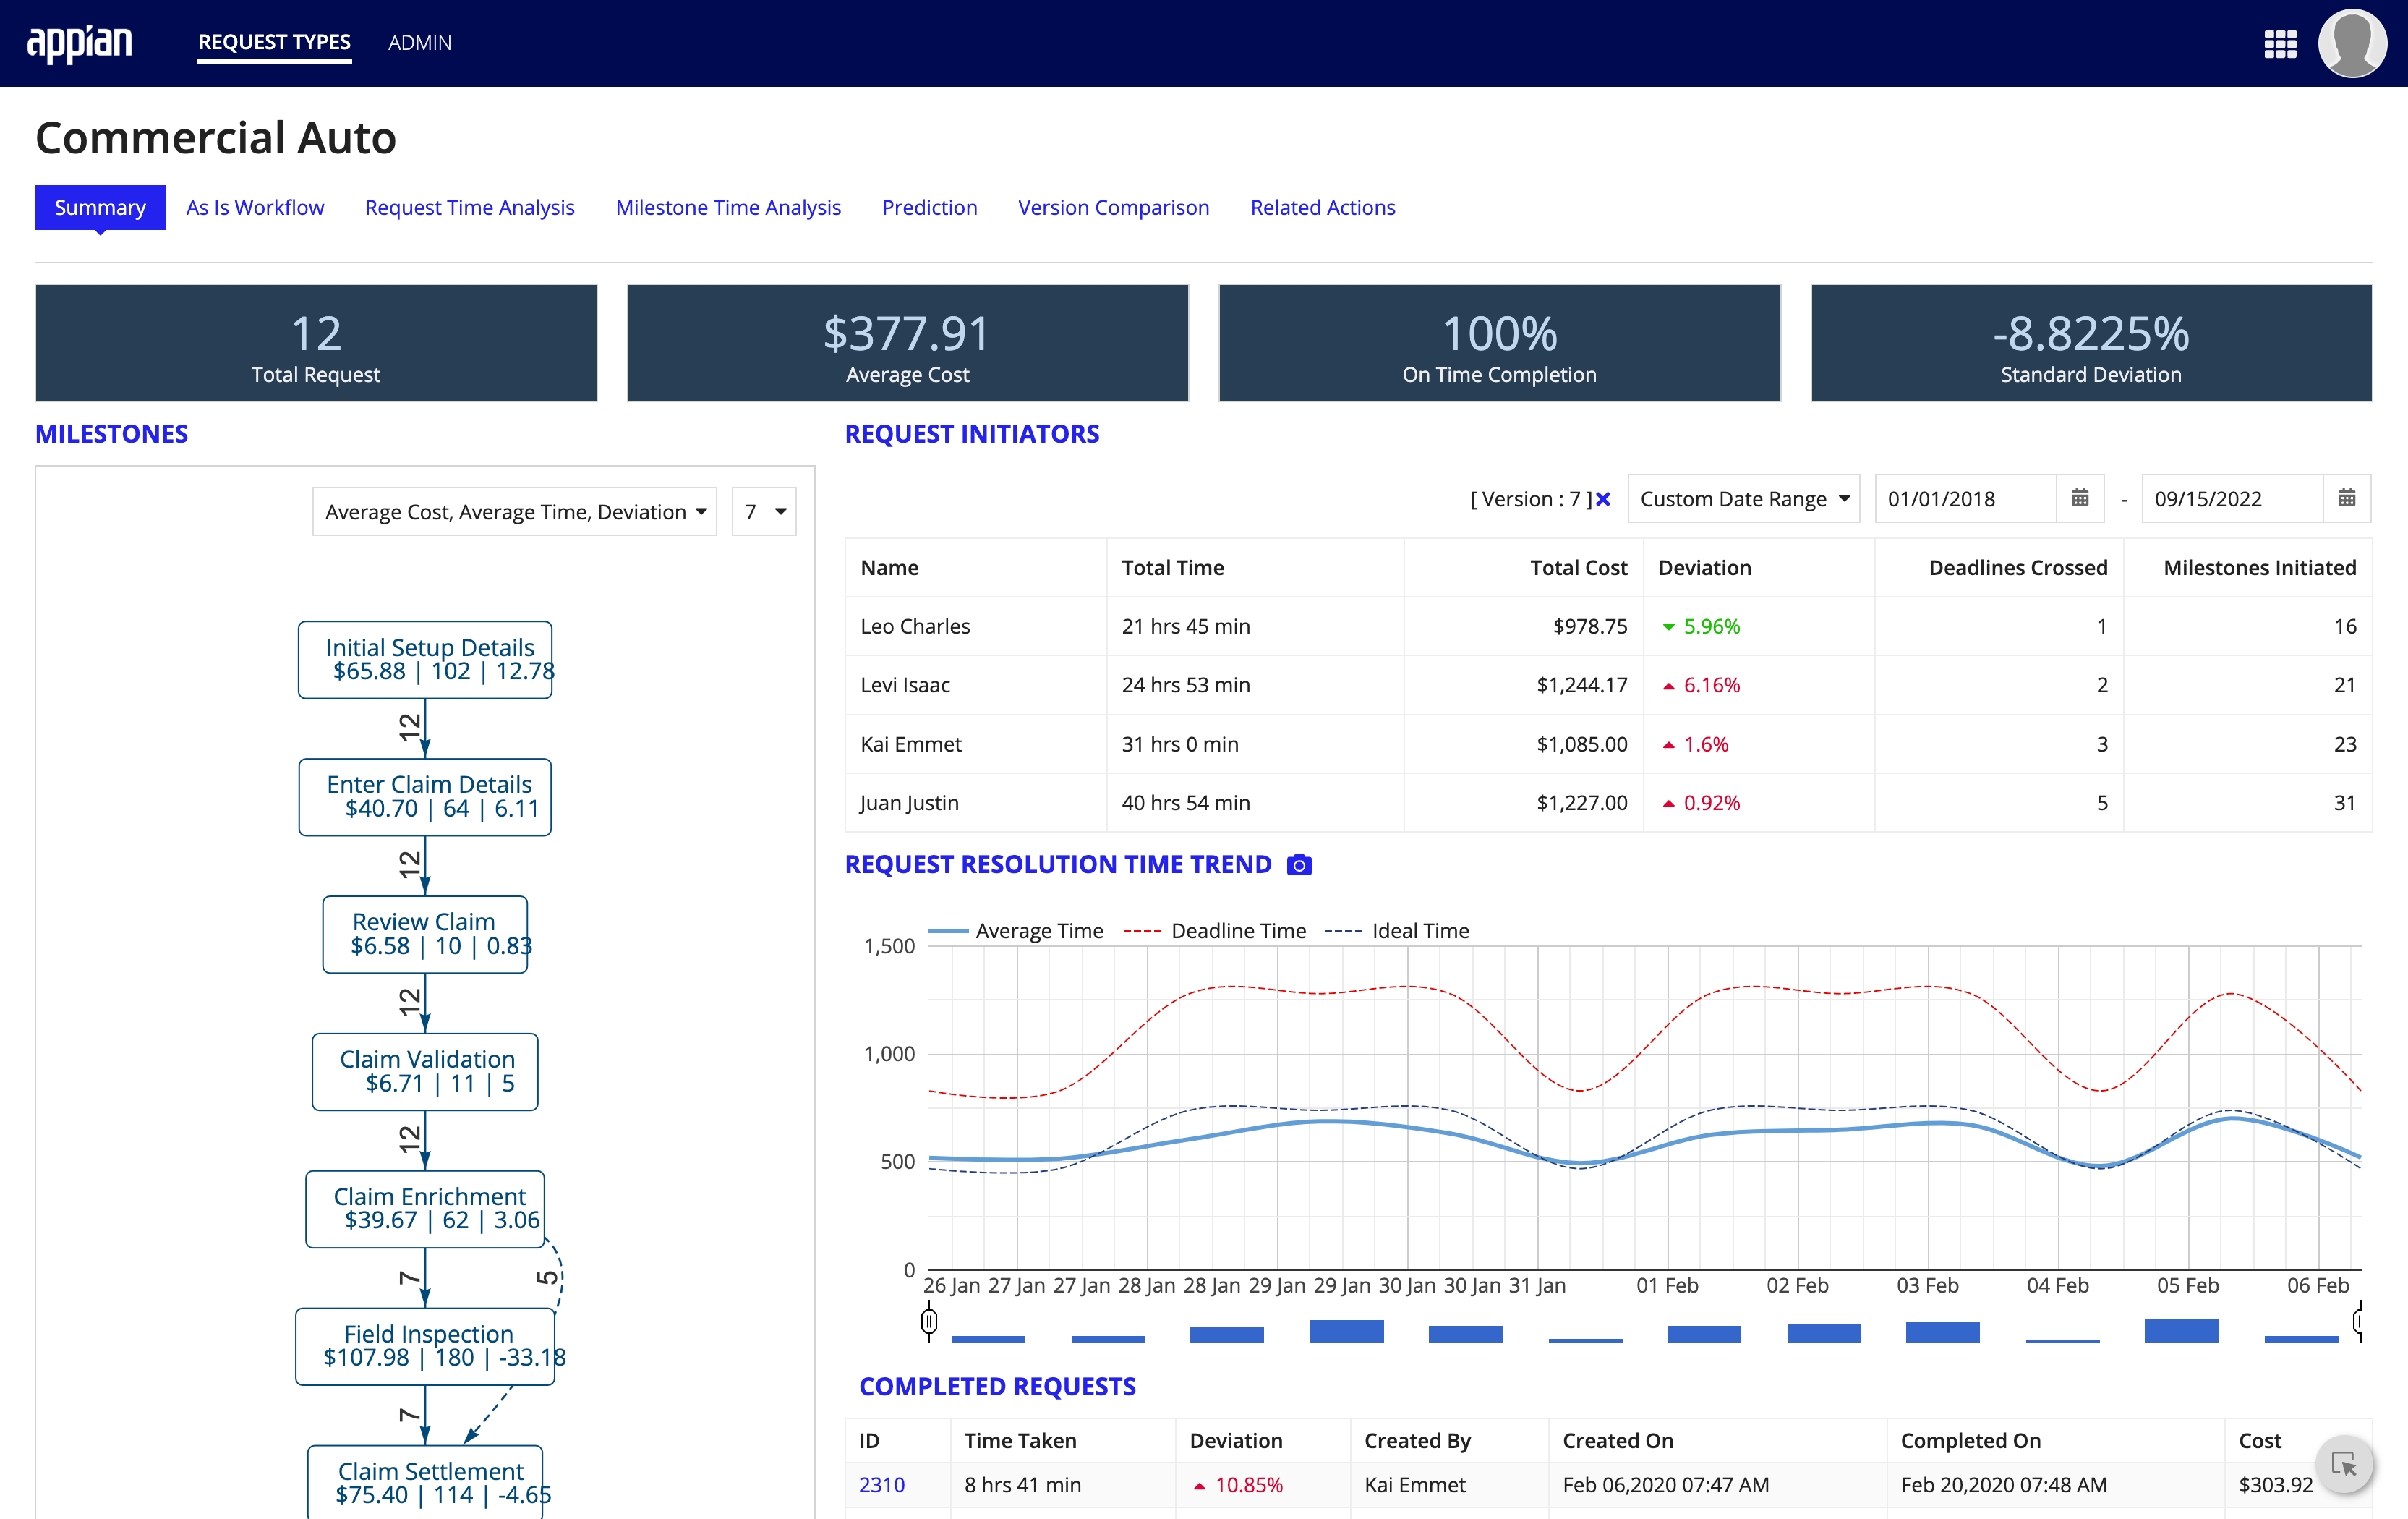
- MILESTONES: Events in the claim process flow that have been completed, in order.
- REQUEST INITIATORS: A breakdown of the insurance claim initiators and the time spent working on tasks.
- REQUEST RESOLUTION TIME TREND: A graph summarizing the milestone events accomplished over time. compared to deadline and ideal time to complete.
- COMPLETED REQUESTS: A table of completed requests, including how long they took, when it was initiated, and when it was completed.
- DEVIATION TREND: A pie chart of the deviation for tasks completed on time.
- REQUEST INITIATED BY USER: A bar graph of initiated requests, broken down by initator.
- VERSION TREND: A graph summarizing the time to complete claims across different versions of the same work flow.
Clicking each piece of data adjusts the summary view, allowing you to drill down into more detailed information.
As Is WorkflowCopy link to clipboard
A display of the current workflow configured for the selected line of business. Clicking each step in the workflow expands to show the multiple tasks within that event.
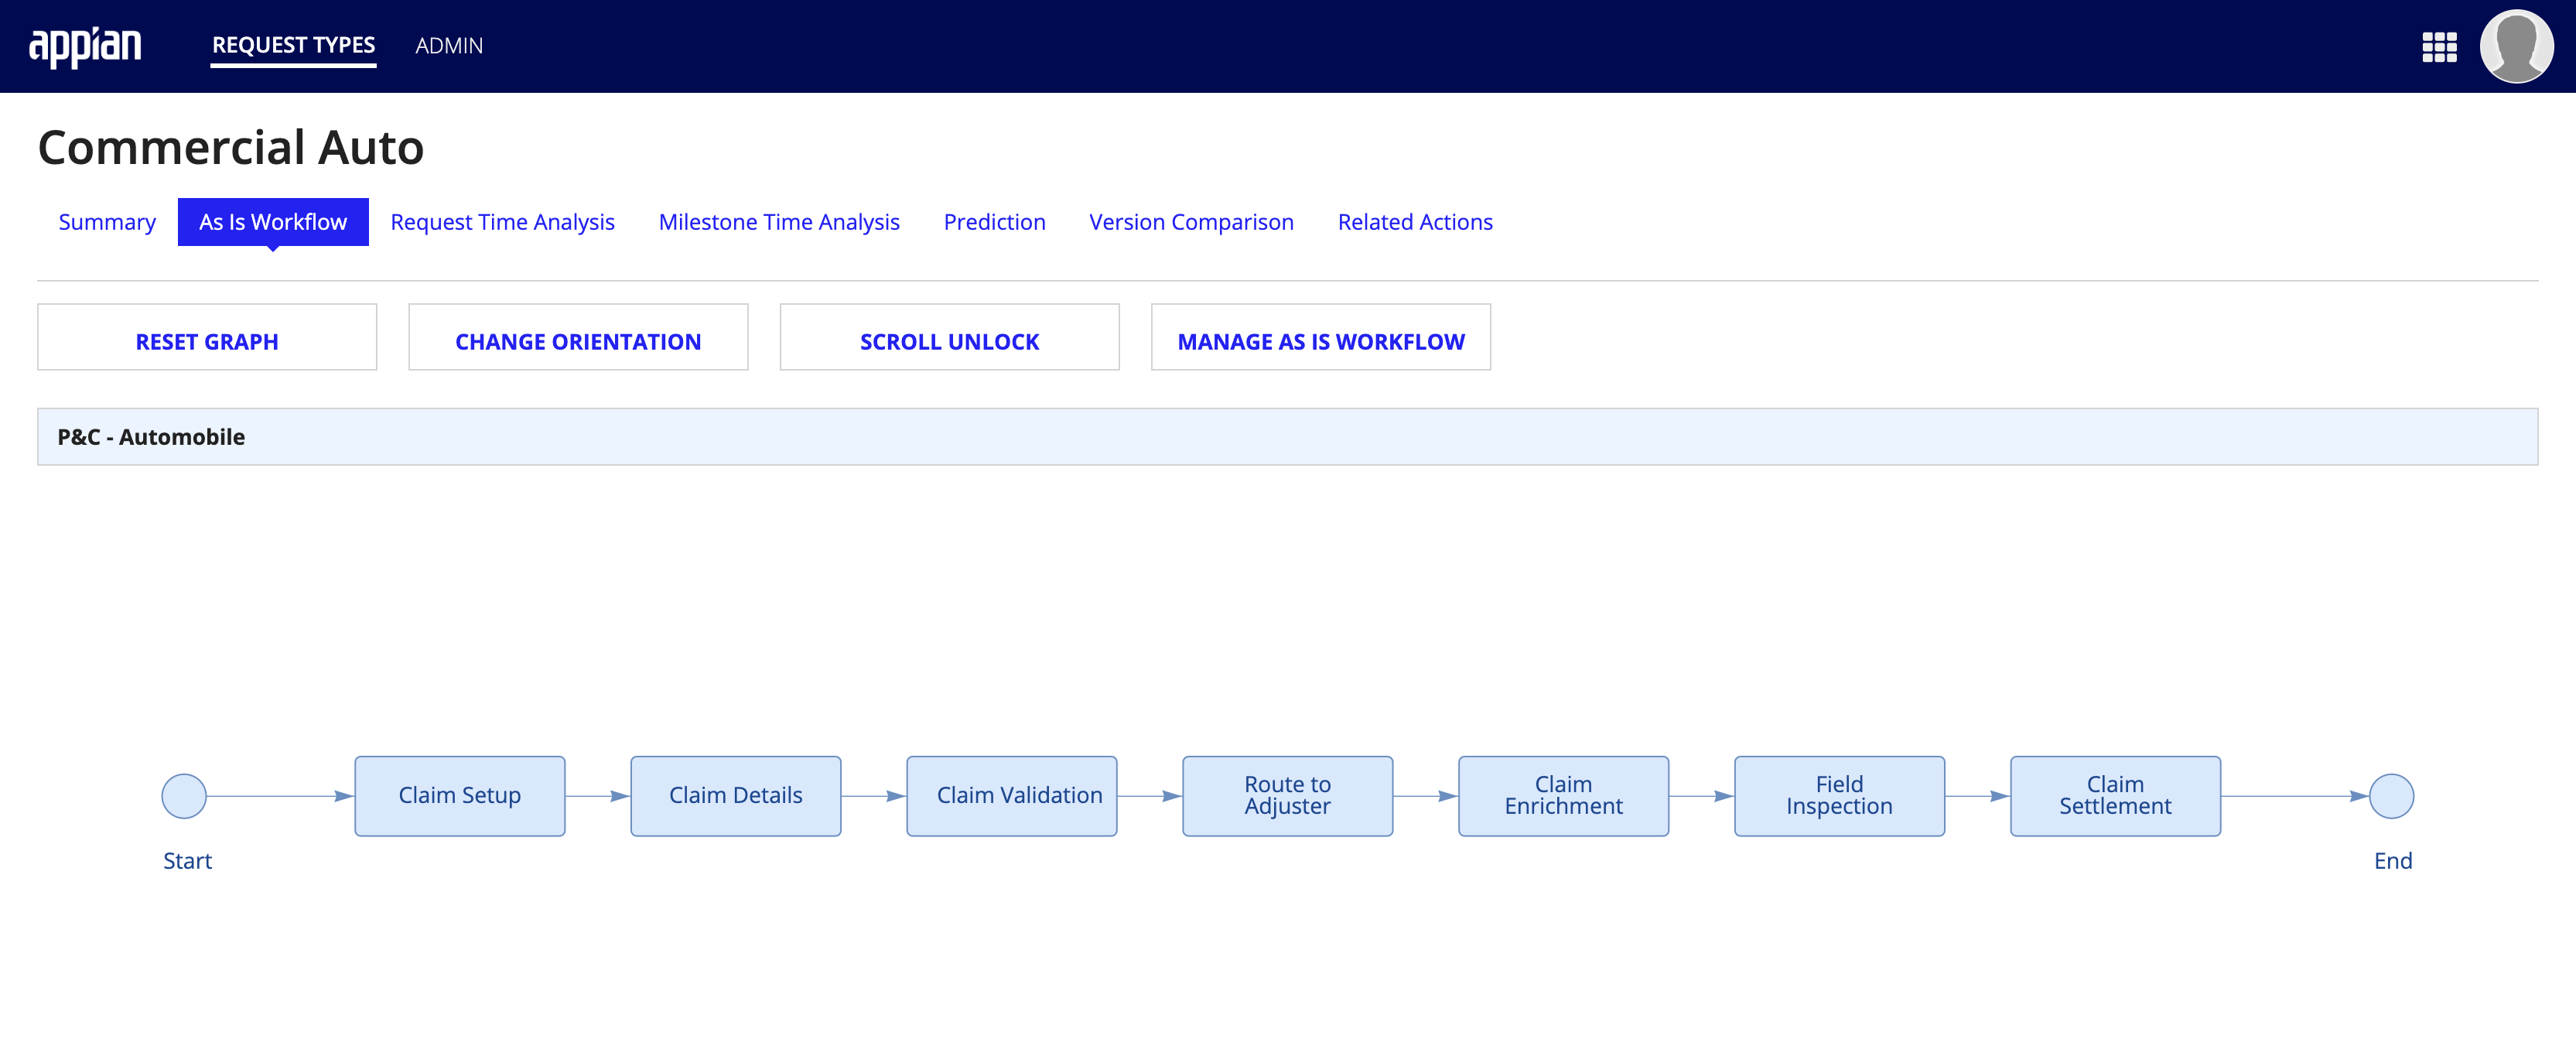
- RESET GRAPH: Resets the graph to the default view, closing any expanded events.
- CHANGE ORIENTATION: Toggles between vertical and horizontal views of the workflow.
- SCROLL UNLOCK: Toggles between locking and unlocking the ability to zoom in and out of the workflow using the scroll wheel.
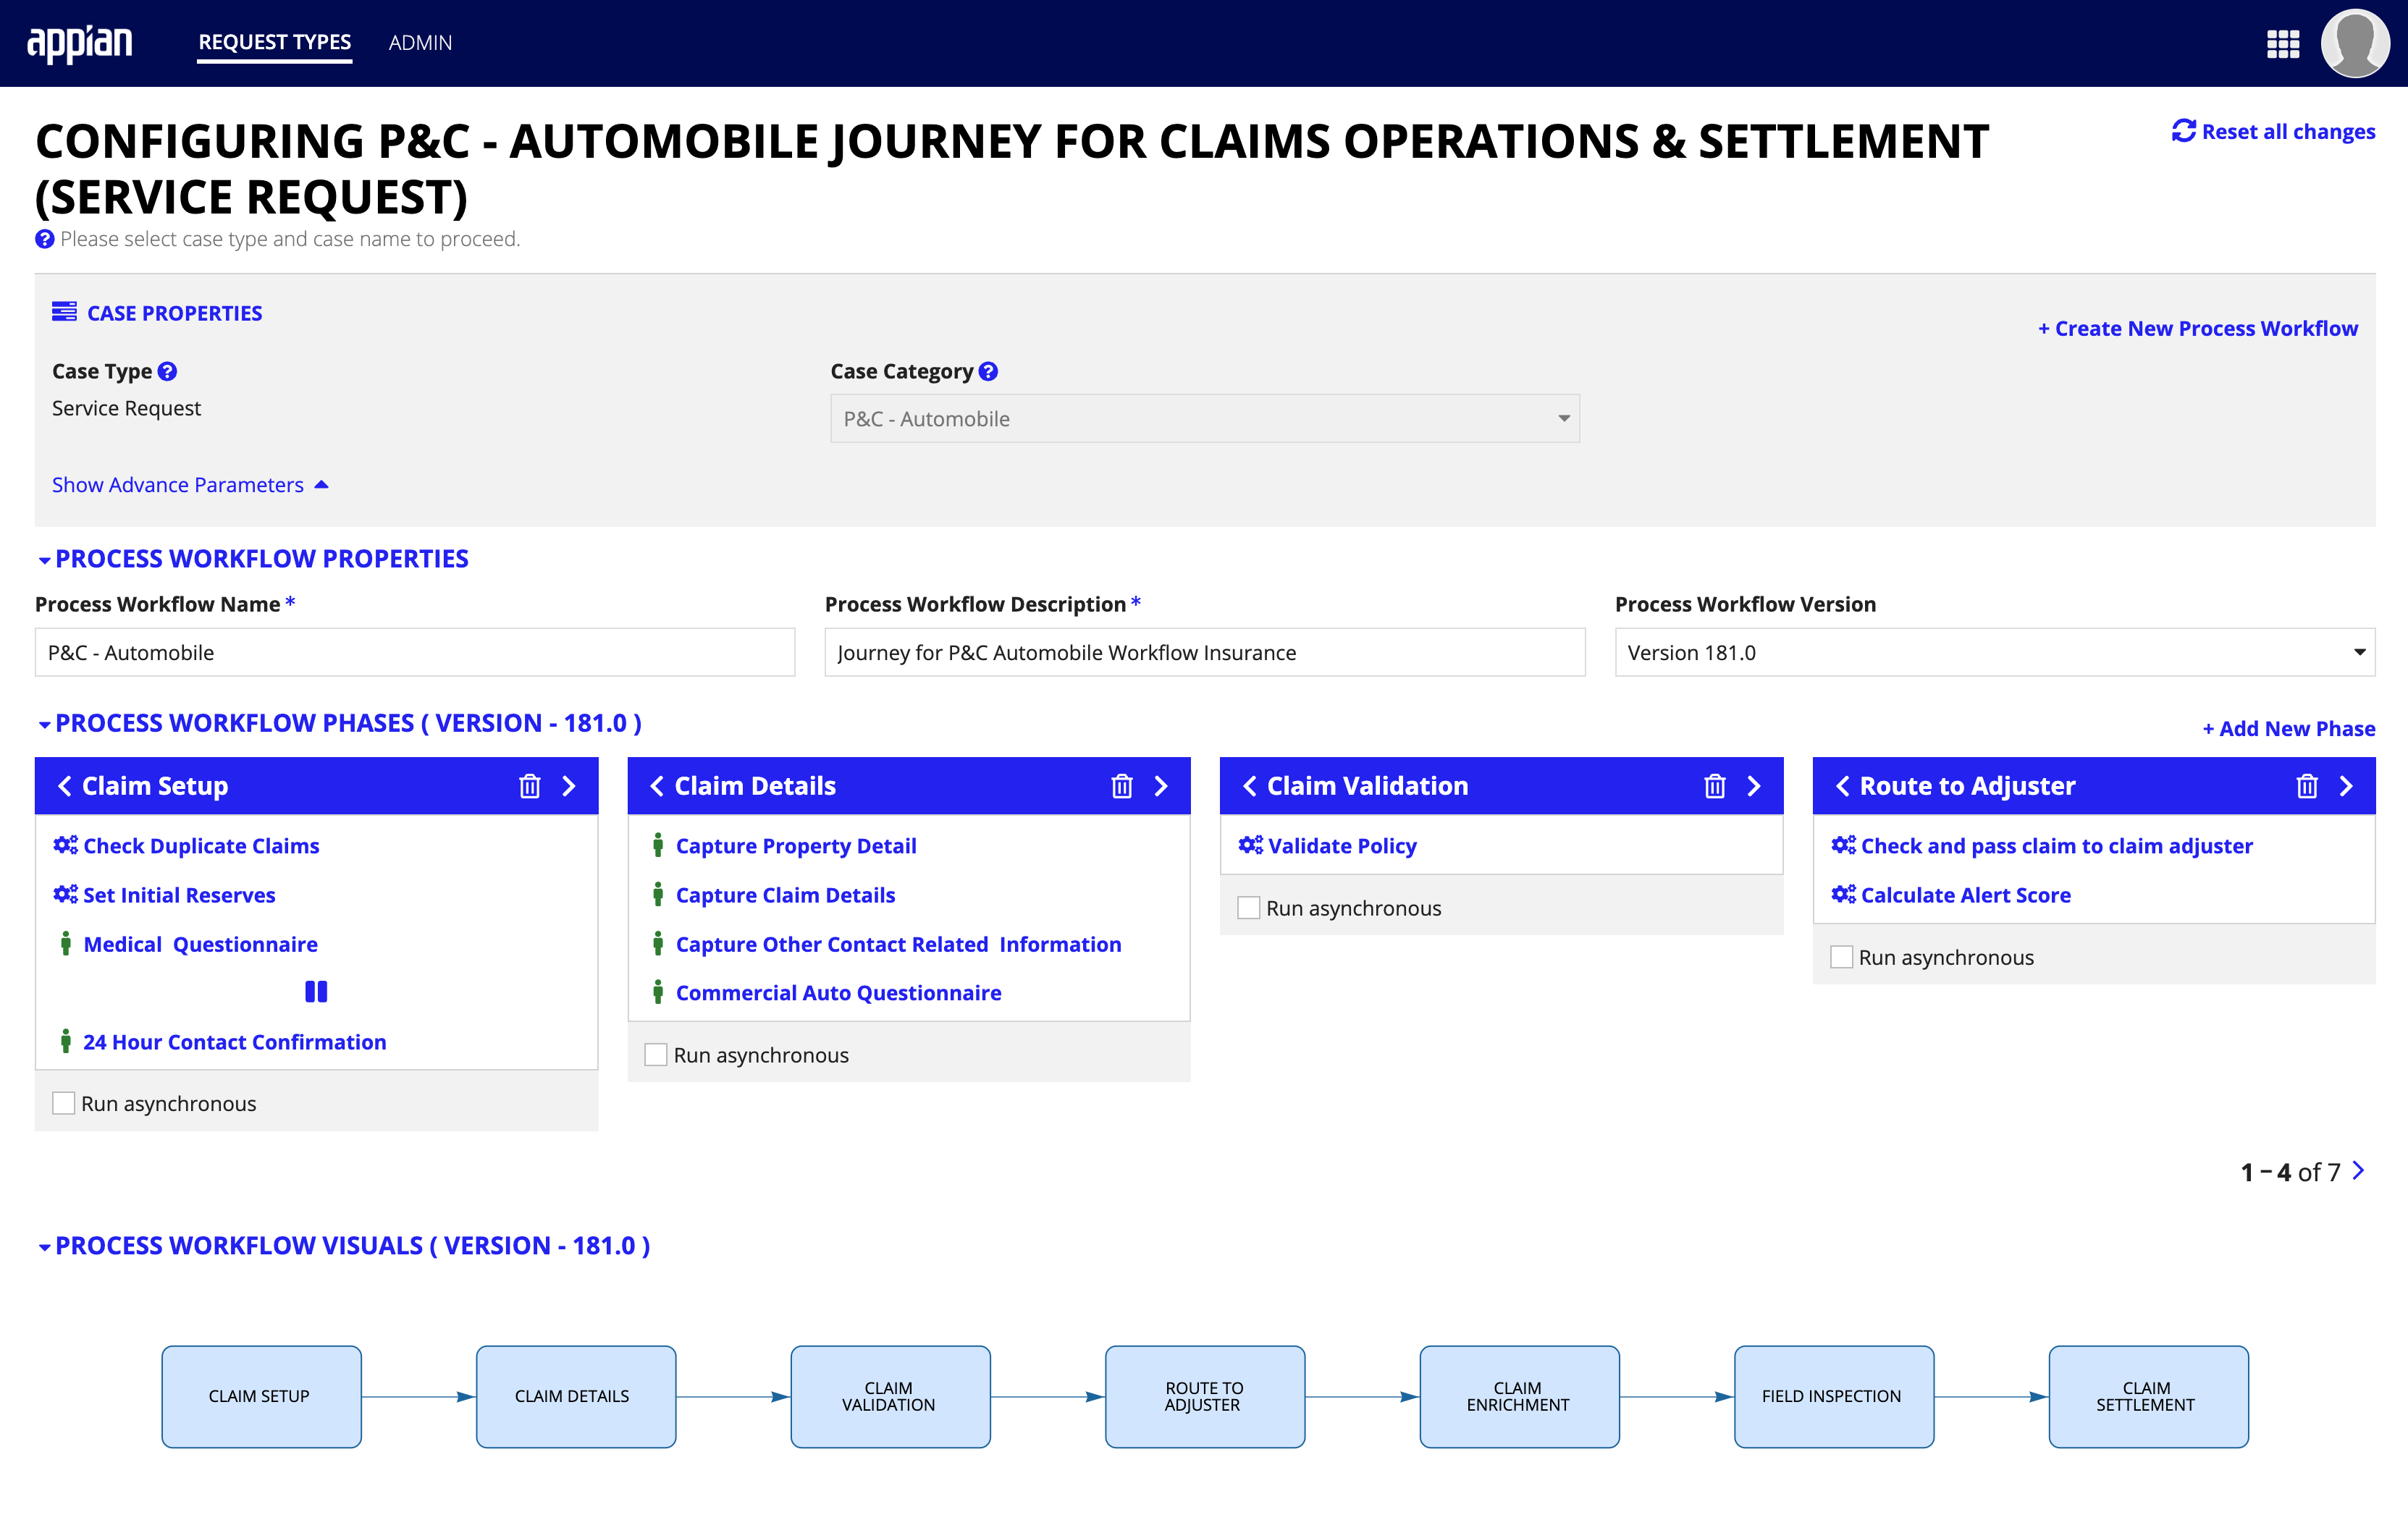
- MANAGE AS IS WORKFLOW: Opens a form where the process workflow may be adjusted and published. Shown below.
Request Time AnalysisCopy link to clipboard
A graph of the requests tracked within the system and attributes associated to them.
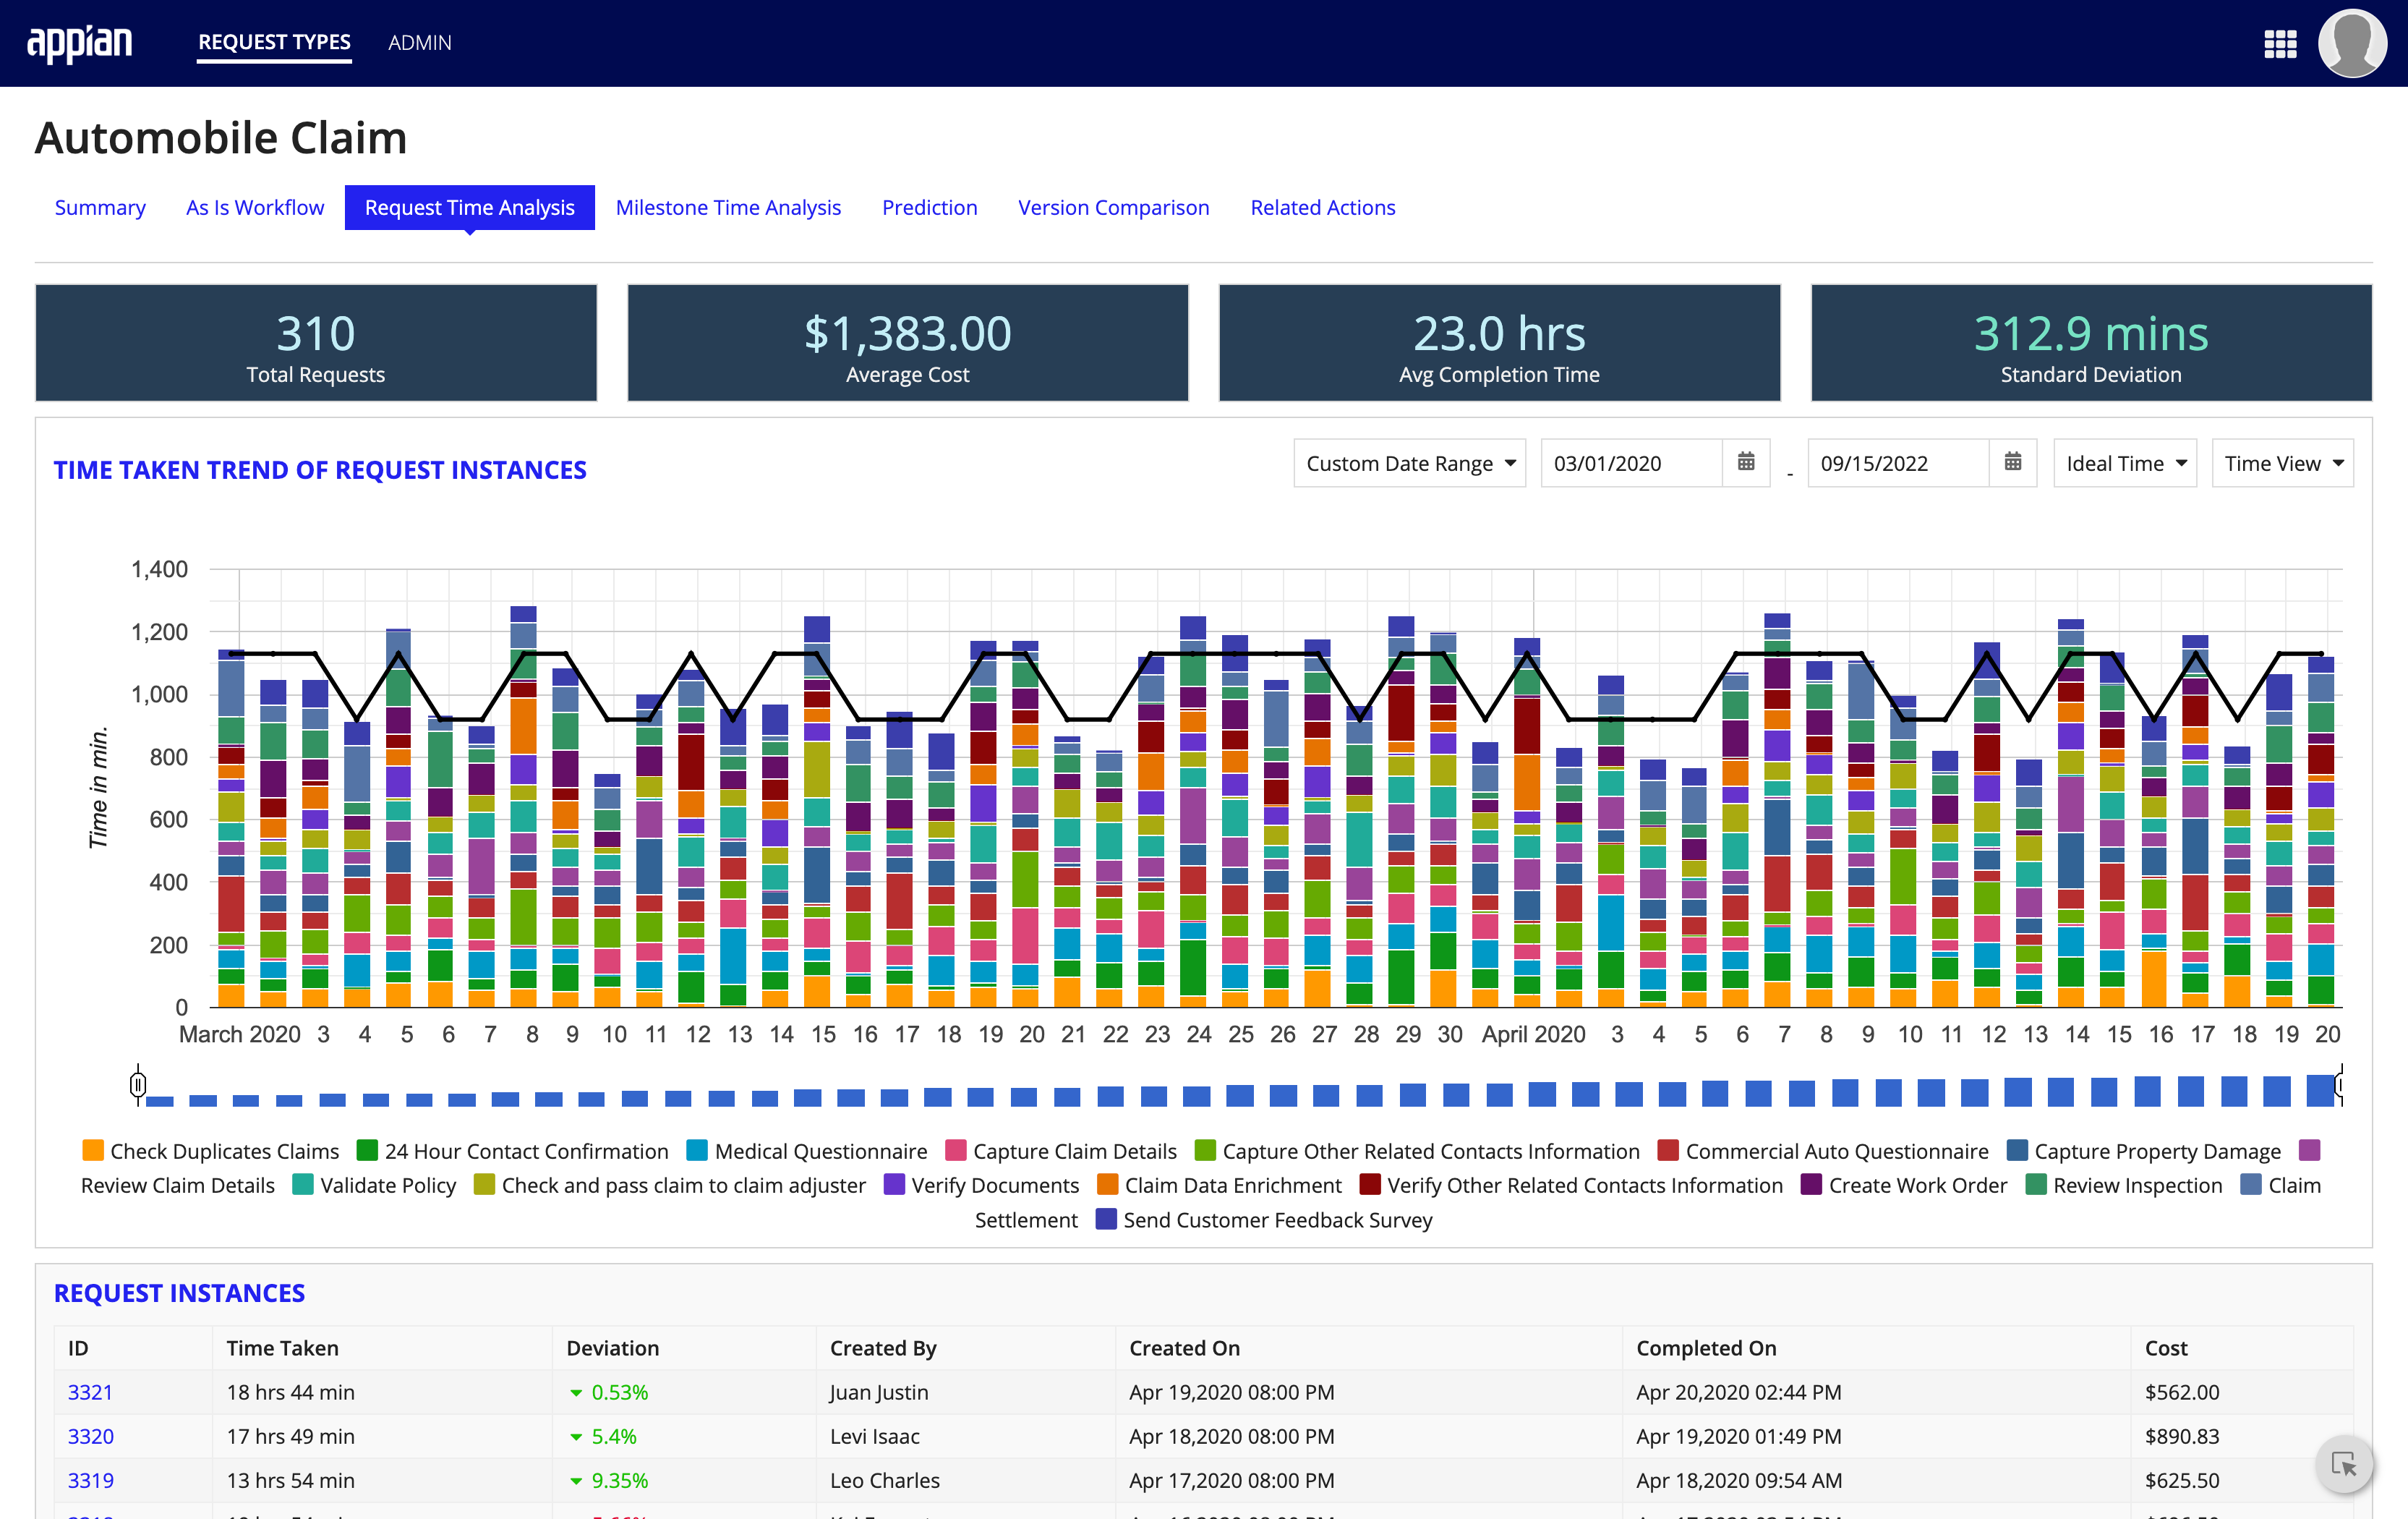
- TIME TAKEN TREND OF REQUEST INSTANCES: A graph showing the time taken to complete request instances, broken down by the request type.
- REQUEST INSTANCES: A table displaying the request instances represented in the graph above.
Milestone Time AnalysisCopy link to clipboard
A breakdown of the milestones within the line of business' workflow and the time taken to complete each task.
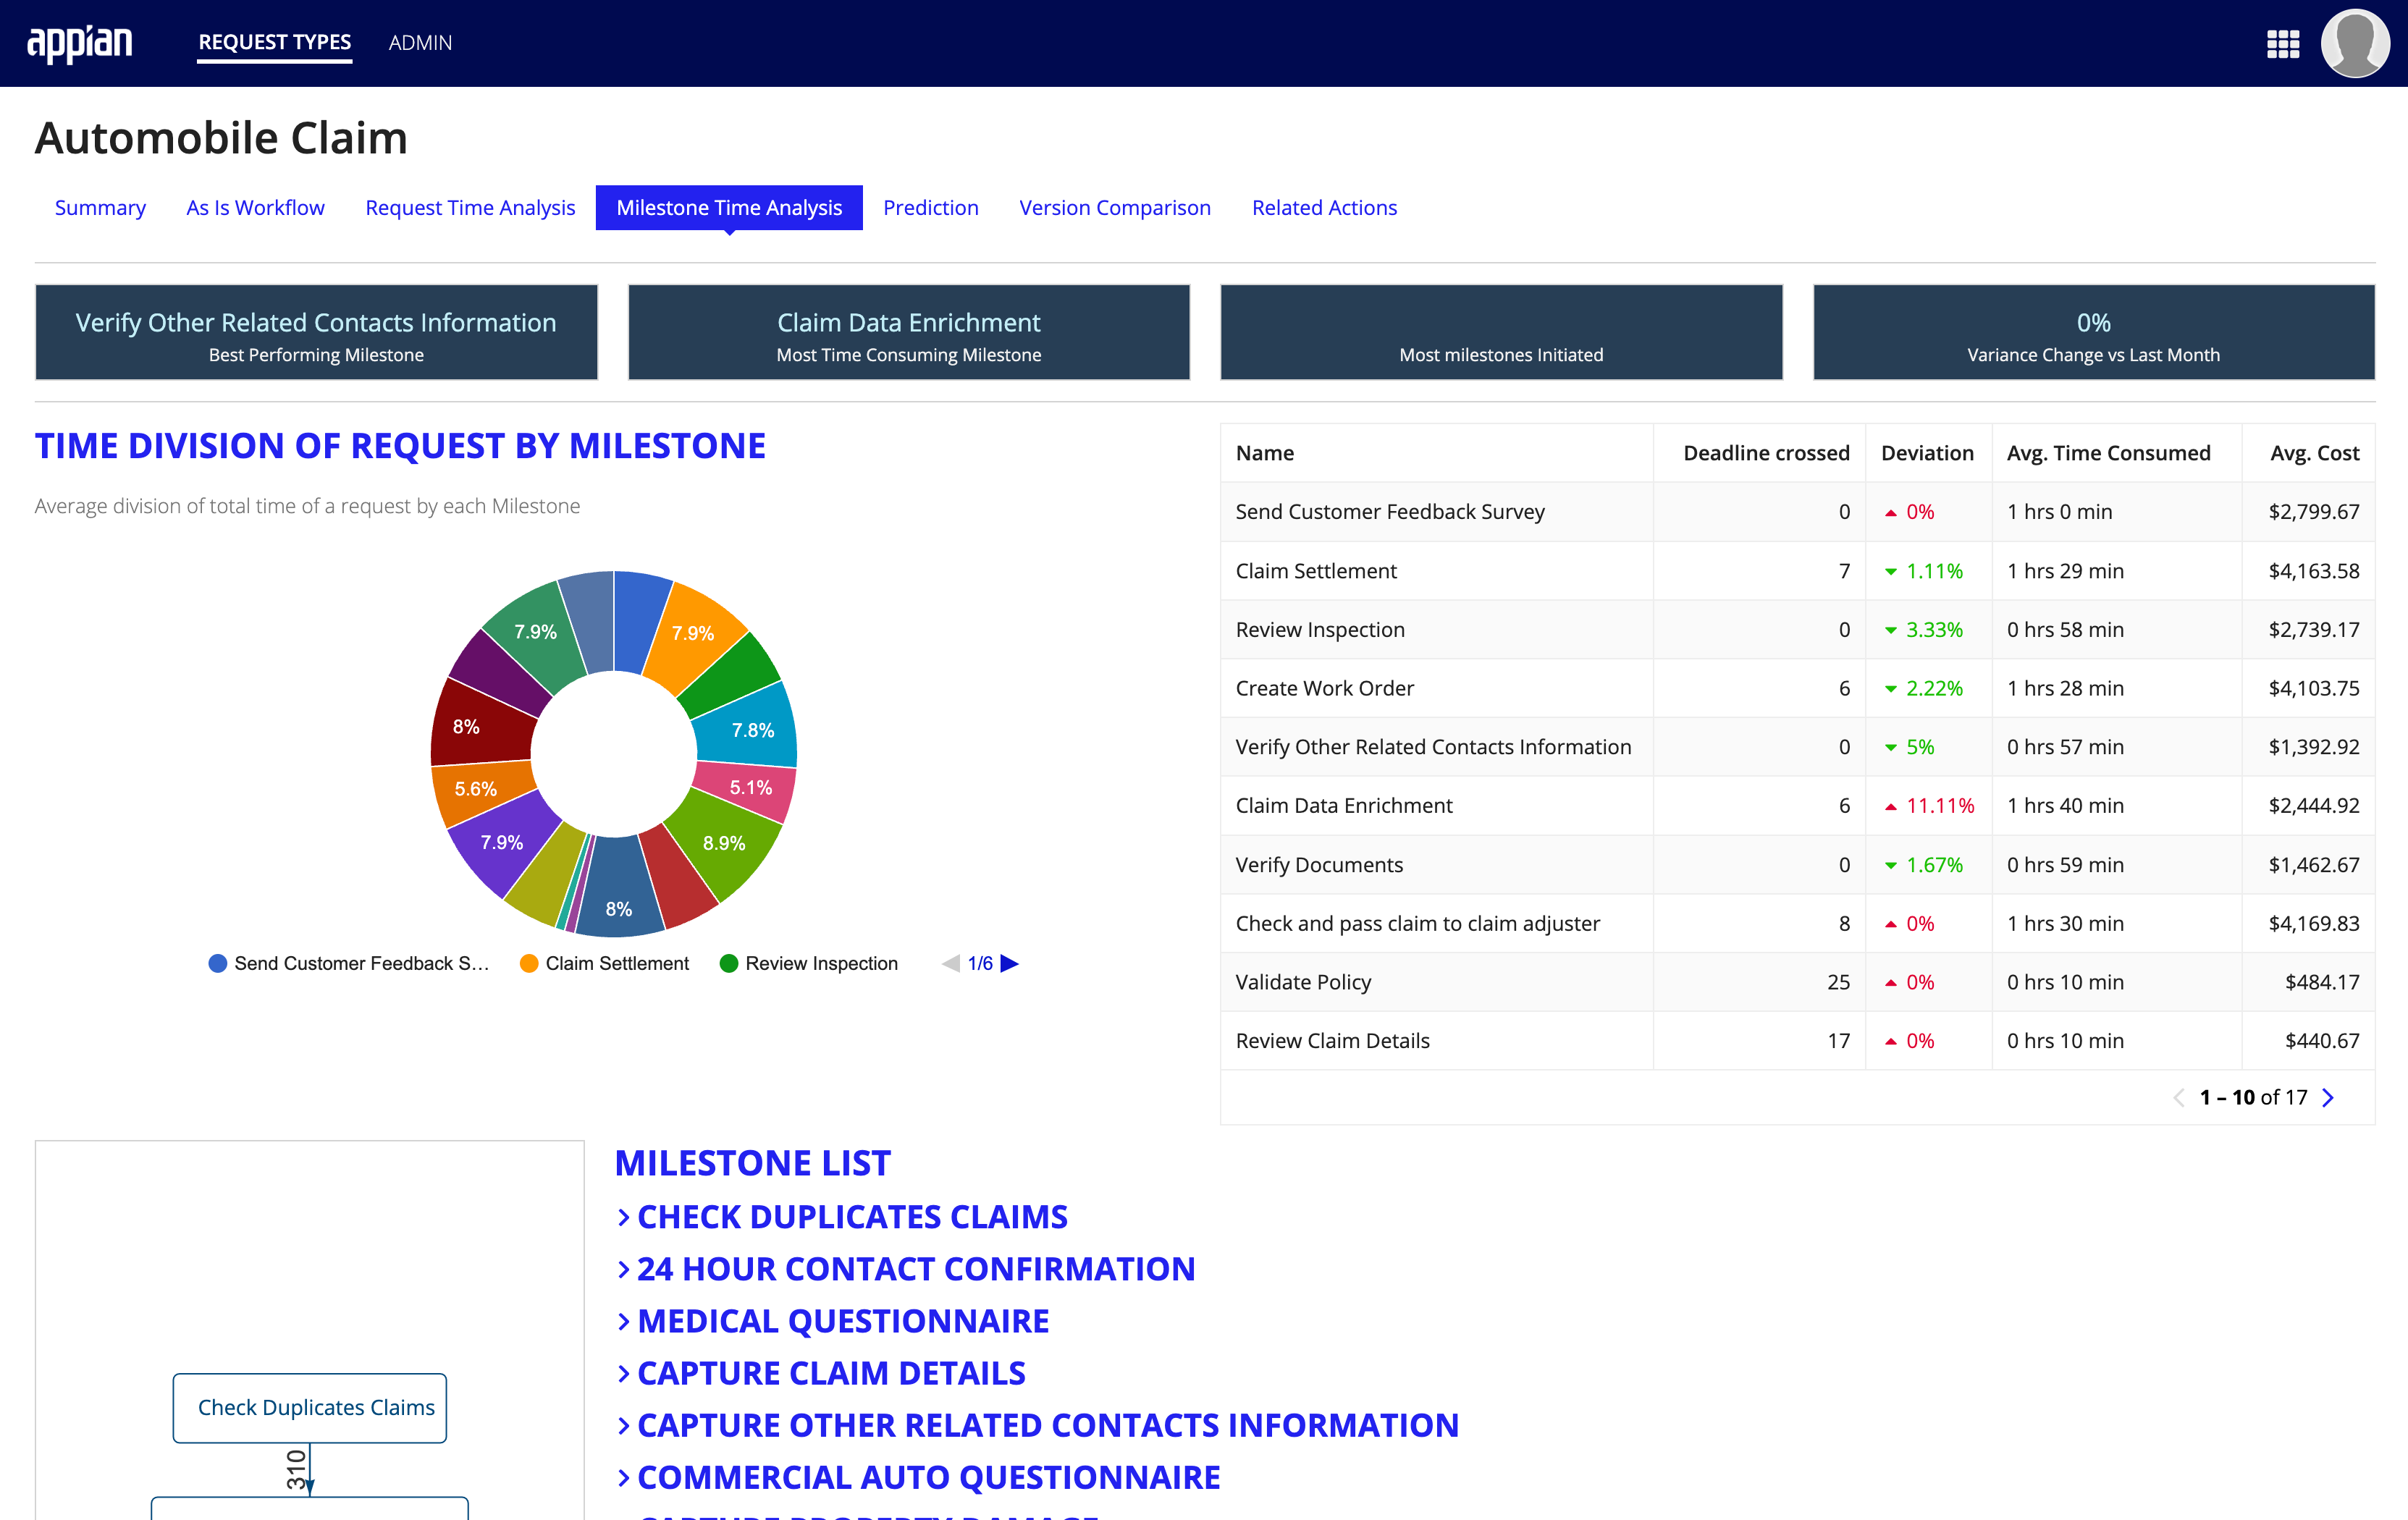
- TIME DIVISION OF REQUEST BY MILESTONE: A pie chart and table showing the average division of total time of a request by each milestone.
- MILESTONE LIST: A list of expandable milestone items. Expanding each item shows the milestone completion time by month, and the average time spent to complete them.
PredictionCopy link to clipboard
A flowing GANTT chart of milestone events, filterable by the following parameters:
- Average Time
- Deadline Time
- Ideal Time
- Maximum Time
- Minimum Time
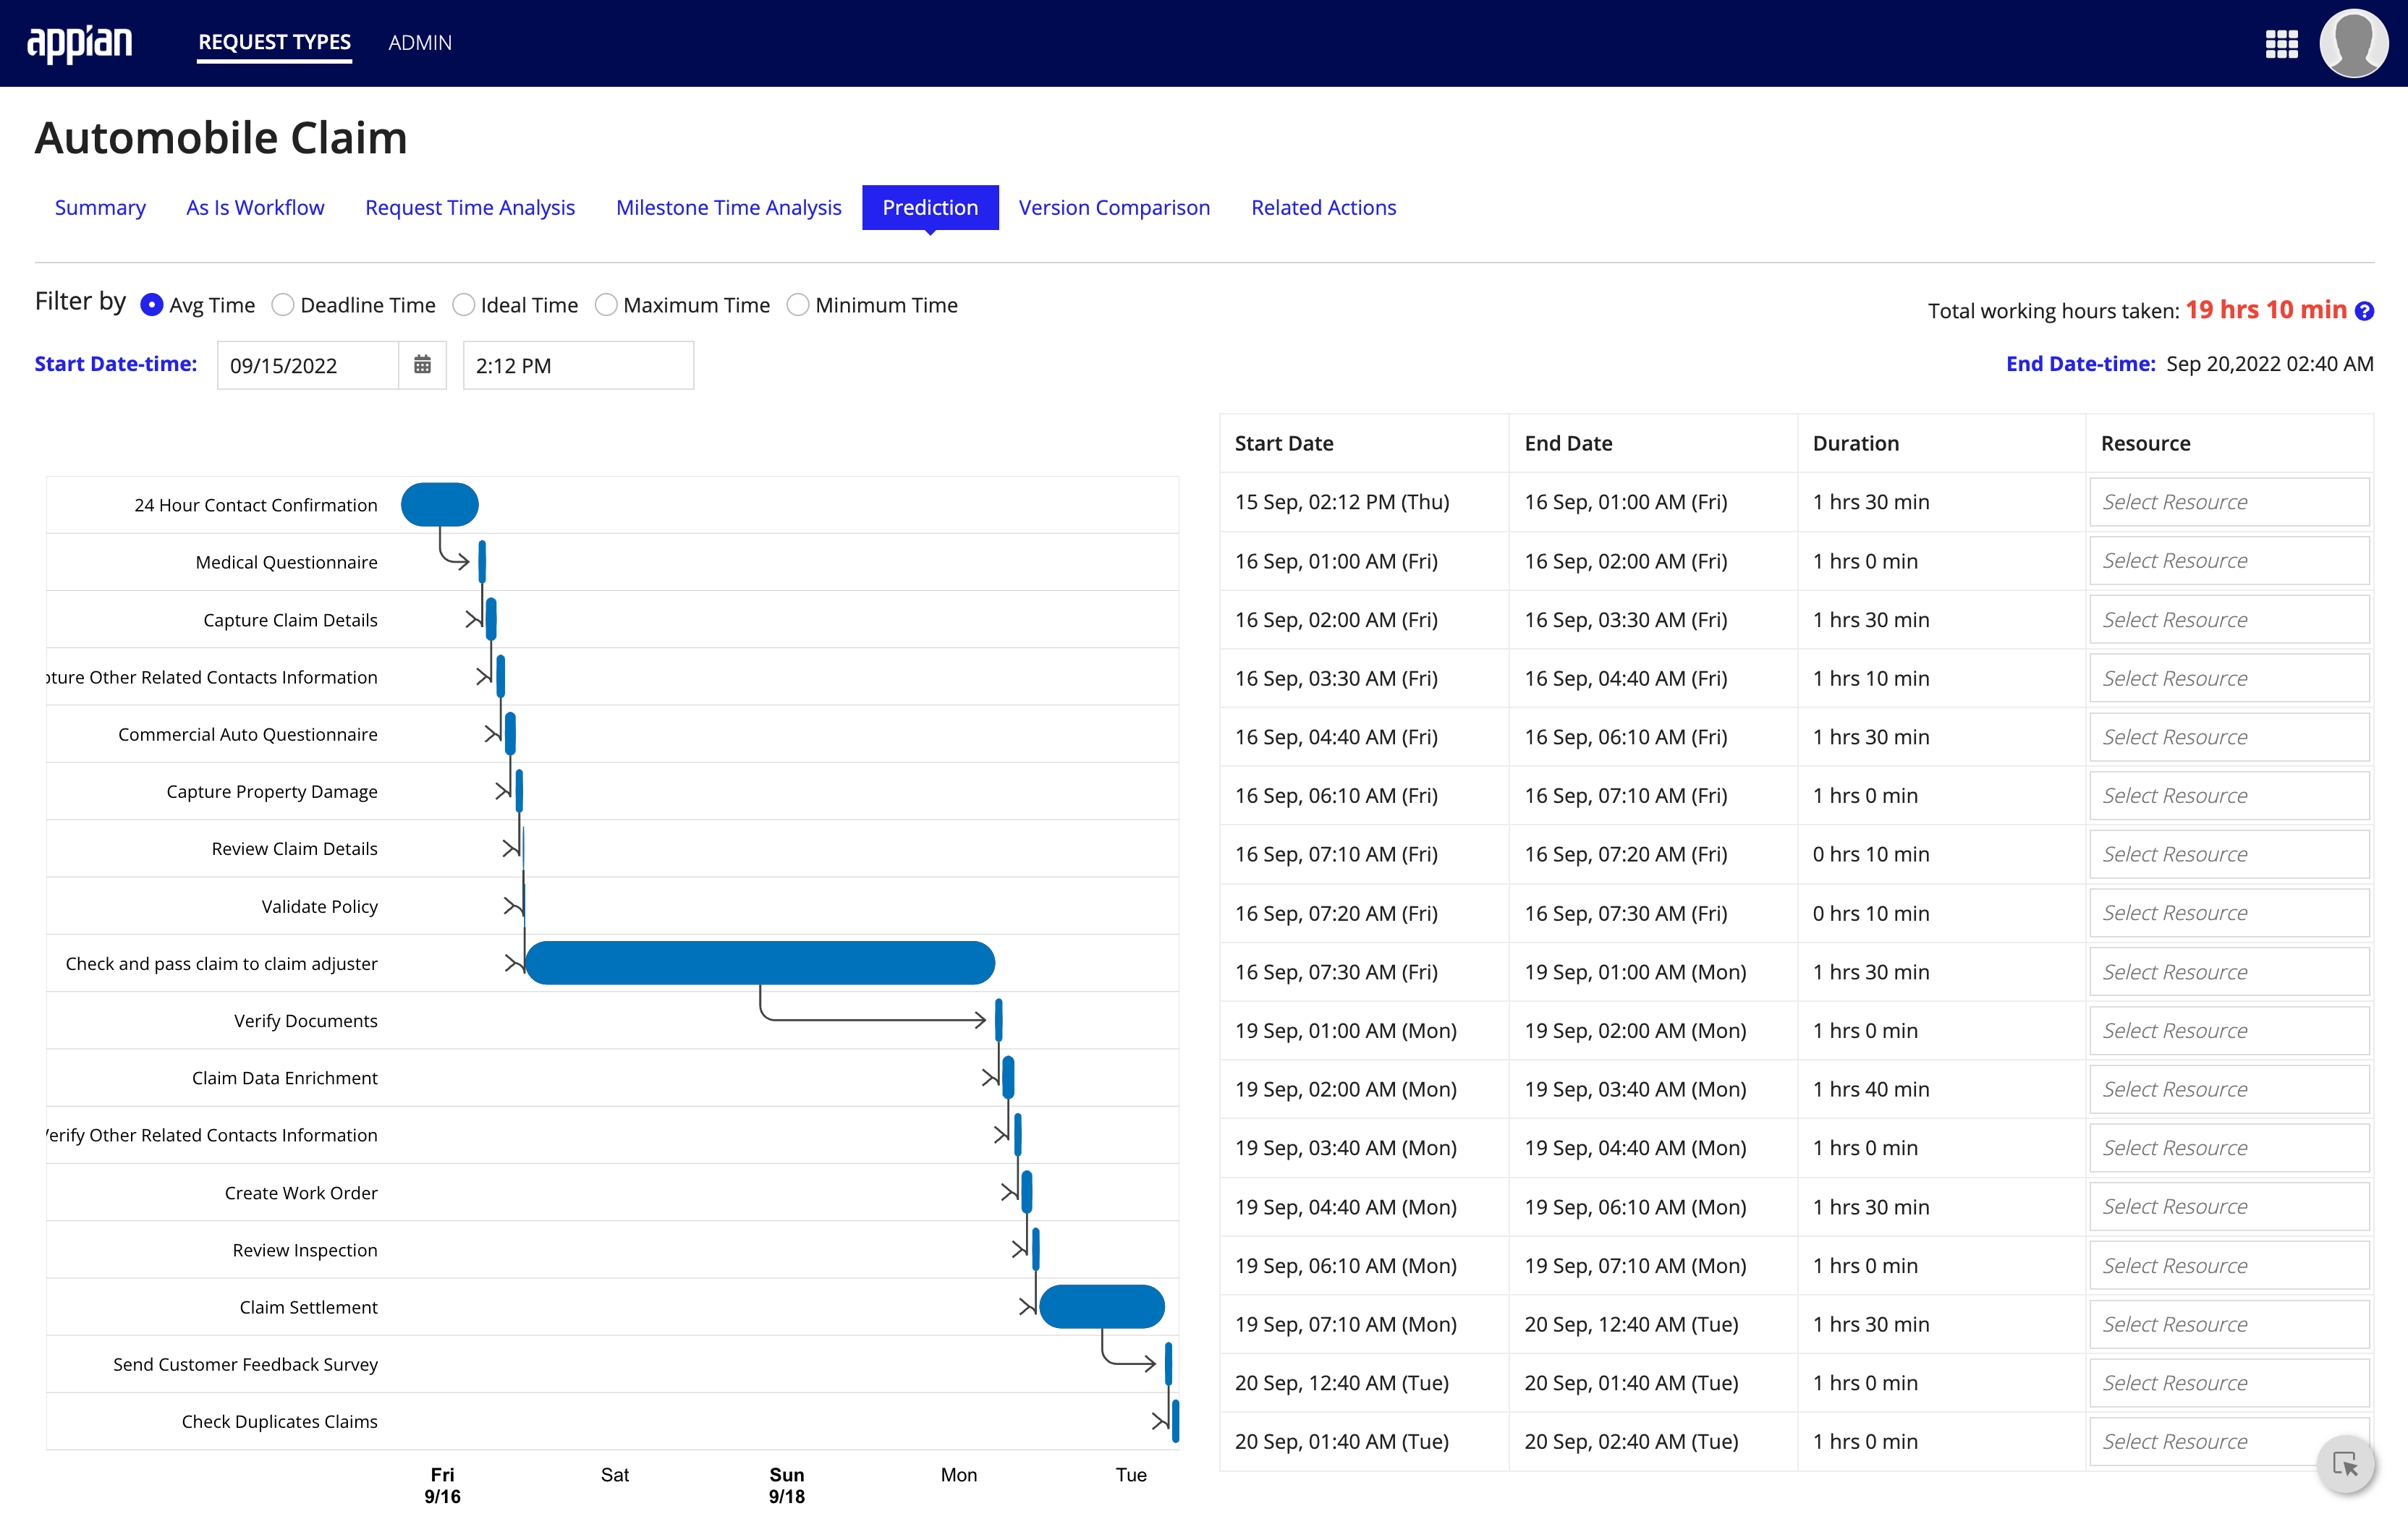
Clicking the bar on each event item isolates the event. The field in the RESOURCE column filters by users within the organization.
Version ComparisonCopy link to clipboard
A view of the different versions of the process workflow shown side-by-side based on the user's selection.
Displayed data ranges can be selected using date and time input using the RANGE view or by selecting the versions to display using the VERSION VIEW.
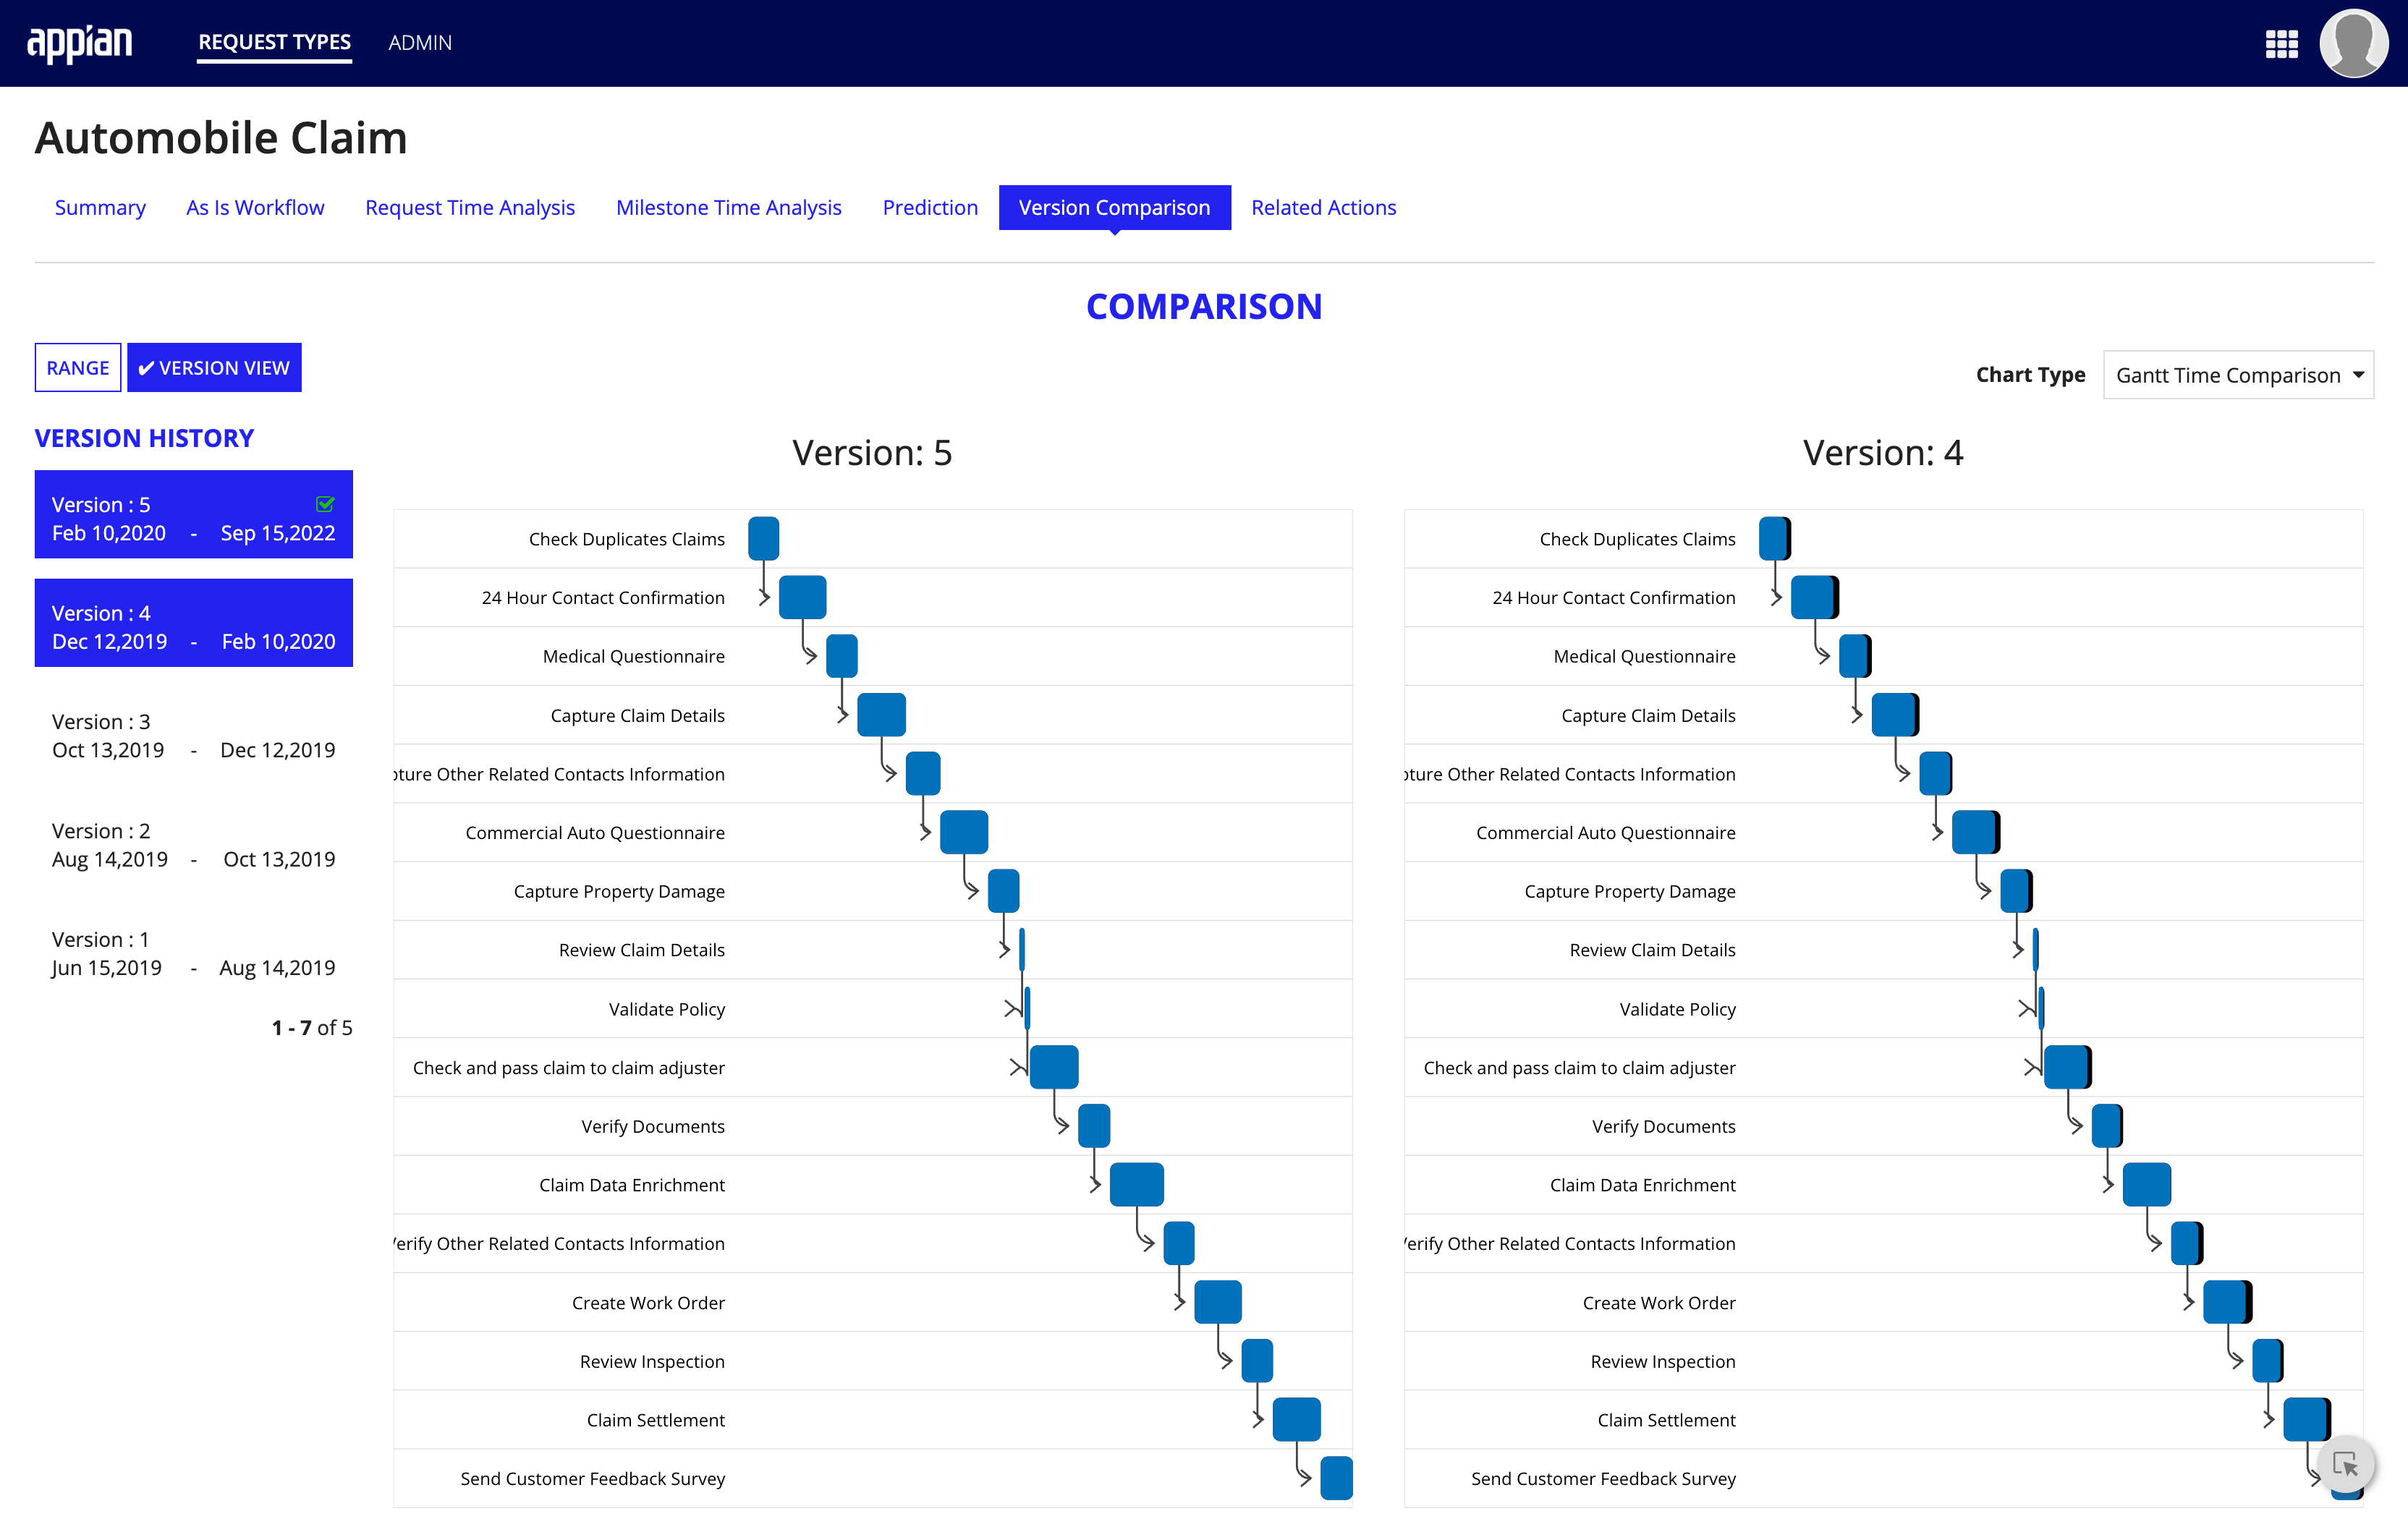
Chart Type options:
- Gantt Time Comparison
- Network Flow Comparison
- Bar Time Comparison
- Bar Cost Comparison
