This page explains the different places where you can reference your record data.
Now that you have your records and your record list, you can reference and use them throughout your applications. Appian Records are versatile, so you can view a single record or the record list in interface components, on sites, or on Tempo.
Once you choose where you're going to use your record data, learn how to reference the record type.
Tip: Users must have at least Viewer permissions to a record type to access it on a site or in Tempo. Learn more about record security.
You can quickly build powerful reports and interfaces when you leverage your record data in the following interface components:
You can easily pull record data into a read-only grid by choosing the record type as the grid's data source. This also allows you to reuse features configured on your record list such as user filters, record actions, and export to Excel.

By default, the read-only grid will apply the record list style and format. You can then customize your grid by creating new grid columns, replacing record fields with related record fields, or adding new display values in your fields.
In Expression Mode, you can configure the grid's data source using a!recordData() or a!queryEntity(), and use fv!row with bracket notation to easily pass the record field values into the grid in your interface.
See a!queryRecordType and a!recordData for more information on querying record data. See Reference a record type to learn more about fv!row.
Aggregate Data and Conditionally Display in a Chart or Grid (Reports, Charts, Query Data, Grids, Records): Aggregate data and conditionally display it in a pie chart or grid. In this pattern, we will calculate the total number of employees in each department and display it in a pie chart and a read-only grid. Then, we'll use a link field to conditionally display each component.
Aggregate Data on a Date or Date and Time Field (Reports, Query Data, Grids, Records): Aggregate data, specifically the total number of employees by date.
Conditionally Hide a Column in a Grid (Grids, Conditional Display): Conditionally hide a column in a read-only grid when all data for that column is a specific value.
Configure a Chart Drilldown to a Grid (Charts, Grids, Query Data, Records): Displays a column chart with aggregate data from a record type and conditionally shows a grid with filtered records when a user selects a column on the chart.
Delete Rows in a Grid (Grids): Delete one or more rows of data in a read-only grid.
Display Last Refresh Time (Auto-Refresh, Grids, Records): Display the last time the interface was updated, either based on a user interaction or a timer.
Filter the Data in a Grid (Grids, Filtering, Records): Configure a user filter for your read-only grid that uses a record type as the data source. When the user selects a value to filter by, update the grid to show the result.
Filter the Data in a Grid Using a Chart (Charts, Grids, Filtering, Records): Display an interactive pie chart with selectable sections so that a user may filter the results in a grid.
Limit Grid Selection to One Row (Validation, Grids, Records): Limit the number of rows that can be selected to one.
Limit the Number of Rows in a Grid That Can Be Selected (Validation, Grids, Records): Limit the number of rows that can be selected to an arbitrary number.
Show Calculated Columns in a Grid (Formatting, Grids, Records): Display calculated values in columns in a grid.
Sync Records using a Record Action (Records, Grids): Configure a record action with the Sync Records smart service so users can sync a set of records on demand.
Top Customers and Their Latest Order (Records, Reports, Grids): This pattern illustrates how to create a grid that shows the top paying customers, their latest order, and their total sum of sales.
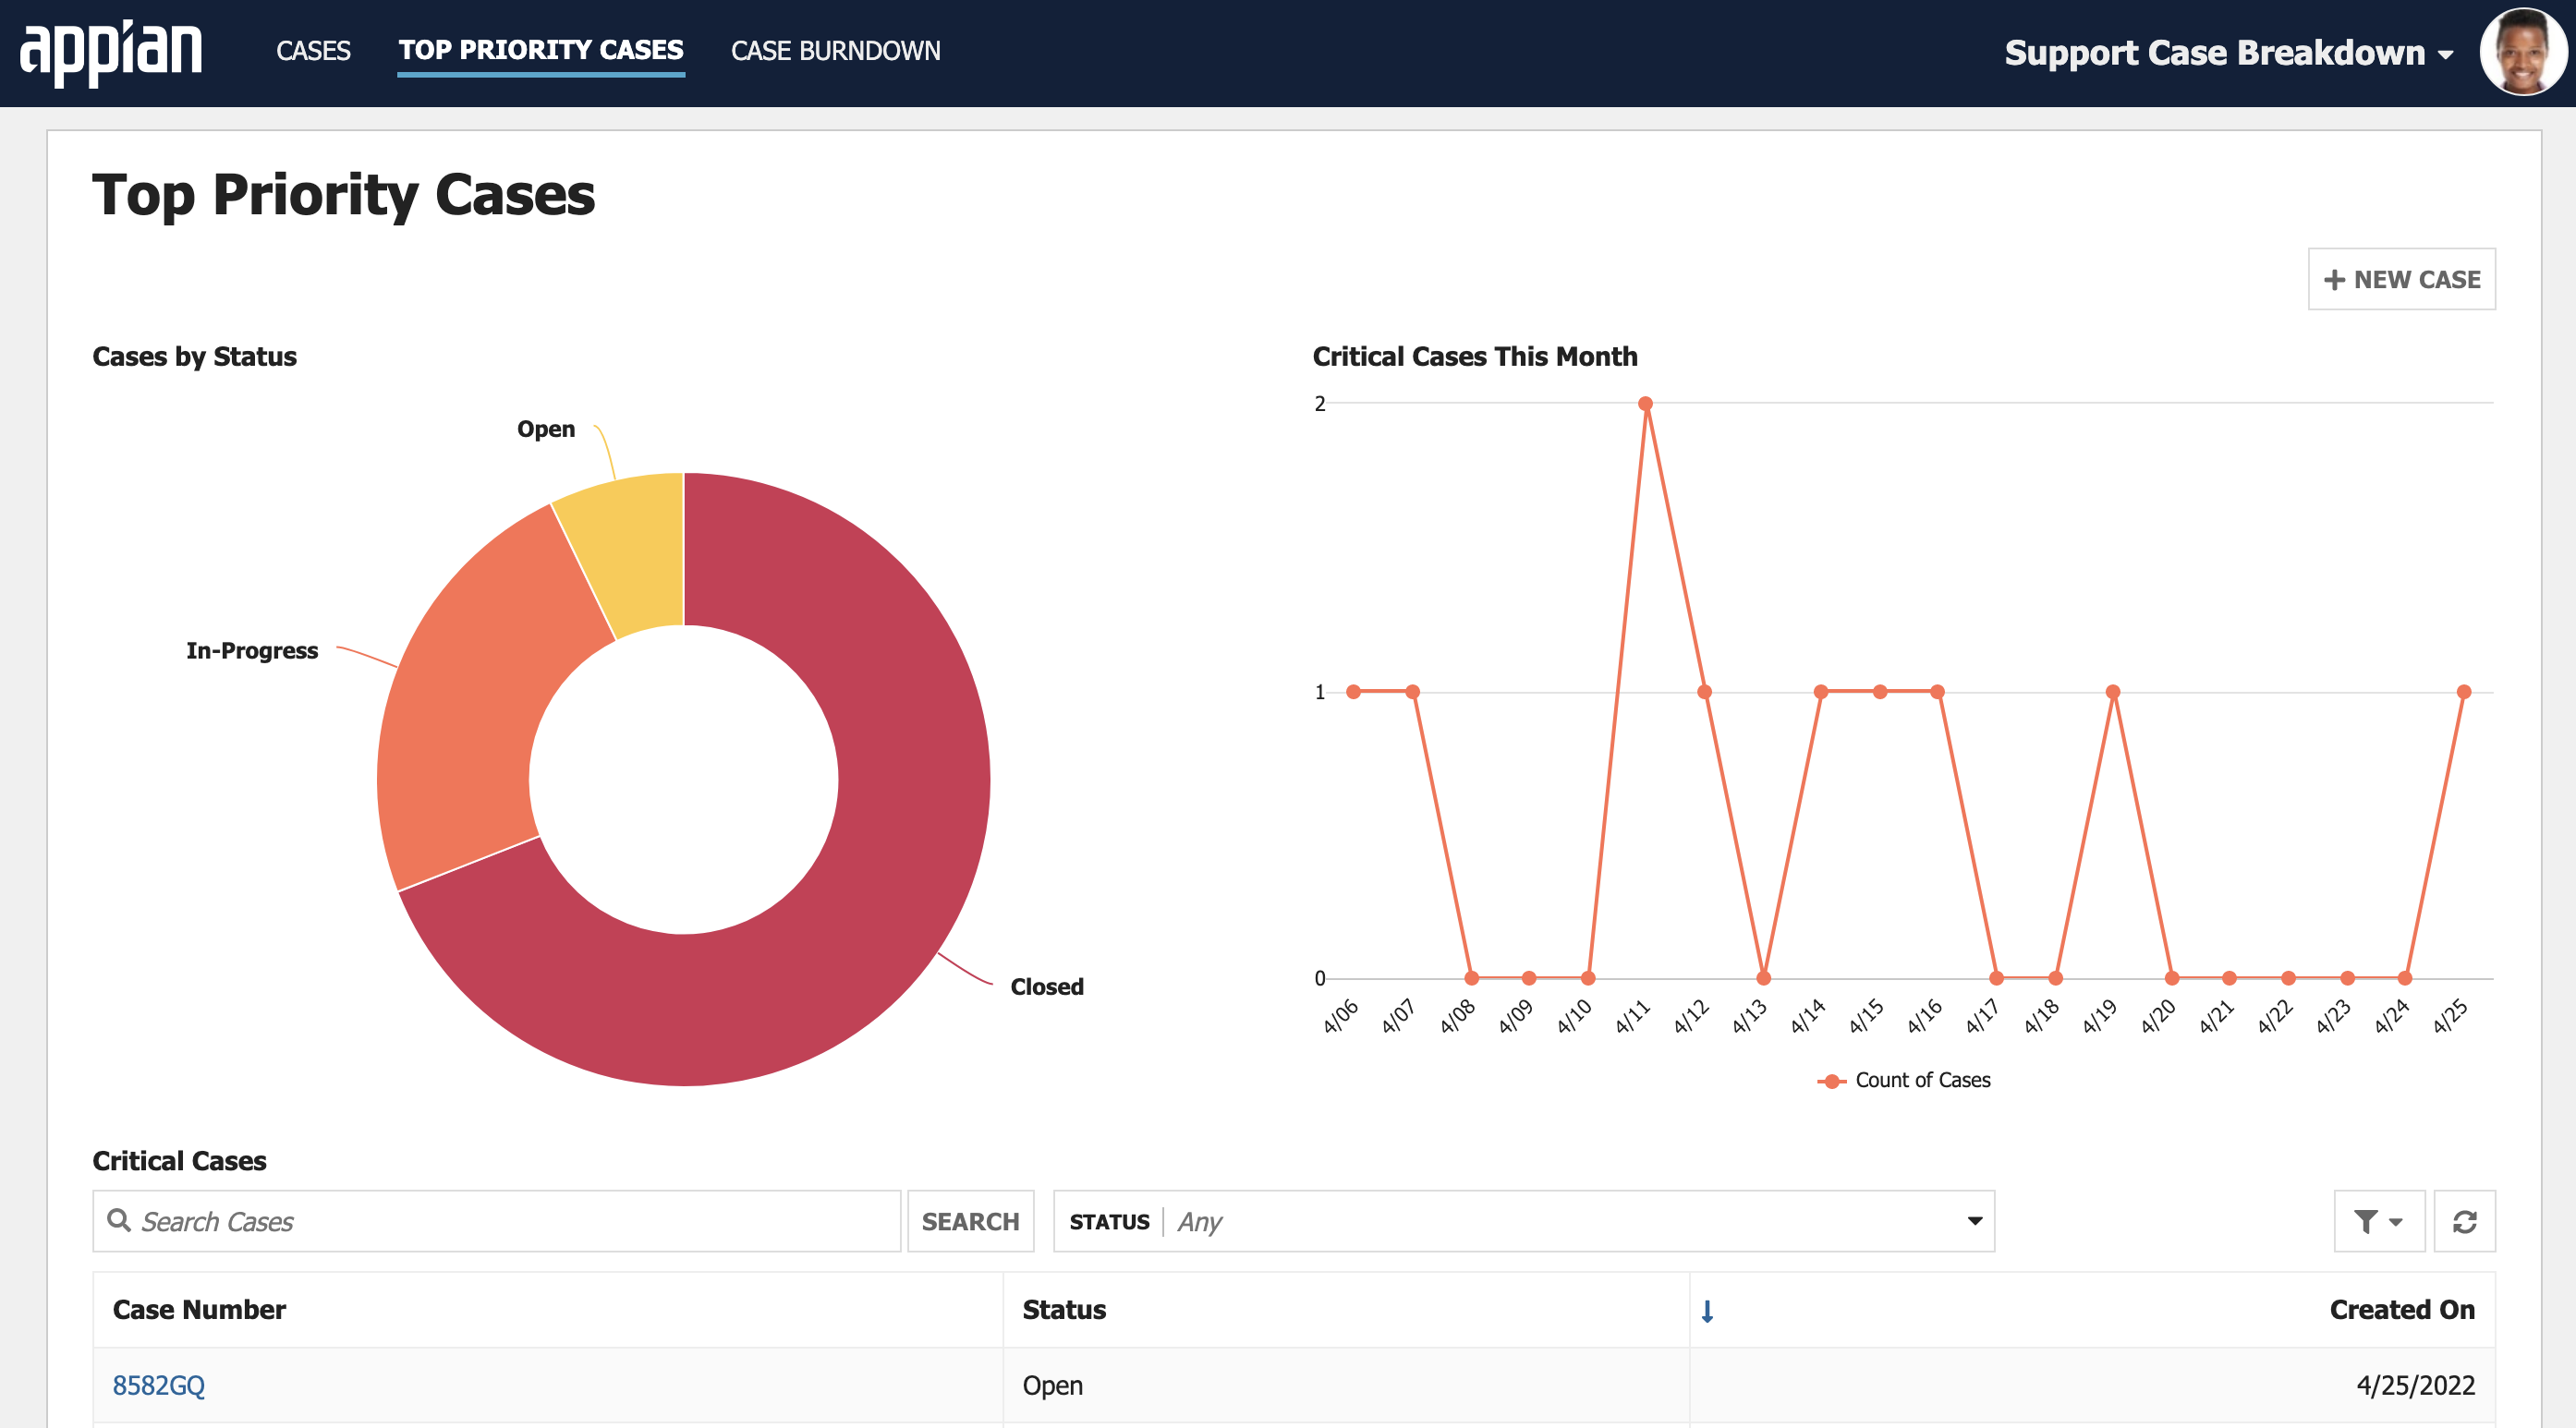
It's easy to build powerful reports when you use a record type as the source of your charts. Simply choose your chart (bar chart, column chart, line chart, or pie chart), and specify the record type to use as your data source. Appian will then query your data for you and automatically display the results in the chart.
You can then modify the chart's grouping and measures to determine what data to query from the record type and how to display the results on the chart.
If your record type leverages record type relationships, you can easily reference related data by hovering over the relationship name in the list of available record fields.
If you start building your chart and find that you need to calculate or summarize your existing data to display the right information, consider creating custom record fields on your record type to calculate these values and store them in a new record field.
You can even use a pre-defined reporting template to help you configure the data you need. You can then easily reference these fields like any other record field in your chart.
See Chart Configuration Using Record Data for details and examples using a record type as the source.
Aggregate Data and Conditionally Display in a Chart or Grid (Reports, Charts, Query Data, Grids, Records): Aggregate data and conditionally display it in a pie chart or grid. In this pattern, we will calculate the total number of employees in each department and display it in a pie chart and a read-only grid. Then, we'll use a link field to conditionally display each component.
Aggregate Data and Display in a Chart (Reports, Charts, Query Data, Records): Aggregate data, specifically the total number of employees in a given department, to display in a pie chart.
Aggregate Data by Multiple Fields and Display in a Chart (Reports, Charts, Query Data, Records): Aggregate data by multiple fields and display it in a stacked column chart. In this pattern, we will calculate the total number of employees for each title in each department and display it in a stacked column chart.
Aggregate Data using a Filter and Display in a Chart (Reports, Charts, Query Data, Filtering, Records): Aggregate data, specifically the total number of employees for each title in the Engineering department, to display in a bar chart.
Configure a Chart Drilldown to a Grid (Charts, Grids, Query Data, Records): Displays a column chart with aggregate data from a record type and conditionally shows a grid with filtered records when a user selects a column on the chart.
Dynamically Show Sales by Product Category Compared to Total Sales (Records, Reports, Charts, Filtering): This pattern illustrates how to create an area chart that dynamically displays sales generated by product category compared to total sales over the last year.
Filter the Data in a Grid Using a Chart (Charts, Grids, Filtering, Records): Display an interactive pie chart with selectable sections so that a user may filter the results in a grid.
Sales by Region (Records, Reports, Charts): This pattern illustrates how to create a bar chart that shows sales per sales region.
Total Orders Compared to Orders Purchased with Promo Codes (Records, Reports, Charts): This pattern illustrates how to create a column chart that compares the number of total orders and the number of orders that had at least one item purchased with a promo code.
Once you add a related action or a record list action to your record type, you can reuse these actions in any report or form using the record action component.
This component gives you the flexibility to display record actions anywhere on the page, and even change the way the button appears on the interface.
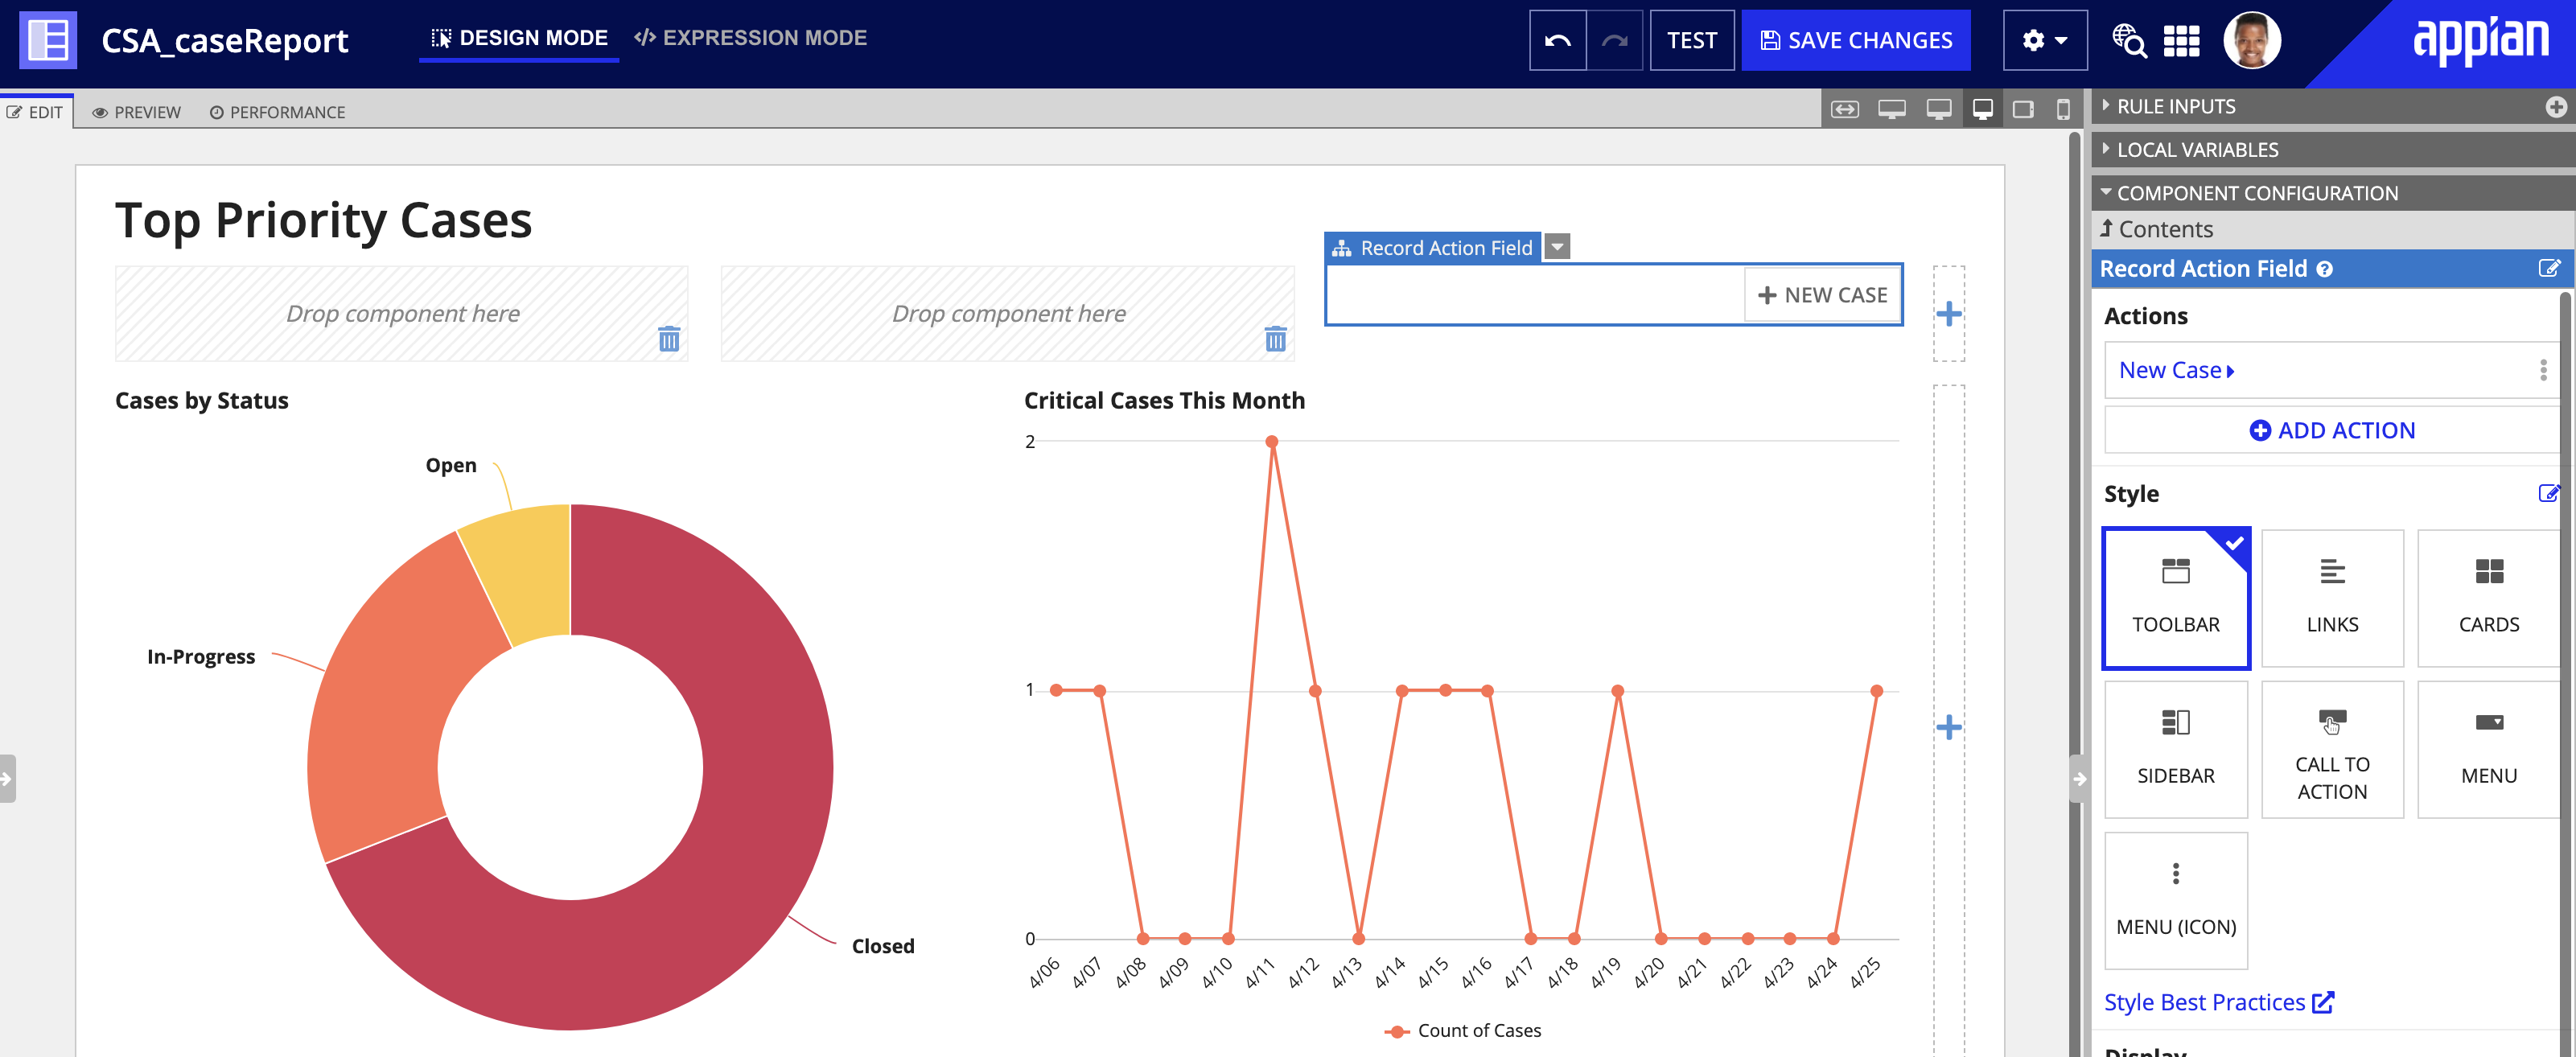
With a record action component, you can easily add a list of record actions, and even reference record actions from different record types.
See a!recordActionField() and a!recordActionItem() to learn how to configure a record action component.
After you configure your record views, you can easily link to these views using record links. For example, in your Customer record list, you could add a record link on the name field and use fv!identifer to pass in each customer's ID. Now, when a user clicks on the customer name, the link will go to the Summary view associated with each customer.
1
2
3
4
5
6
7
8
9
a!linkField(
  links: {
    a!recordLink(
      label: fv!row[recordType!Customer.fields.name],
      recordType: recordType!Customer,
      identifier: fv!identifier
    )
  }
)
Record links can be used in tags, charts, grids, hierarchy browsers, images, link fields, milestones, pickers, and rich text. Using record links, you can allow users to easily discover more information with minimal effort.
See the record link component for more information.
The record picker allows users to select one or more records from a record type using an autocompleting picker. This component is particularly useful when building forms to update or add new information to a record.
For example, if you want to open a new case for a customer, you can add a record picker on your form so you can select the customer name from the Customer record type. This prevents users from manually entering a customer name each time they log a case, and it provides an alternative to building and maintaining a constant to display a list of all customer names.
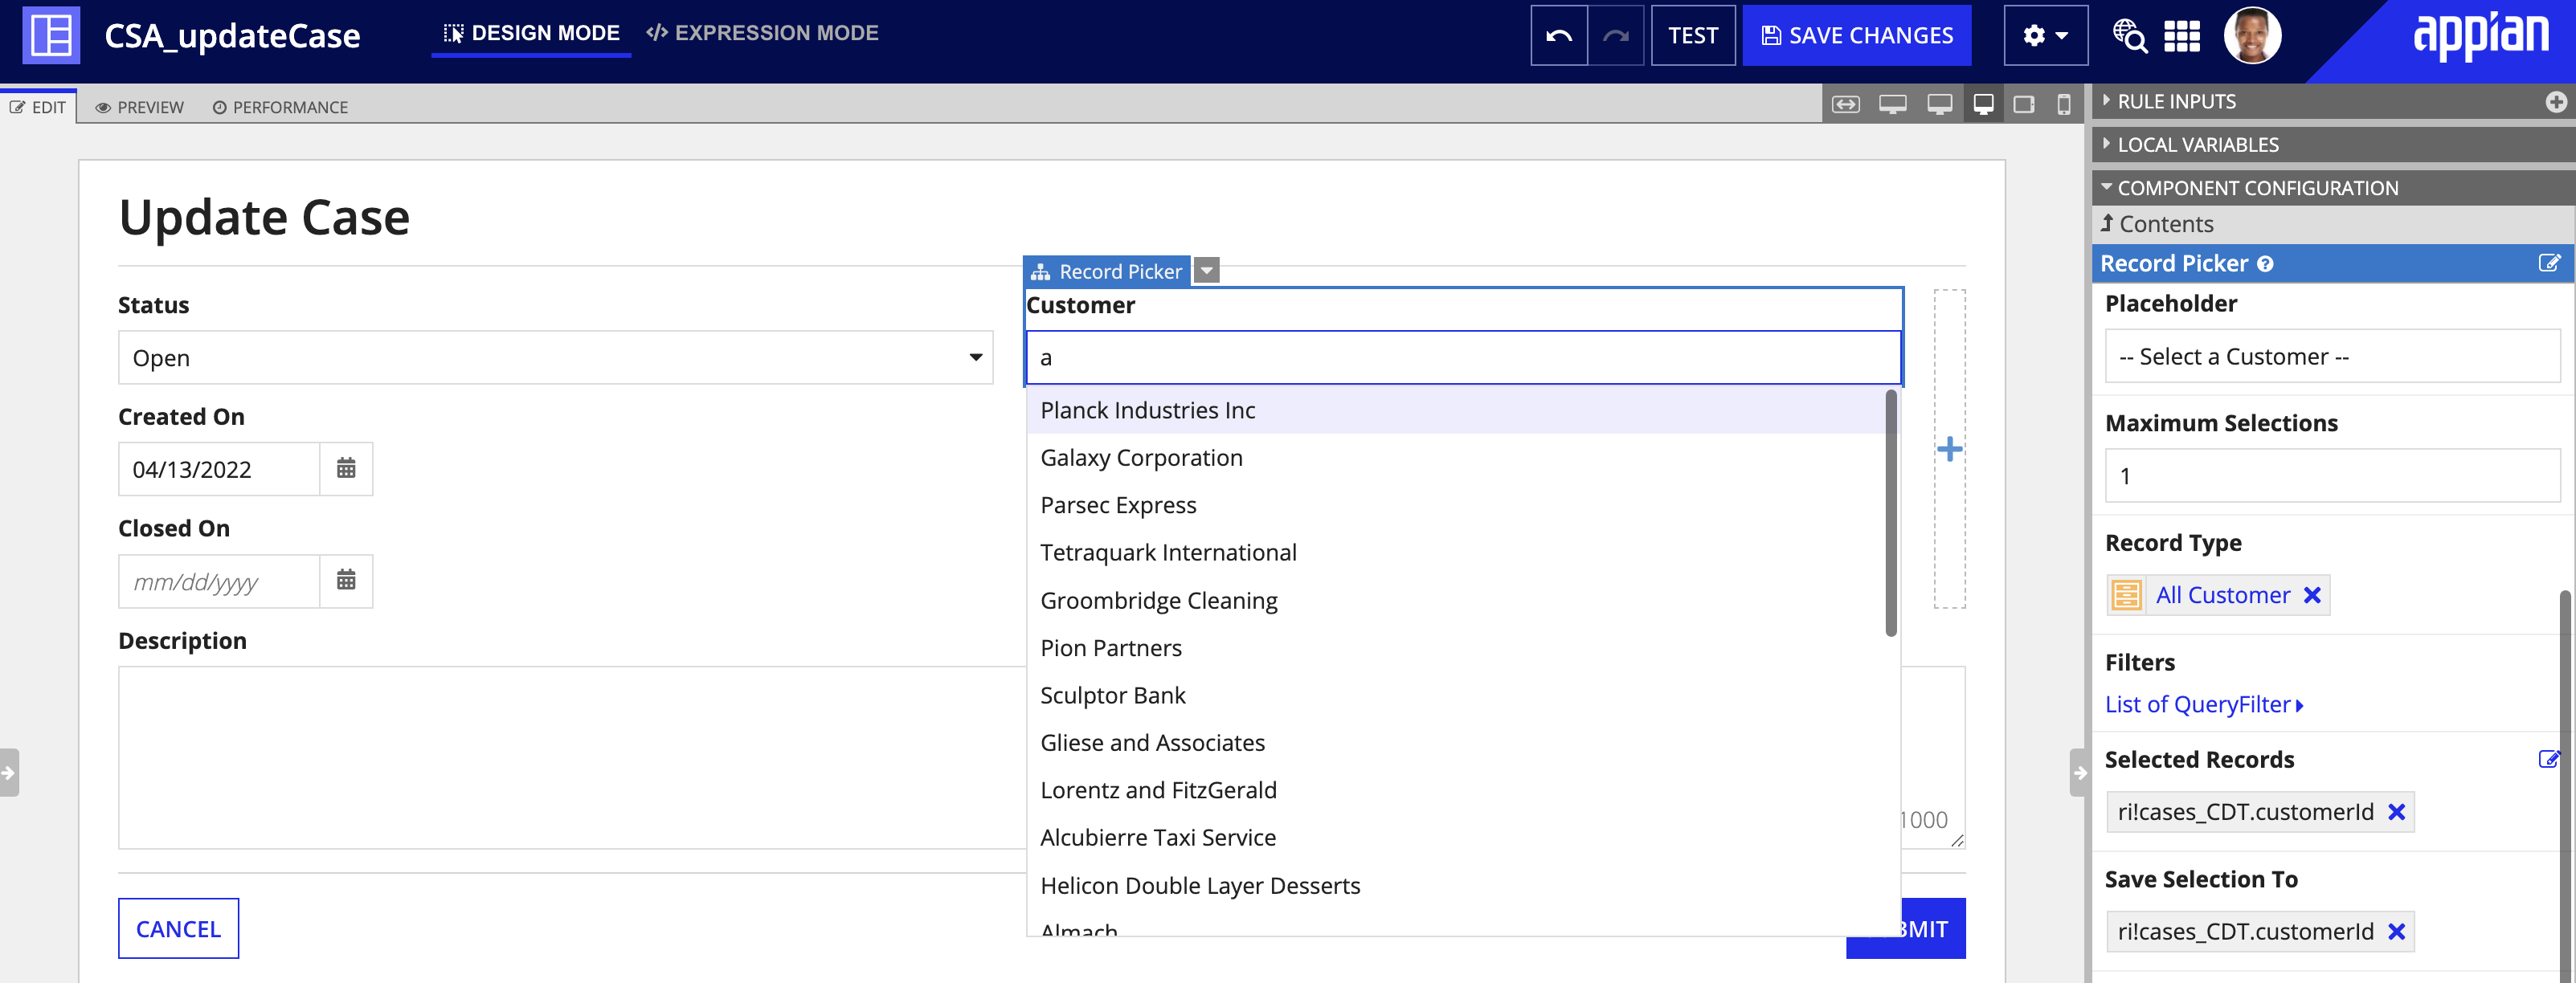
See the record picker component for more information.
In sites, you can associate record types with site pages.
When a site page is associated with a record type, the user sees the record list for the associated record type when accessing that page.
To associate a record type with a site page:
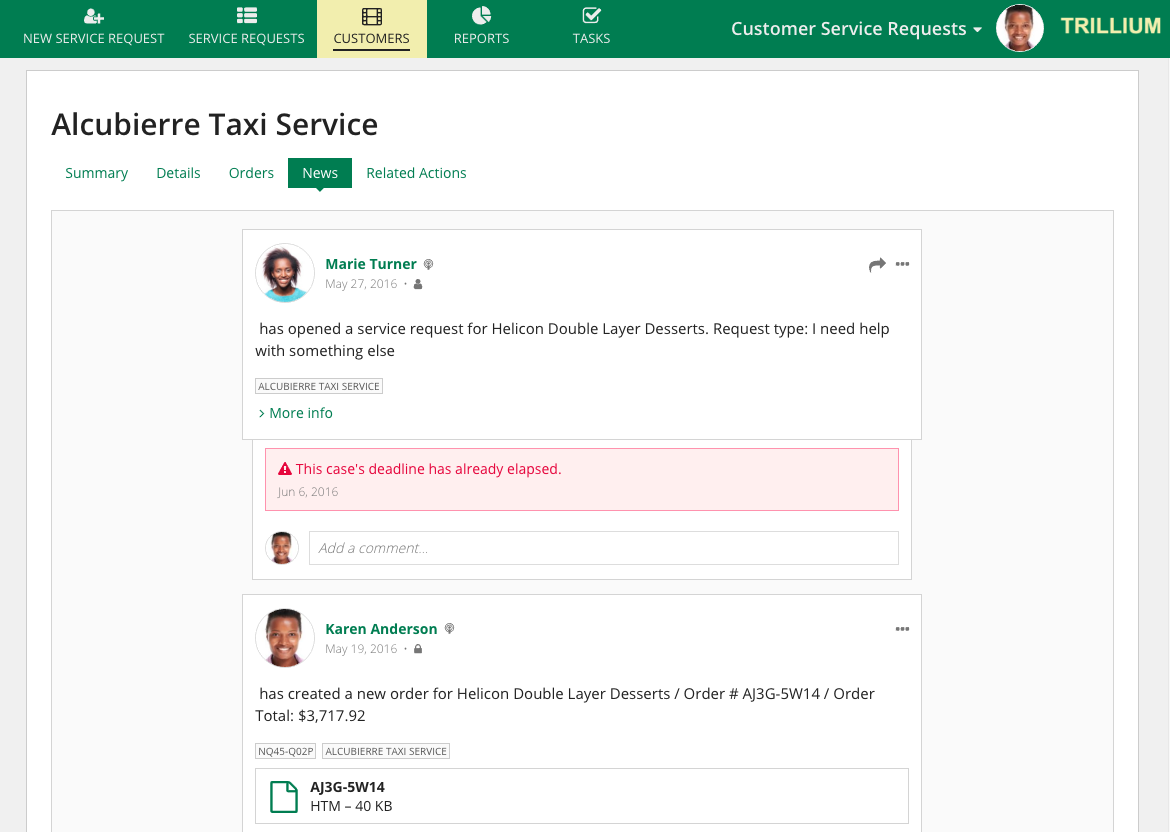
When you associate a record type with a site page, you can choose whether or not to show the News view on the records displayed on the site.
By default, a site is configured to show record news. This means that each record will have a view that displays the 20 most recent news events related to the record. However, the News view will only display on the site if Show News view is selected on the record type object.
See Define Record Views and Actions to learn more about configuring the display of default record views.
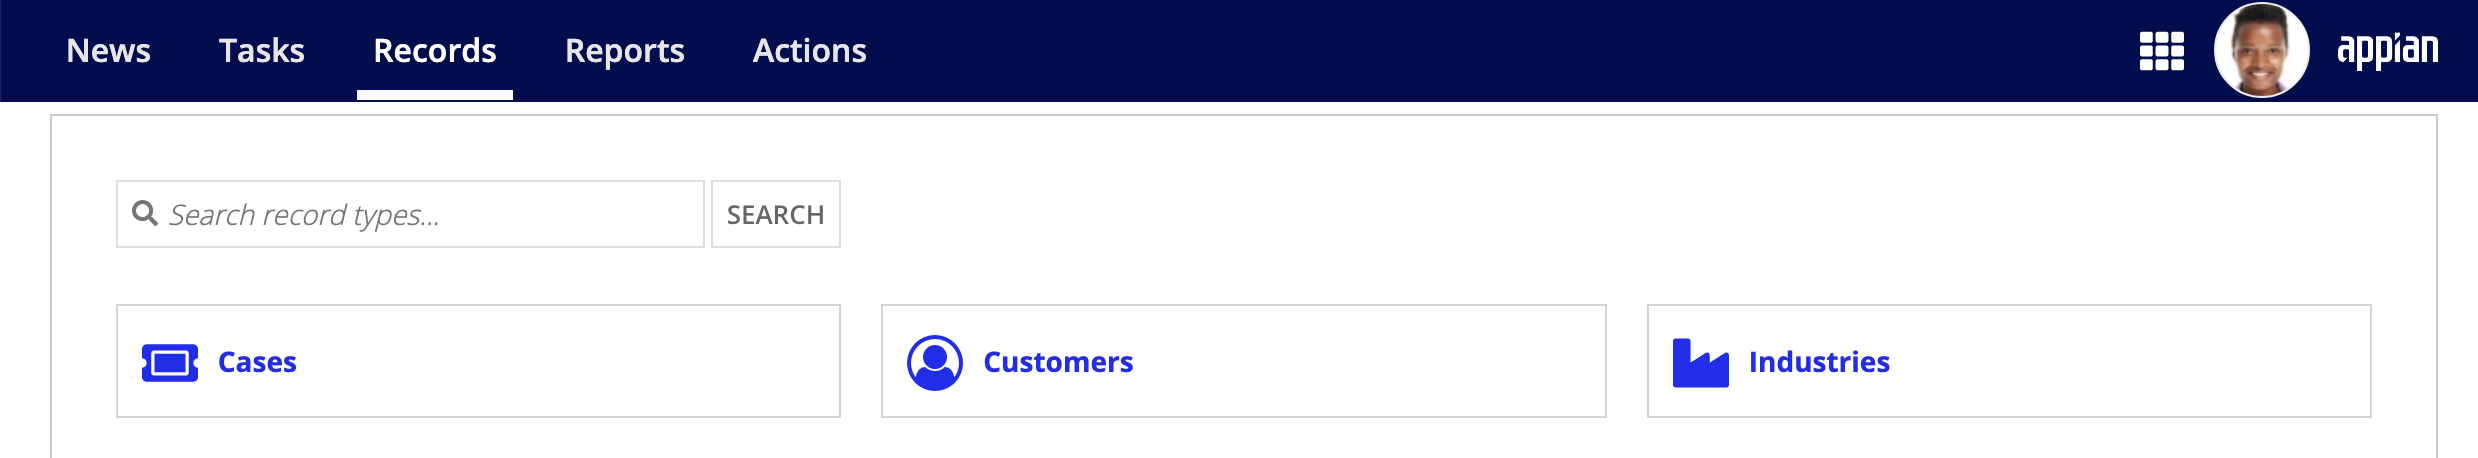
In Tempo, record types are displayed as a list of cards on the Records tab. Each record type has an associated icon and color.
By default, Tempo will display a pre-configured record type called Users. This record type contains a directory of all Appian users. To make changes to the Users record type, see Modify the User Record.
Click a record type to view the record list.
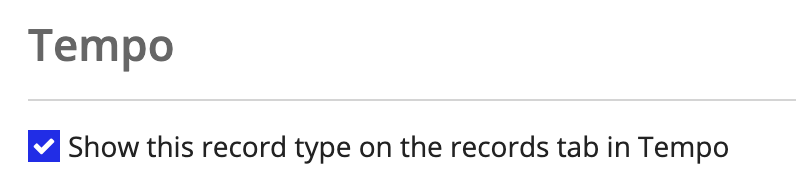
By default, new record types do not display on the Records tab in Tempo.
To display record types in Tempo:
Select the Show this record type on the records tab in Tempo checkbox.
Note: As a best practice, you should hide a record type that defines reference or supplemental data that is only created and managed in the context of another record type. Hiding a record type does not prevent users from viewing a record's list or views in Tempo.
