Tip: Interface patterns give you an opportunity to explore different interface designs. Be sure to check out How to Adapt a Pattern for Your Application.
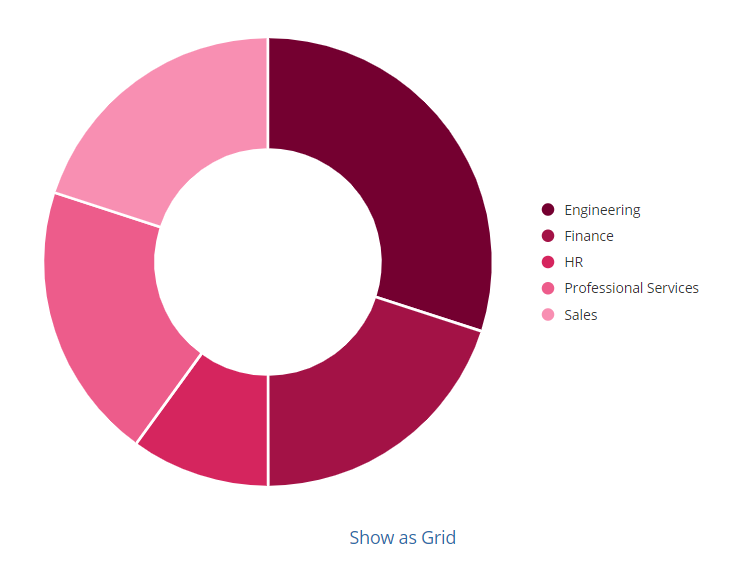
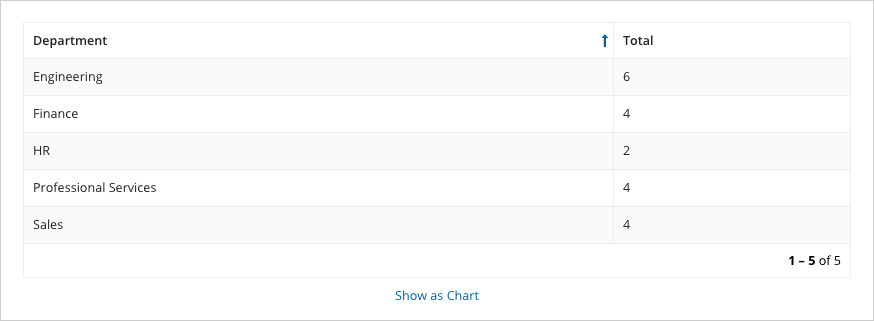
Aggregate data and conditionally display it in a pie chart or grid. In this pattern, we will calculate the total number of employees in each department and display it in a pie chart and a read-only grid. Then, we'll use a link field to conditionally display each component.
This design pattern is not recommended for offline interfaces because reflecting immediate changes in an interface based on user interaction requires a connection to the server.
Note: This expression uses direct references to the Employee record type, created in the Records Tutorial. If you've completed that tutorial in your environment, you can change the existing record-type references in this pattern to point to your Employee record type instead.
This scenario demonstrates:
This recipe uses references to record types and record fields. To use this recipe, you will need to update the references to record types and record fields in your application.
1
2
3
4
5
6
7
8
9
10
11
12
13
14
15
16
17
18
19
20
21
22
23
24
25
26
27
28
29
30
31
32
33
34
35
36
37
38
39
40
41
42
43
44
45
46
47
48
49
50
51
52
53
54
55
56
57
58
59
60
61
62
63
64
65
66
67
68
69
70
71
72
73
a!localVariables(
  /* This variable is set to true initially and is referenced in the showWhen parameters for
     the pie chart and inversely in the grid. The dynamic link at the end reverses this value
     on click. */
  local!displayAsChart: true,
  /* Since we want to pass the data to the pie chart and the grid, we query for the data in
     a local variable. Otherwise, we would just query directly from the data parameter of
     the gridField(). */
  local!datasubset: a!queryRecordType(
    recordType: recordType!Employee,
    fields: a!aggregationFields(
      groupings: a!grouping(
        field: recordType!Employee.fields.department,
        alias: "department"
      ),
      measures: a!measure(
        field: recordType!Employee.fields.id,
        function: "COUNT",
        alias: "id_count"
      )
    ),
    pagingInfo: a!pagingInfo(startIndex: 1, batchSize: 5000)
  ),
  {
    a!pieChartField(
      series: {
        a!forEach(
          items: local!datasubset.data,
          expression: a!chartSeries(
            label: fv!item.department,
            data: fv!item.id_count
          )
        )
      },
      colorScheme: "BERRY",
      style: "DONUT",
      seriesLabelStyle: "LEGEND",
      /* Since the initial value is true, the pie chart displays on load. We could change
         the initial value of local!displayAsChart to swap that behavior without having to
         otherwise change the logic of this interface. */
      showWhen: local!displayAsChart
    ),
    a!gridField(
      data: local!datasubset.data,
      columns: {
        a!gridColumn(
          label: "Department",
          sortField: "department",
          value: fv!row.department
        ),
        a!gridColumn(
          label: "Total",
          sortField: "id_count",
          value: fv!row.id_count
        )
      },
      /* Here the grid only shows when local!displayAsChart is not true. */
      showWhen: not(local!displayAsChart),
      rowHeader: 1
    ),
    a!linkField(
      labelPosition: "COLLAPSED",
      links: a!dynamicLink(
        label: "Show as " & if(local!displayAsChart, "Grid", "Chart"),
        /* The not() function simply converts a true to false, or false to true, which
           simplifies the toggle behavior. */
        value: not(local!displayAsChart),
        saveInto: local!displayAsChart
      ),
      align: "CENTER"
    )
  }
)
Aggregate Data and Conditionally Display in a Chart or Grid
