| The capabilities described on this page are included in Appian's advanced and premium capability tiers. Usage limits may apply. |
OverviewCopy link to clipboard
Appian's data fabric allows developers to stitch together data from multiple sources into a single, unified data fabric. With your data in a central location, you can build applications faster. But it's not just developers who benefit from a unified data fabric. You can allow any user to explore your enterprise data so they can discover new business insights.
With Appian's self-service analytics capabilities, users can browse enterprise data and build their own custom reports. When they partner with Appian AI Copilot, users can dig deeper into their data using AI generated insights to identify patterns, trends, and outliers.
Self-service analytics allows any user to answer common questions about enterprise data on their own, which frees up developers to build the more complex, data-rich reports and processes that need their full expertise.
To allow end users to leverage Appian's self-service analytics capabilities, you must:
- Choose which record types are available in self-service analytics.
- Review security on your record types.
- Allow users to build, share, and view reports.
- (Optional) Prepare data for end users.
- (Optional) Enable Appian AI Copilot.
About self-service analyticsCopy link to clipboard
Self-service analytics allows end users to reuse your application data so they can explore and analyze data on-demand. In this section, you'll see how the data concepts you already know are presented to end users, and how they can leverage that data to uncover new insights.
DatasetsCopy link to clipboard
As a developer, you’re familiar with the record type and how relationships and record type security let you access data from the record type and its related record types. To end users, we use datasets to represent this same capability so they don't need as much familiarity with the technical details of your data fabric.
Each dataset is made up of a record type and its one-to-one and many-to-one related record types. For example, the image below illustrates the Customers dataset, where the Customer record type is the base record type. Based on the one-to-one and many-to-one relationships configured on the Customer record type, this dataset would include data from the Customers, Districts, Addresses, and Credit Cards record types.
A dataset will not include data from one-to-many relationships. So if the Customer record type has a one-to-many relationship to the Order record type, it would not appear in the Customers dataset. Instead, a user could explore order and customer data together using the Orders dataset, so long as the Order record type has a relationship to the Customer record type.
Users can learn more about a dataset by hovering over the vendor logos. The following image highlights the elements that make up a dataset:
| # | Element |
|---|---|
| 1 | The data source of the base record type, represented by the vendor logo. In the example above, the Appian logo represents the Appian Cloud database. Users can hover over the logo to see the source type and the source name of the base record type. |
| 2 | The number of rows in the base record type as of the last full sync. |
| 3 | The number of data sources included in the dataset. This number includes the data source of the base record type. |
| 4 | The data source of each related record type, grouped by vendor. Only the unique vendor logos will display here. Users can hover over each logo to see which data comes from each source. |
ReportsCopy link to clipboard
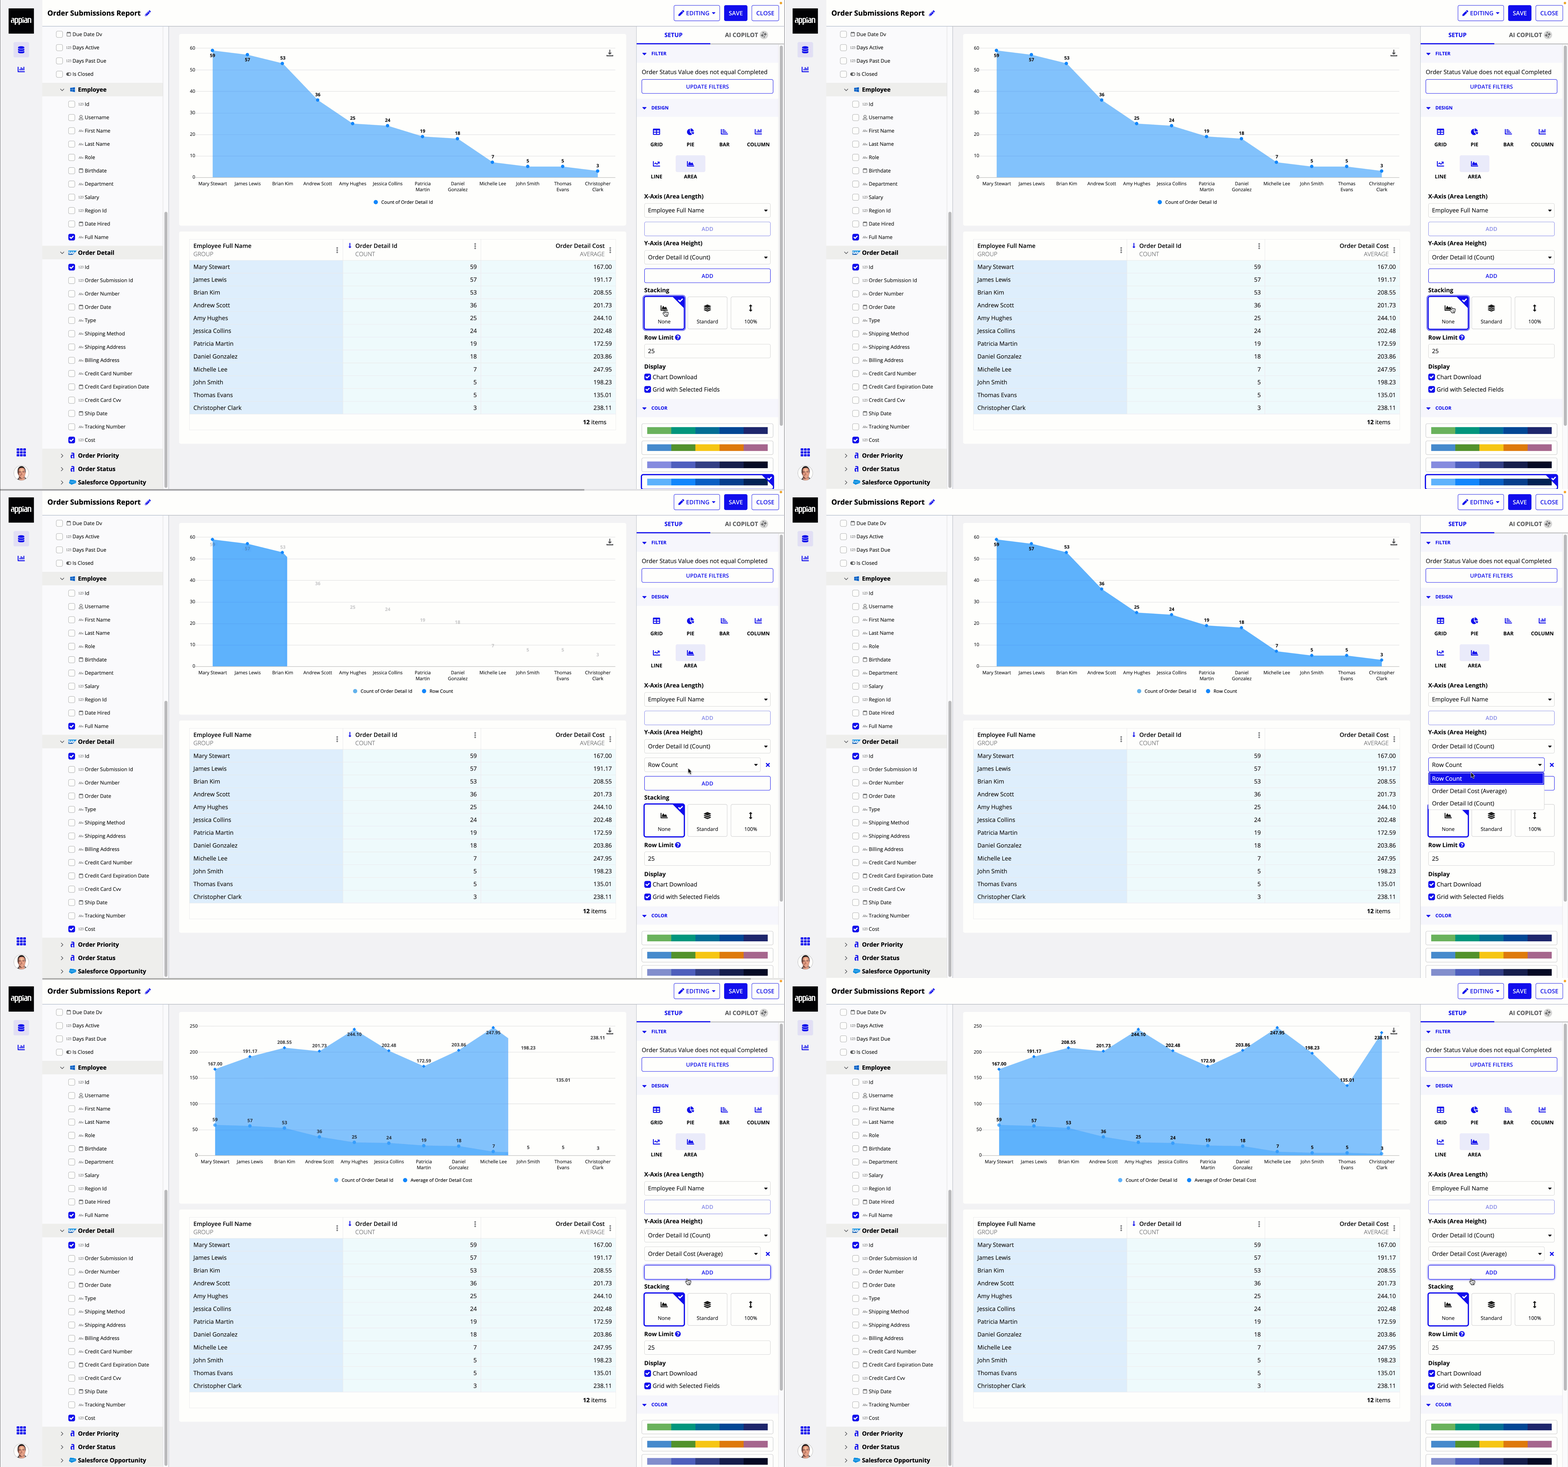
Using any dataset as a starting point, users can further explore and analyze their data by displaying hand-picked fields in a grid, chart, or both. Then, they can filter, sort, and format that data to meet their specific needs.
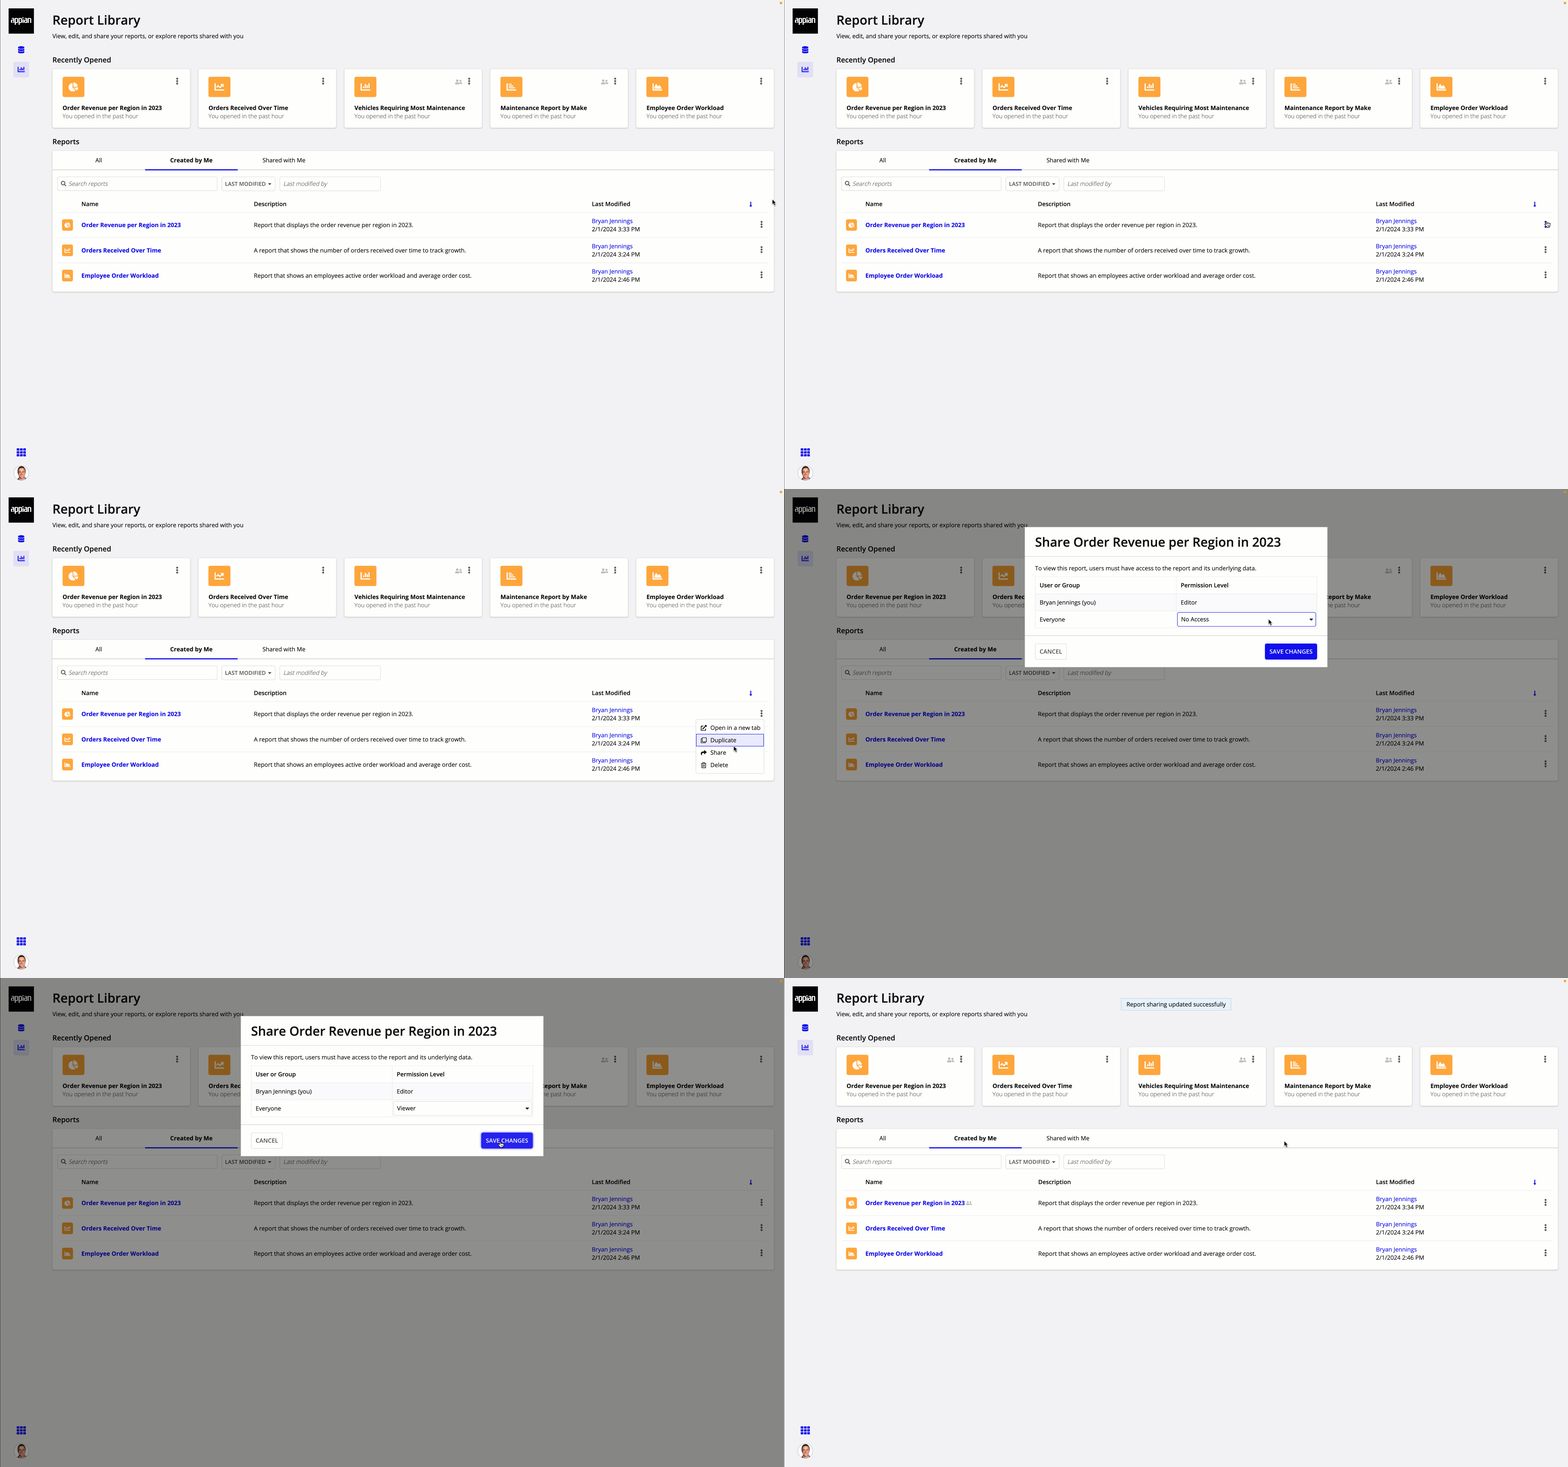
Once they finish building their report, users can save the report for future exploration. By default, a report is only available to the user who created it. To collaborate across the organization, a user can share their report with everyone in the Data Fabric Report Creators system group. Once the report is shared, anyone with Viewer permissions to the record types used in the report can view it.
Chat powered by AI CopilotCopy link to clipboard
| These capabilities are included in Appian's premium capability tier. Usage limits may apply. |
Tip: To access this feature, provide credentials for the Azure OpenAI Service in the Admin Console.
Users can gain new insights about a report using Appian AI Copilot.
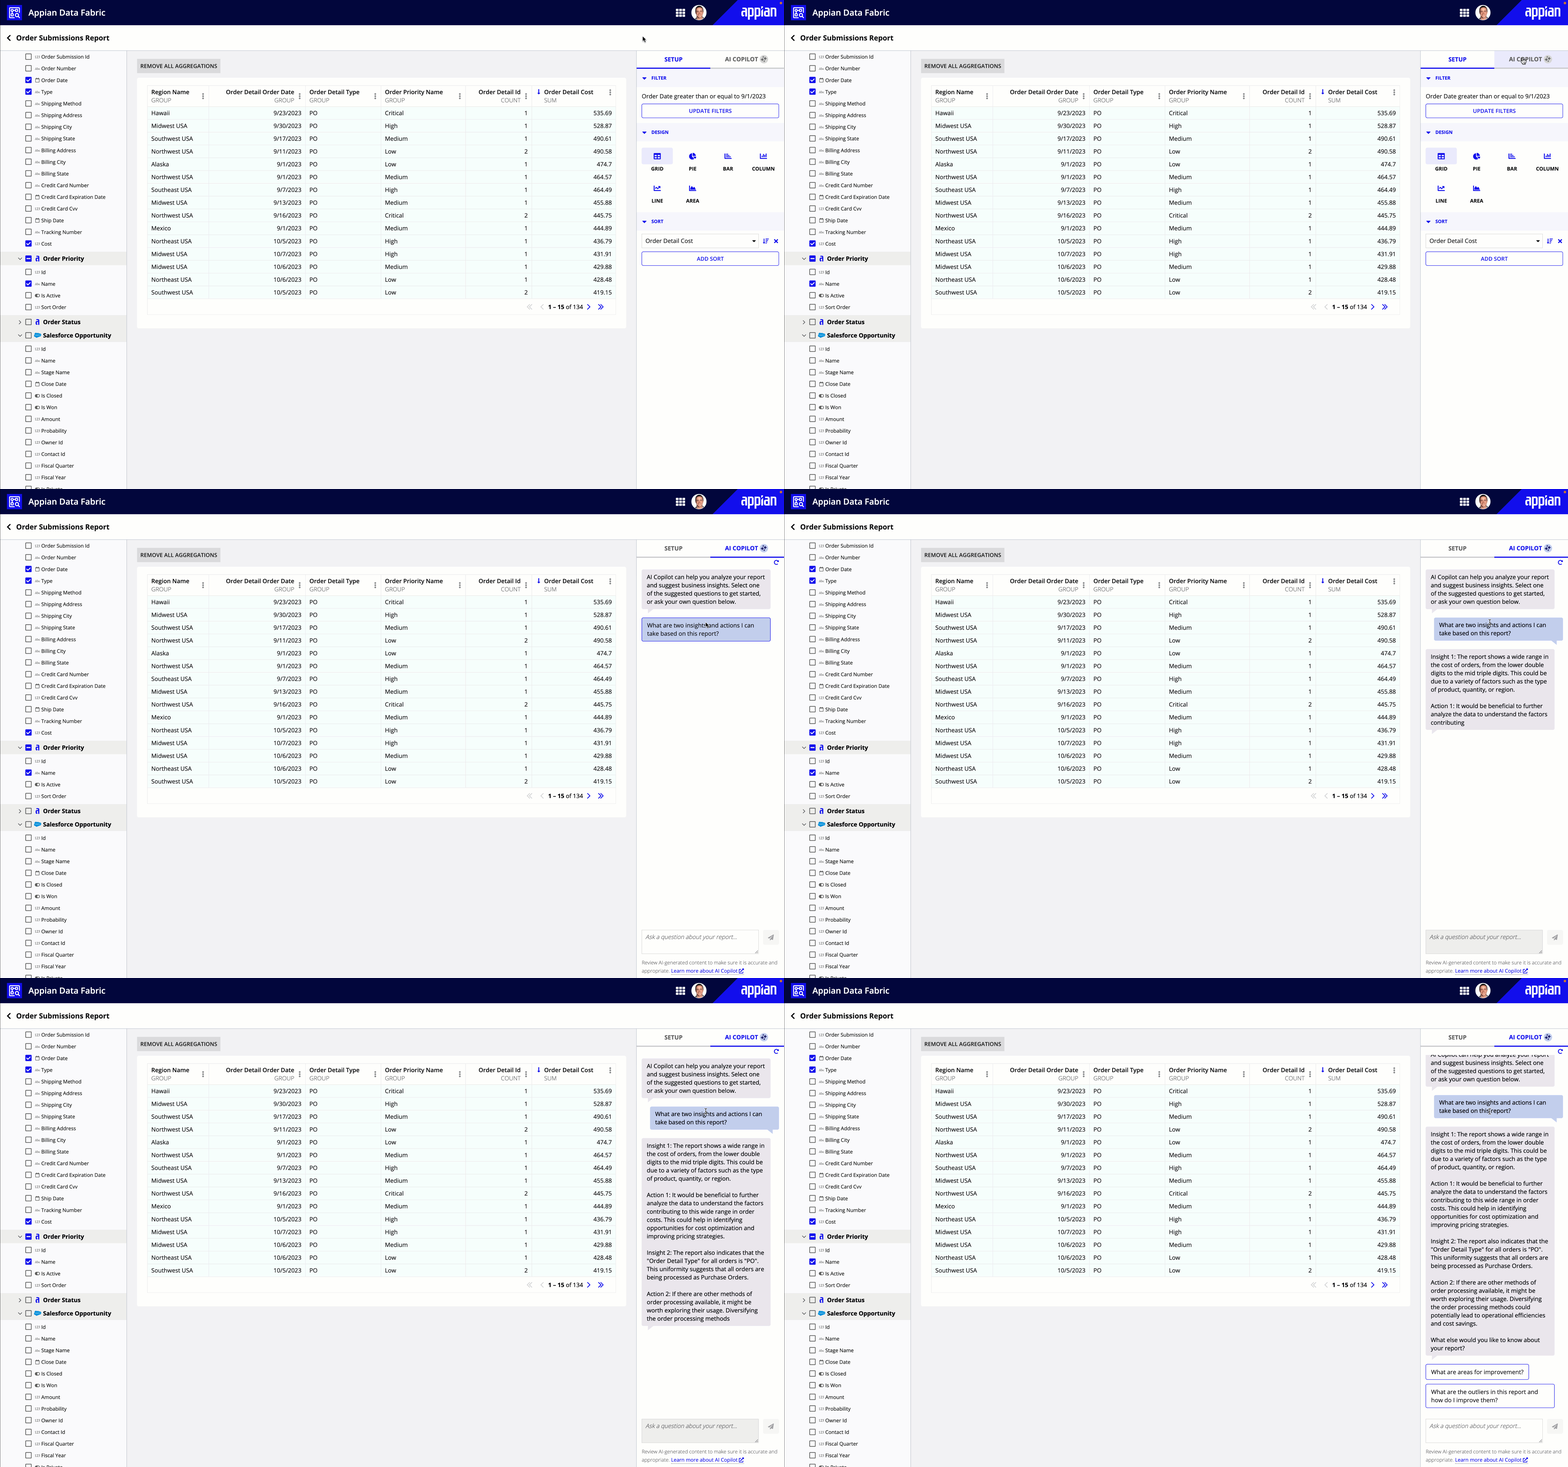
Users can ask AI Copilot questions about the report data, or select from a list of suggested questions to discover potential areas of improvements and next steps.
AI Copilot can only analyze aggregate data. This means that AI Copilot is only available for reports that either group data or apply a calculation to their data (like sum, count, or average).
Tip: AI Copilot can only assist users in understanding their custom-built reports; it can't build reports for them.
Choose which record types are available in self-service analyticsCopy link to clipboard
Before you allow users to explore your data fabric, you must decide which data is available to them.
By default, new record types are not available in self-service analytics. You can display any record type with data sync enabled as a dataset in self-service analytics.
Note: On upgrade to 24.1, any record types available in Tempo will automatically be available in self-service analytics.
Review the record types in your environment to determine which data should be available to end users. You should only allow users to access record types necessary for reporting.
To display a record type in self-service analytics:
- In the record type, go to Workspaces.
- Select the Show this record type as a dataset in self-service analytics checkbox.
- Click SAVE CHANGES.
The record type will now display as a dataset in the Data Catalog. The record data will also be available in datasets where the record type is configured as a related record type.
Review security on record typesCopy link to clipboard
Once you determine which record types are available in self-service analytics, you can specify which users can view data from those record types.
Each dataset will inherit the record type object security and record-level security configured on the record type and its related record types. If you've already secured these aspects of your record type, there's likely no additional configuration necessary.
Users must have the following security configurations to view or use the record data in a report:
- At least Viewer permission on the record type.
- Record-level security that allows them to see the appropriate records (or rows of data in the dataset).
Tip: As a best practice, you should configure the record type security so that Default (All Other Users) is set to No Access. This ensures that only users who have been specifically granted permission to the record type are allowed to see the record data.
To view all the data in a dataset, a user must have the above security configurations on the base record type and on any related record types.
Allow users to build, share, and view reportsCopy link to clipboard
Once you've given users the appropriate security, you must allow them to build, share, and view self-service reports in the end-user workspace.
To allow users to build, share, and view reports, you must add them to the Data Fabric Report Creators system group.
Once added to the system group, a user can start using Appian's self-service analytics capabilities by selecting Data Fabric Analytics from the navigation menu.
Prepare data for end usersCopy link to clipboard
Self-service analytics gives users the flexibility to explore your record types as datasets.
Each dataset will reflect the name, description, fields, and relationships configured on a synced record type. To provide users with the best experience, you should review the follow elements of your record type since they will be visible to end users.
Record type display nameCopy link to clipboard
Each dataset is labeled with the Display Name (Plural) value from the record type.
Review the record type's display name to ensure that it does not include an application prefix and that it can be easily understood by end users.
To edit the record type’s display name:
- In your record type, go to Settings > Properties.
- Update the Display Name (Properties) as needed.
- Click SAVE CHANGES.
Record type descriptionCopy link to clipboard
When a user hovers over a dataset, they will see the record type’s description.
Review the record type's description to ensure it does not include any developer terminology (like "record type" or "data sync enabled"), and that it is useful to an end user. The description should help users understand whether or not this is the information they’re looking for.
To edit the record type’s description:
- In your record type, go to Settings > Properties.
- Update the Description as needed.
- Click SAVE CHANGES to close the dialog.
- Click SAVE CHANGES to save the record type.
Field namesCopy link to clipboard
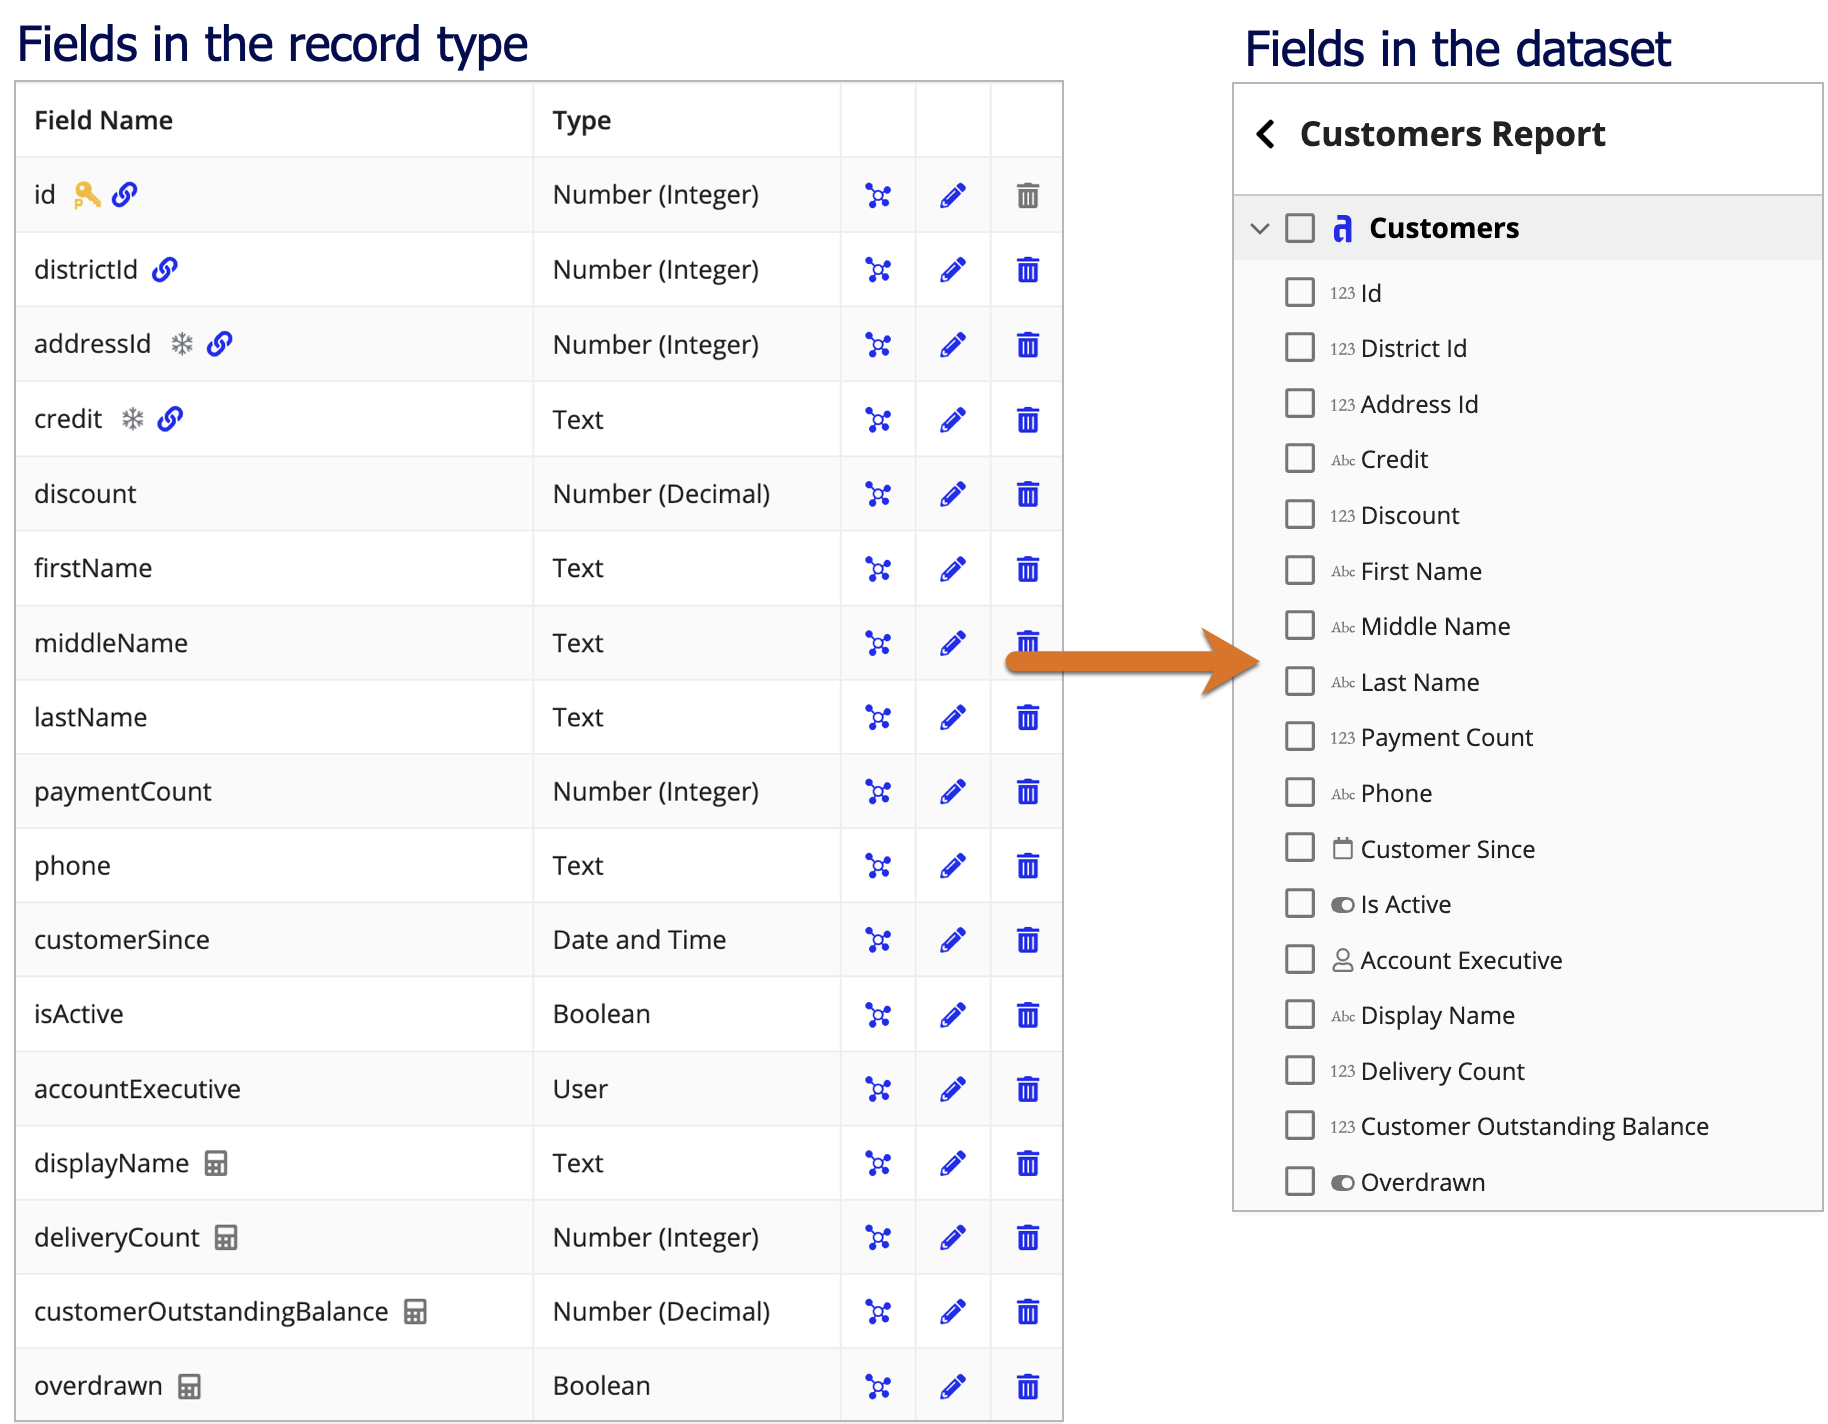
When a user selects a dataset, they will see a list of fields from the base record type and any one-to-one and many-to-one related record types. They can use these fields to build a grid or chart that aggregates, filters, or sorts the dataset.
To ensure users can easily find the fields they need:
- Use camel case formatting for all record field names. A dataset will convert any camel case field names to title case field names so they're easier to read. For example, if you have a record field called
lastName, it would be converted toLast Namein the dataset. - Logically group record fields together. The fields in a dataset will appear in the same order as the fields in the record type. Ensure that fields like
firstNameandlastName, oraddressandzipCodeare grouped together in the record type's data structure. This will ensure that the fields appear next to each other when a user selects fields for their report. Note that you cannot reorder custom record fields.
The image below illustrates how the fields in the Customer record type appear to end users in a dataset:
To edit the name and order of a record field:
- In your record type, go to Data Model.
- Click MAP RECORD FIELDS.
- To rename a field, update the Record Field Name.
- To reorder a record field, click
 Drag to reorder and place the field in the proper order.
 - Click FINISH.
- Click SAVE CHANGES.
Relationship namesCopy link to clipboard
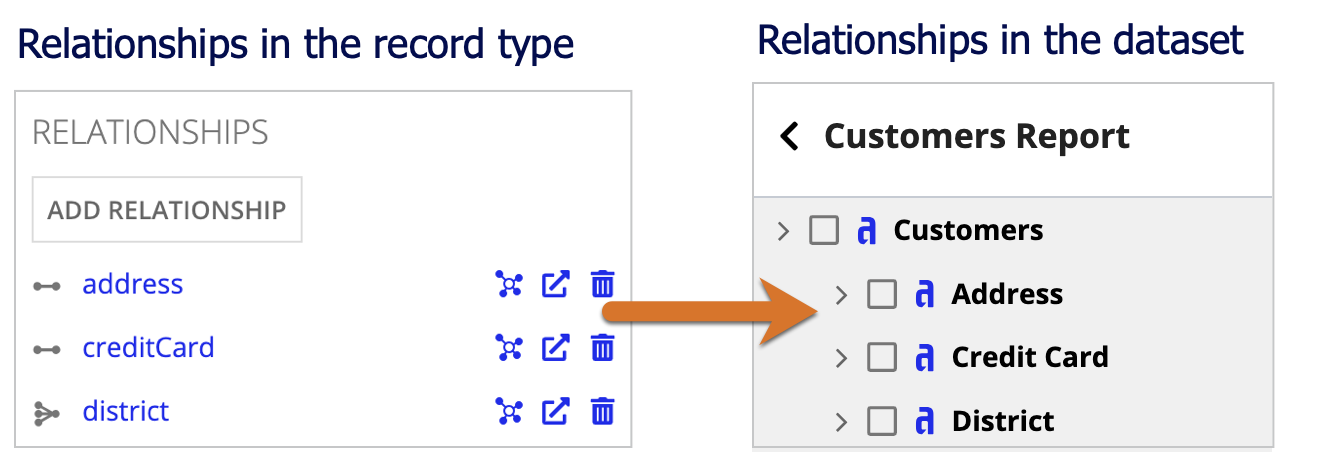
When a user selects a dataset, the data from any one-to-one or many-to-one relationships will appear under the relationship name. For example, the image below displays the Customers dataset, where the related data appears under the relationship names.
Review your relationship names to ensure that they are easily understandable and do not include an application prefix. For example, if you have a relationship name like ARregion, you should update the name to region so it displays as Region in a dataset.
To edit a relationship name:
- In your record type, go to Data Model.
- Under RELATIONSHIPS, click the relationship name you want to edit.
- Update the Relationship Name as needed.
- Click OK.
- Click SAVE CHANGES.
Data source logosCopy link to clipboard
Each dataset will display the data source of the base record type and its related record types using vendor logos. The vendor logos that appear on a dataset are the same as the logos that appear in the record type relationship diagram.
A dataset will automatically display the logos for any Appian supported databases and certain connected systems.
The following connected systems will not automatically display a vendor logo, but you can manually configure a logo to display:
To display a vendor logo for these connected systems, select an image for the System Logo in the connected system's properties.
Troubleshooting and limitationsCopy link to clipboard
As a developer, you may be asked to troubleshoot or explain certain aspects of self-service analytics to your users. Use the section below to troubleshoot and address user questions.
Unavailable datasetsCopy link to clipboard
There are two reasons why a dataset may be unavailable in self-service analytics:
| Reason | End User Impact | Troubleshooting |
|---|---|---|
| The record type failed to sync. | Users cannot select the corresponding dataset, use the data in a report, or view the data in a report. | Review the status and history of syncs associated with your record type to ensure your data is syncing successfully. See troubleshooting data sync for information on how to resolve sync issues. |
| The user does not have access to view the record type. | Users cannot see the corresponding dataset in the Data Catalog, or view or edit a report that uses the record data. | Review security on the record type to ensure the right users have access to the right data. |
Unanswered questions from AI CopilotCopy link to clipboard
If AI Copilot cannot analyze a report, it may be because:
- The report does not contain any aggregated data. Users must either group data or apply a calculation (like sum, count, or average) to aggregate data for analysis.
- The report is too large. User should remove fields or apply a filter to reduce the number of rows.
- The user has exceeded the token limit of the Azure OpenAI Service license. This will require the user to start a new session.
Sessions and token limitsCopy link to clipboard
A session is a conversation between a user and AI Copilot. During a session, a user can ask AI Copilot questions about their data. At some point, a user may receive a message from AI Copilot indicating that the conversation has reached its limit. This occurs when the user exceeds the token limit on a given session. The number of questions a user can ask AI Copilot in a given session is determined by the token limit of your Azure OpenAI Service license.
If a user hits the limit, they will need to start a new session to continue asking questions about their report. Users will either be promoted to start a new session, or they can click Restart your conversation with AI Copilot to manually start a new session.
AI Copilot won't remember questions from a previous session. If a user starts a new session, AI Copilot won't have any context about the previous conversation. This means AI Copilot won't have answers to follow-up questions from a previous session. Users will need to provide AI Copilot with the necessary context at the beginning of each session.
Learn more about AI Copilot.
Self-service analytics on mobile devicesCopy link to clipboard
Self-service analytics is not supported on mobile devices.
AccessibilityCopy link to clipboard
Self-service analytics is not fully accessible. Users with disabilities including blindness, low vision, color perception, and mobility limitations may experience difficulty performing some tasks or functions in the workspace.


