| Process Mining is deprecated with Appian 24.2 and will no longer be available in an upcoming release. Instead, we encourage customers to use Process HQ to explore and analyze business processes and data. |
The Insights page lets you dive deeper into your processes. You can choose between two analysis modes: Root Cause and Distribution. Switch between those two at the top of the Insights page.
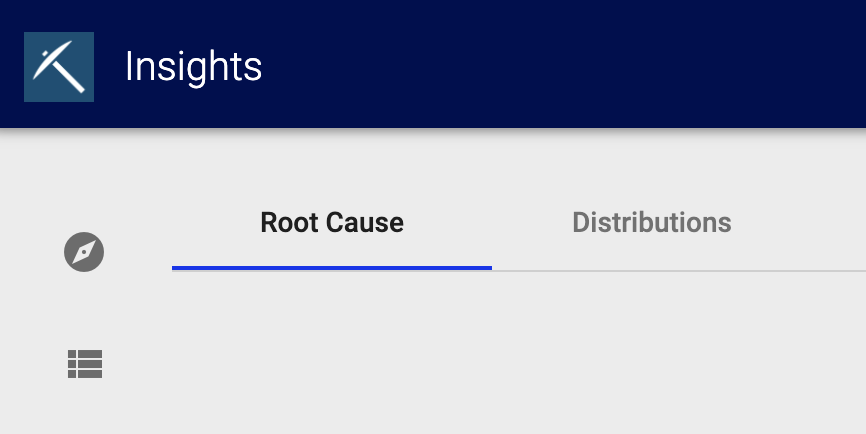
Choose an analysis modeCopy link to clipboard
The Insights page lets you investigate the discovered process, but where do you start? That depends on what type of information you're interested in:
- Root cause analysis is useful for locating process errors and uncovering their underlying causes. If the underlying cause is found to affect other areas of the process, you might also find it useful to apply the same remedies to additional areas.
- Distribution analysis is useful for spotting trends among multiple dimensions within your data.
Root Cause analysisCopy link to clipboard
Root cause analysis splits the available data set in respect to a deviation, duration, or follower relationship. One part of the data set contains the deviation, has a certain duration, or follower relation and the other part does not. Following attributes, their values, and their relation occurring in one of the areas are compared against each other.
Note: Filters apply to root cause analysis. Filters limit the data foundation the analysis is done on. Review your current filters to ensure you're analyzing the complete set of data you're interested in.
When you first open the Root Cause page, no results appear yet. This is because the focus must be set before an analysis can be started.
- To get started, choose the focus of your analysis:
- PROCESS DEVIATION: See a list of deviations within your discovered process. Deviations are only available if a target model is connected and multiple variant groups are displayed.
- CASE DURATION: Analyze process instances that fall within the Minimum duration and Maximum duration you set.
- DIRECT FOLLOWER: Choose two activities to analyze their relationship. Then specify their expected relationship:
- Activities must follow each other: Follower relationship must exist between both activities, but there may be other activities between them.
- Activities must follow each other directly: Follower relationship must exist between both activities, but no other activities may lie between them.
- Activities must never follow each other: There must be no follower relationship between the two activities, not even if there are other activities between them.
- Activities must never follow each other directly: There must be no follower relationship between the two activities.
- (Optional) Click FILTER to apply your configurations as a filter, rather than run an analysis.
- Click ROOT CAUSE to continue configuring the analysis. Choose whether to:
- Remove current filter settings: Clears any filters currently applied to the data.
- Configure attributes used: Choose to exclude any attributes from the analysis.
- Configure parameters used: Choose values for the follow options:
- Accuracy Threshold: stops the rule discovery if the accuracy of the rules drops below the threshold.
- Maximum Description Length Growth: stops the rule discovery if adding new rules will increase the minimum description length of the current rule set by the amount specified.
- Maximum Iterations: stops the rule discovery if the limit for the number of rule growing and pruning iterations has been reached.
- Timeout (ms): stops the rule discovery if it takes longer than the timeout value in milliseconds.
- Number of Binary Scans: perform a binary search over the range of the numeric attribute up to a depth lower than the threshold when growing the rules.
- Maximum Number of Attribute Values: consider only categorical attributes that have less attribute values than the threshold when growing the rules.
- Number of Folds: defines how the data for the rule creation is split, with folds - 1 parts of the data for the growing set and 1 part for the pruning set.
- Number of Optimization Passes: defines the number of iterations for the rule optimization phase of the algorithm.
- Covered Fraction Threshold: defines a minimum for the fraction of correctly classified positive instance by all rules.
- Description Length Redundancy: defines an adjustment for possible redundancy in the attributes when computing the description length of rules.
- Click RUN to start the analysis.
While Appian runs the root cause analysis, you can continue to use Process Mining. As soon as the analysis is finished, a message appears at the bottom of the screen, which allows you to jump directly back to the root cause analysis page.
Results of the root cause analysisCopy link to clipboard
After a successful root cause analysis, the analysis results are displayed.
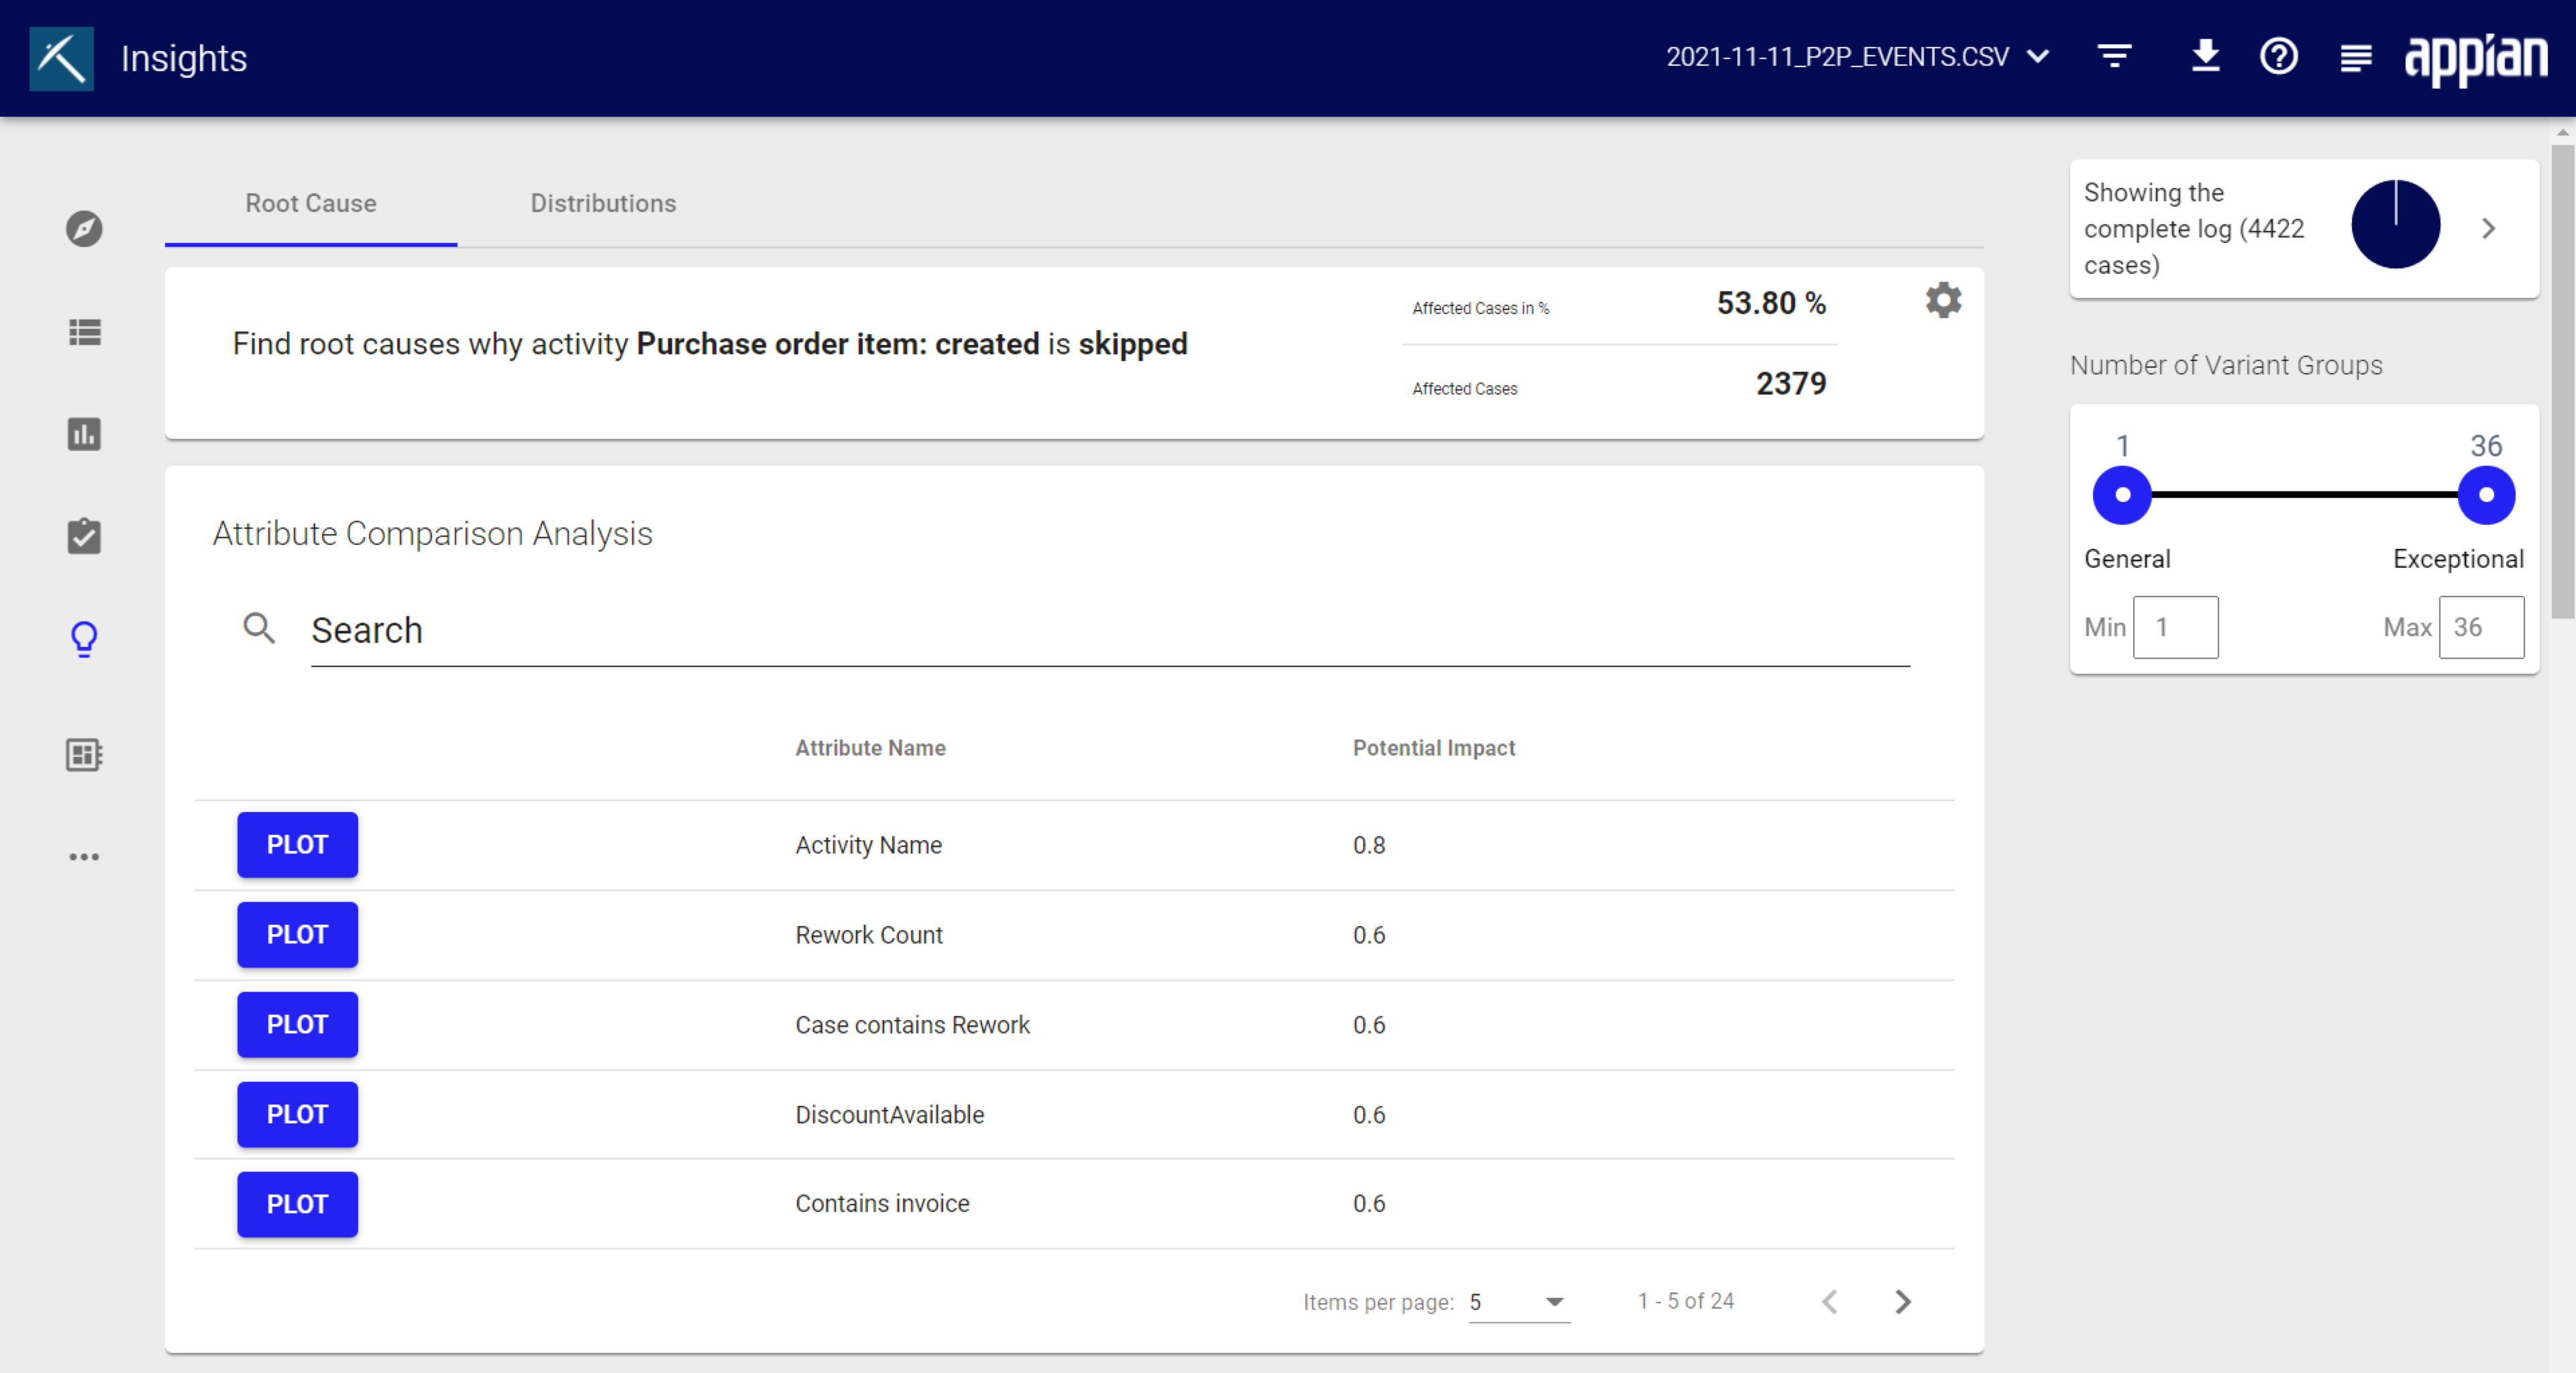
Root cause analysis results are divided into four sections:
- Overview
- Attribute comparison analysis
- Last result for causal rules
- Most important categorical attributes
OverviewCopy link to clipboard
The top of the results show you the parameters of your analysis request. For example, Find root causes for cases in which activity Vendor invoice: created is eventually followed by Vendor invoice: payment..

Click this statement to view the additional options you configured when starting the analysis. This creates a filter, and a corresponding filter card appears in the filter panel.
This section also displays the percentage of affected cases and the number of affected cases is shown.
Attribute comparison analysisCopy link to clipboard
The attribute comparison analysis focuses on the occurring attribute values. It compares how often which attribute values occur in the affected area and in the unaffected area. Thus the column chart shows how distinct the attribute values are between the affected and the non-affected area. 1 means they have no overlap at all and are therefore very good indicators for a root cause.
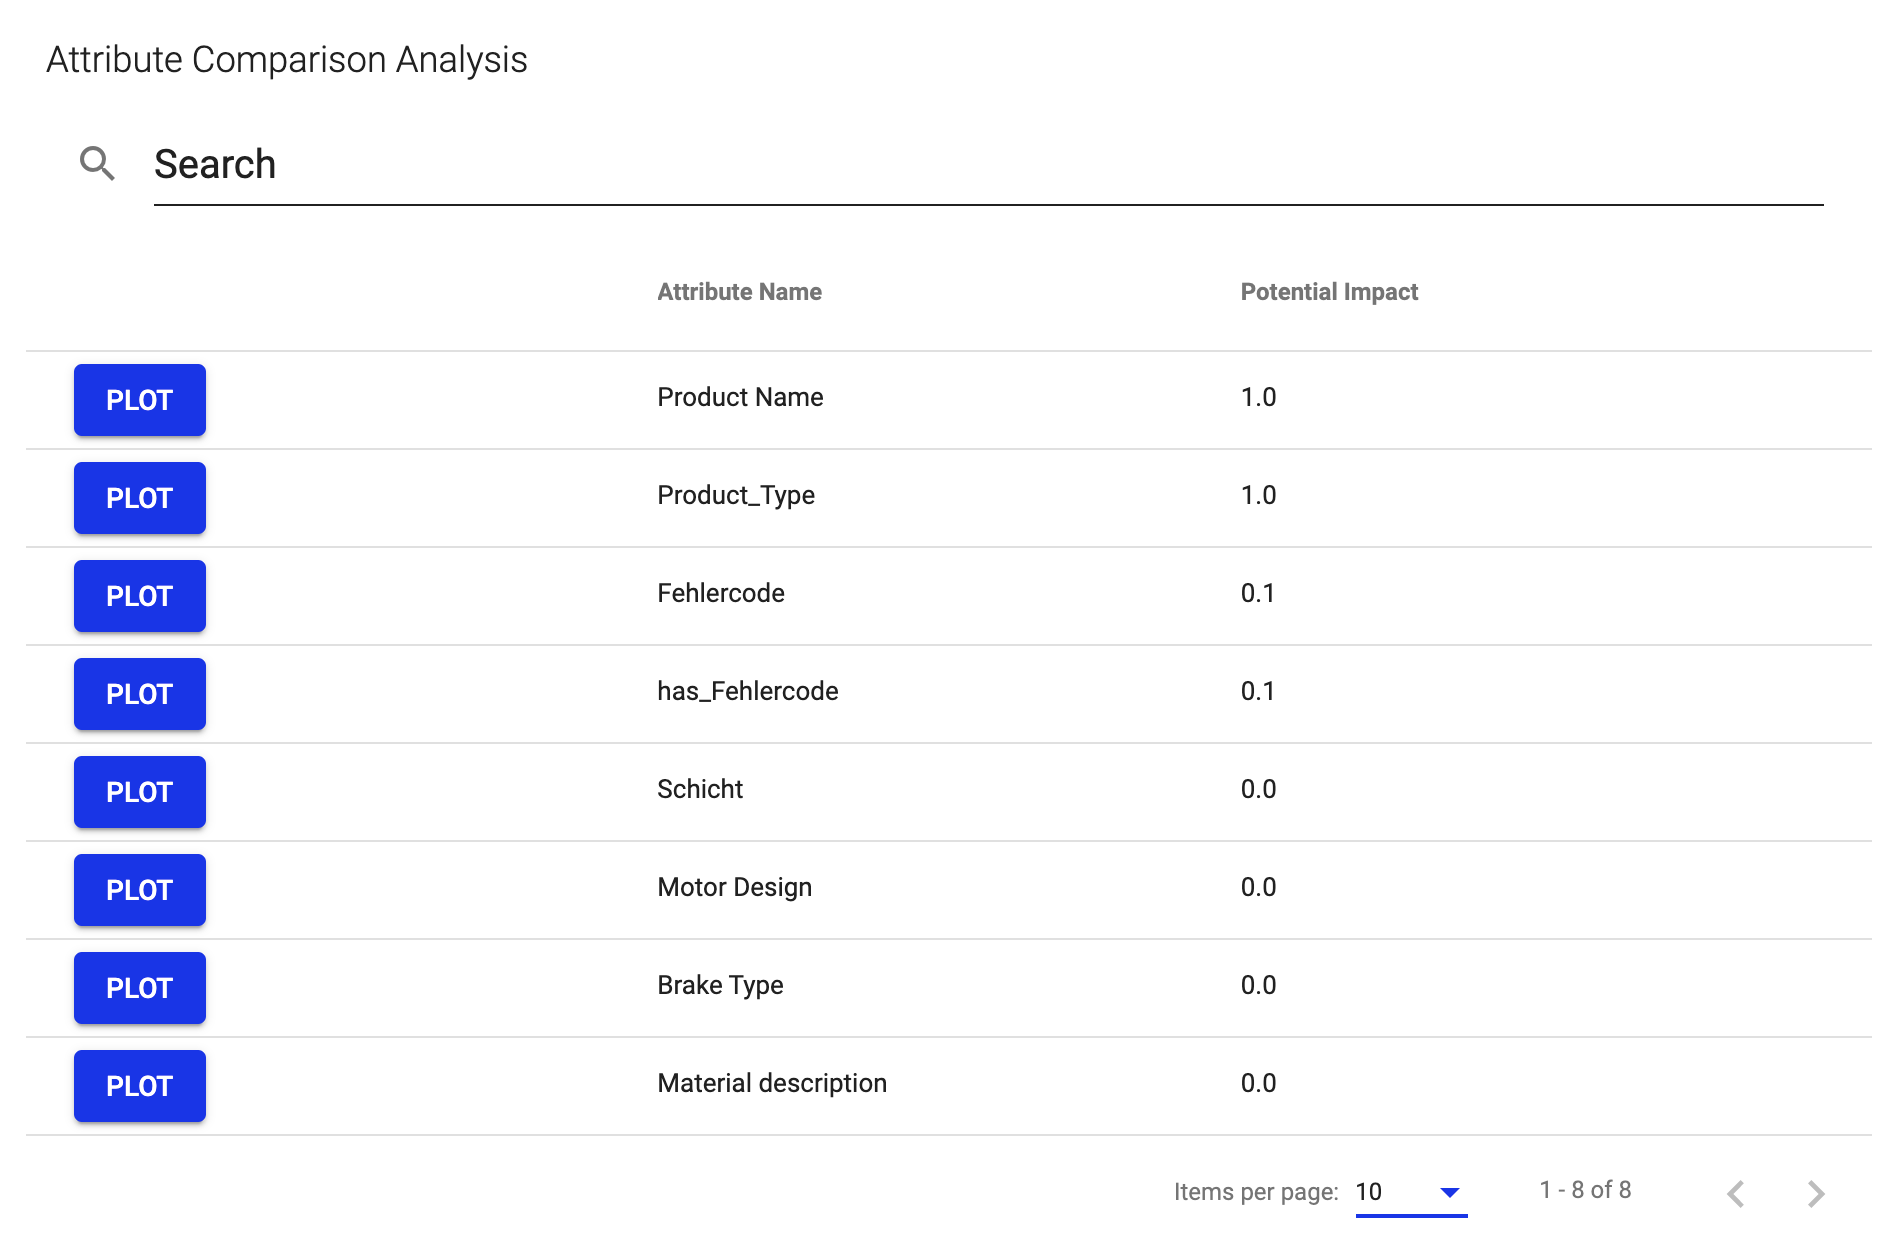
For example, if you have two countries and the value is 1 it would mean that all affected cases are only happening in one country. 0 means they have a massive overlap and there is no difference in the attribute distribution. That is, the problem would occur similarly in Country 1 and 2.
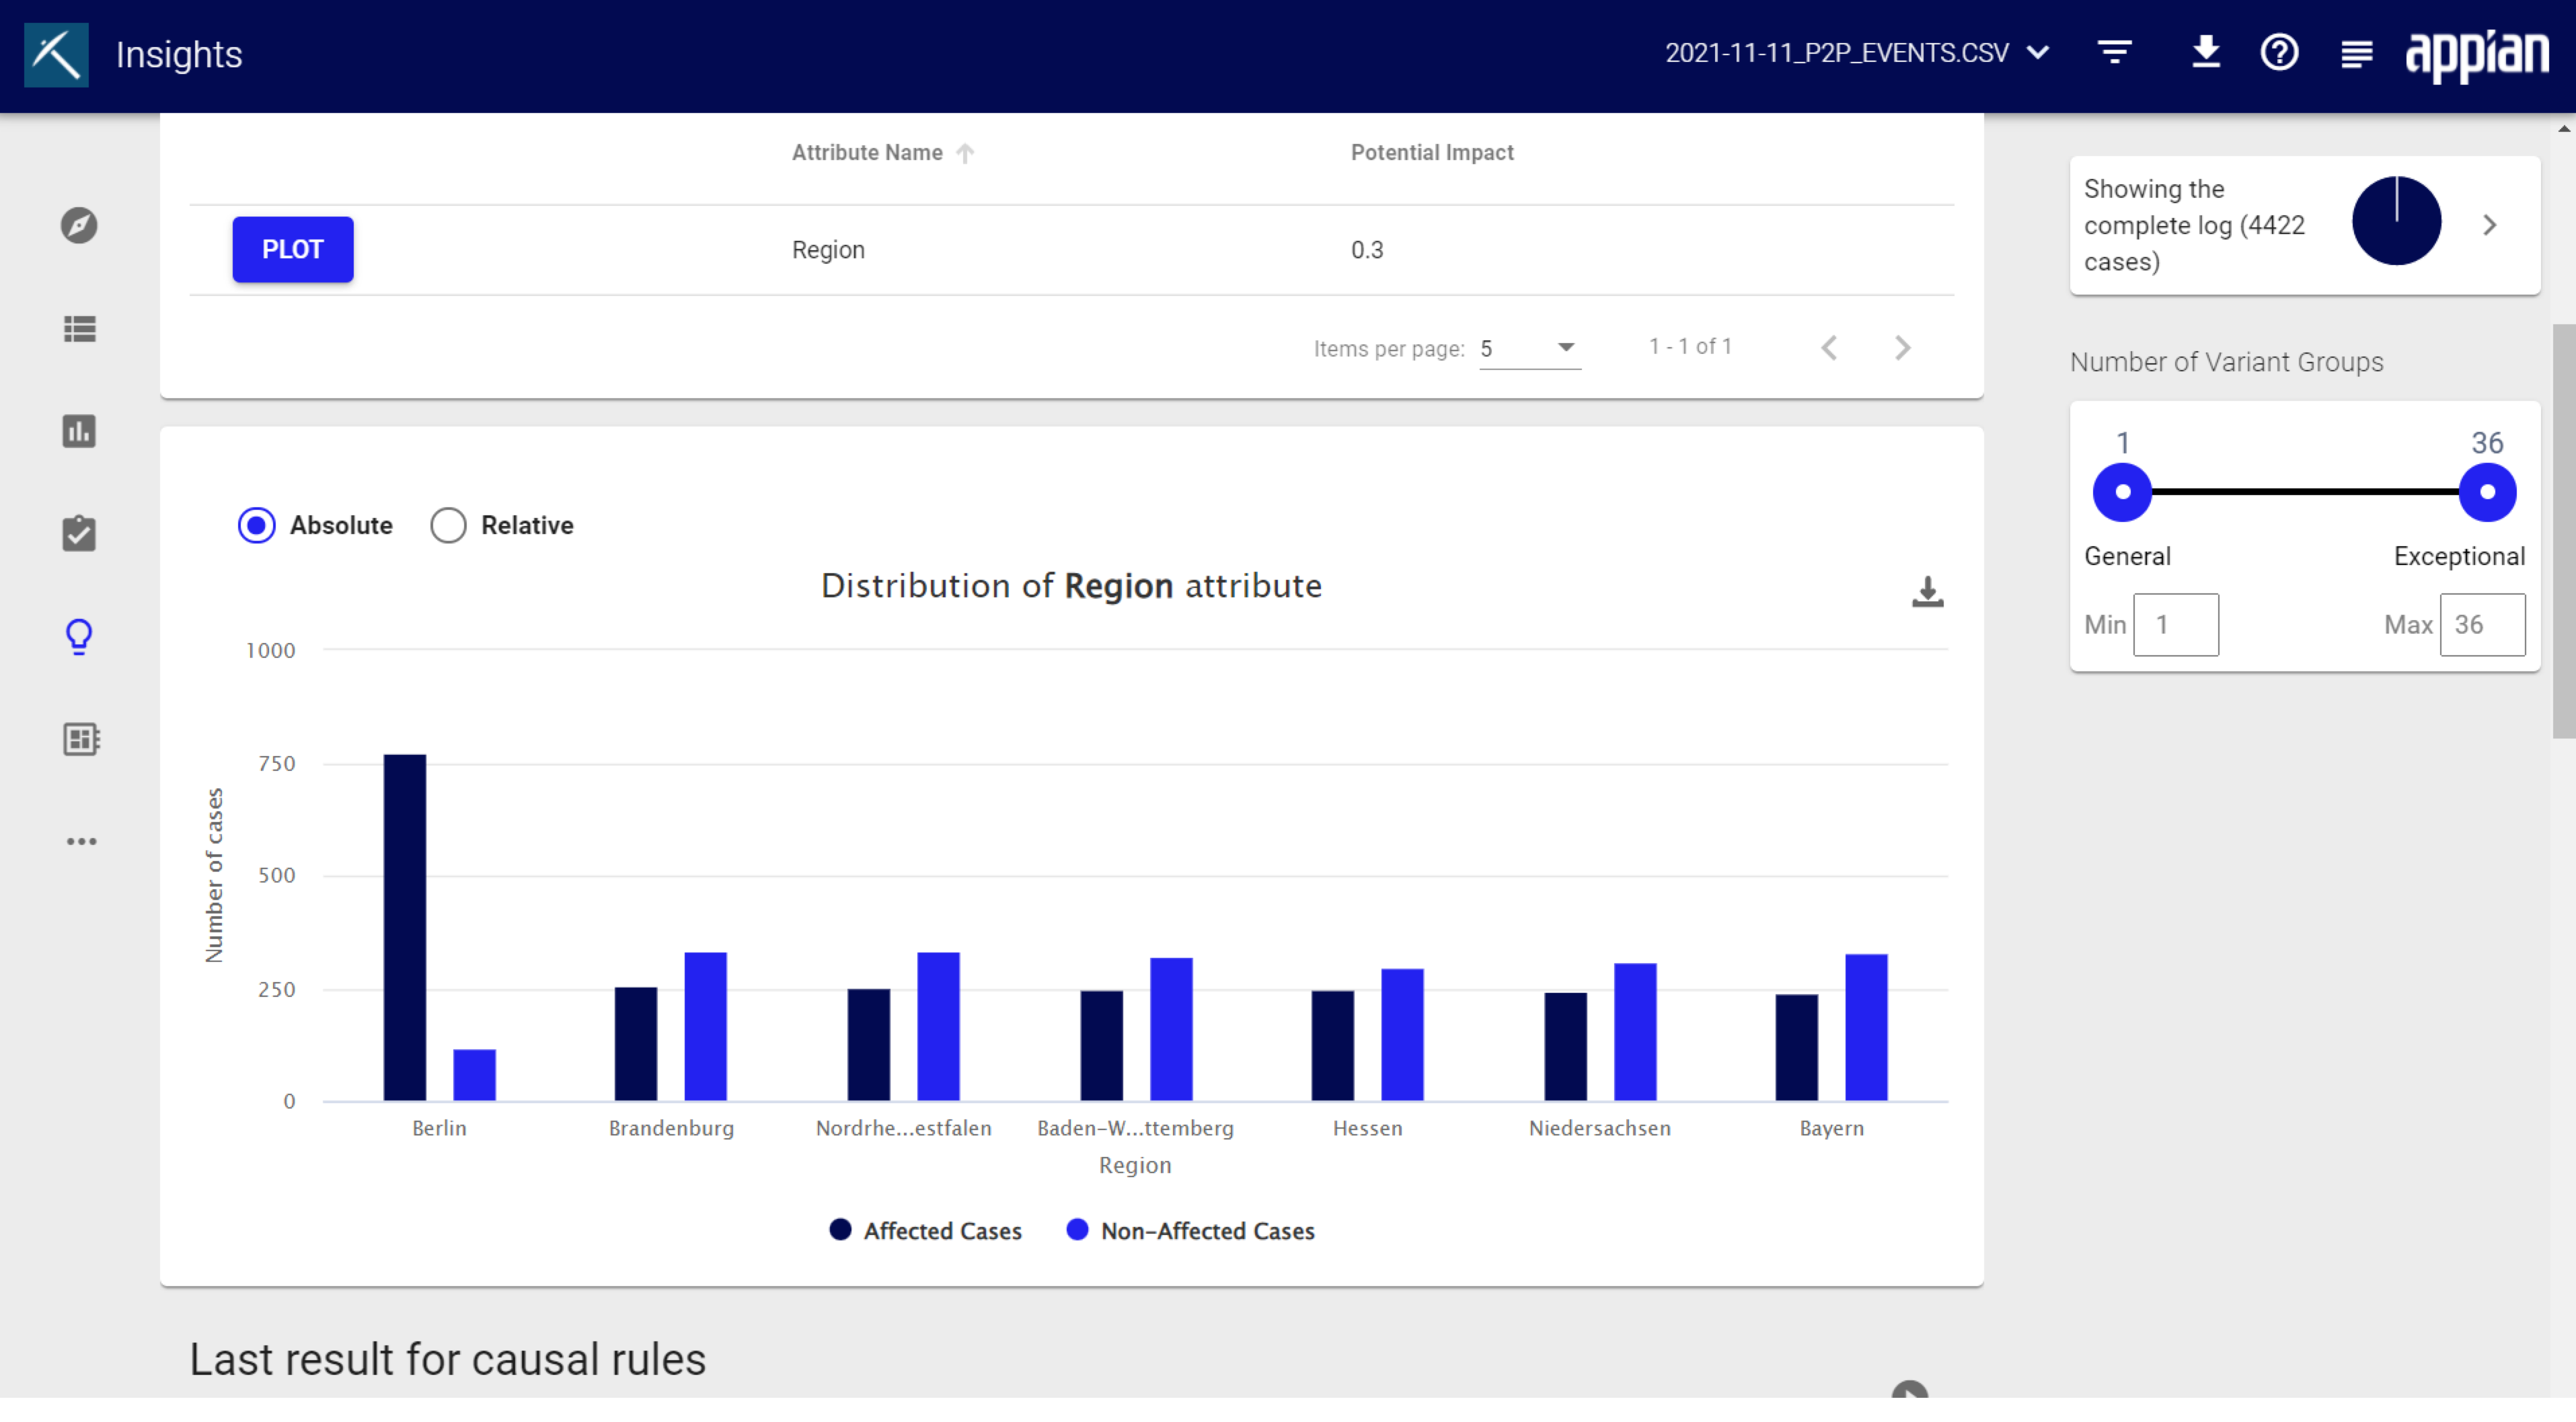
Click PLOT to see a graph of this information. You can decide whether the graph shows absolute or relative numbers. Click Download to save the graph.
Last result for causal rulesCopy link to clipboard
This section shows common patterns in your process that might have an impact on its performance and conformance. The root cause analysis automatically identifies possible causal rules that might affect the performance of the process. A causal rule is attribute correlation that occurs more frequently in the focus area.
In addition to the rule itself, this section displays a percentage and the number of cases in the focus area that is covered by this rule. The third column also displays the accuracy of the rule. Click Show settings to exclude certain attributes. Click Re-run with current filters to see how these rules change based on excluding attributes.
Example:
The data set contains 2000 cases. The affected focus region, e.g. all cases where "Resolution & Recovery" is skipped, concerns 365 cases of the 2000 total cases processed. A rule is derived from these cases, for example costs > 6000 . This rule can be applied to a certain percentage of cases in the focus region (column 2). However, the rule found need not apply to all cases in the focus area (column 3). Therefore, the second column specifies the coverage and the third column specifies the accuracy of the rule.
If the rules found are not sufficient to answer analysis questions, click Find More Rules to identify further causal rules. Note that the rules become less accurate or cover fewer of the cases considered.
Click Show settings to see which attributes of the data set were not considered. You can also adjust which attributes to exclude from the analysis and rerun it.
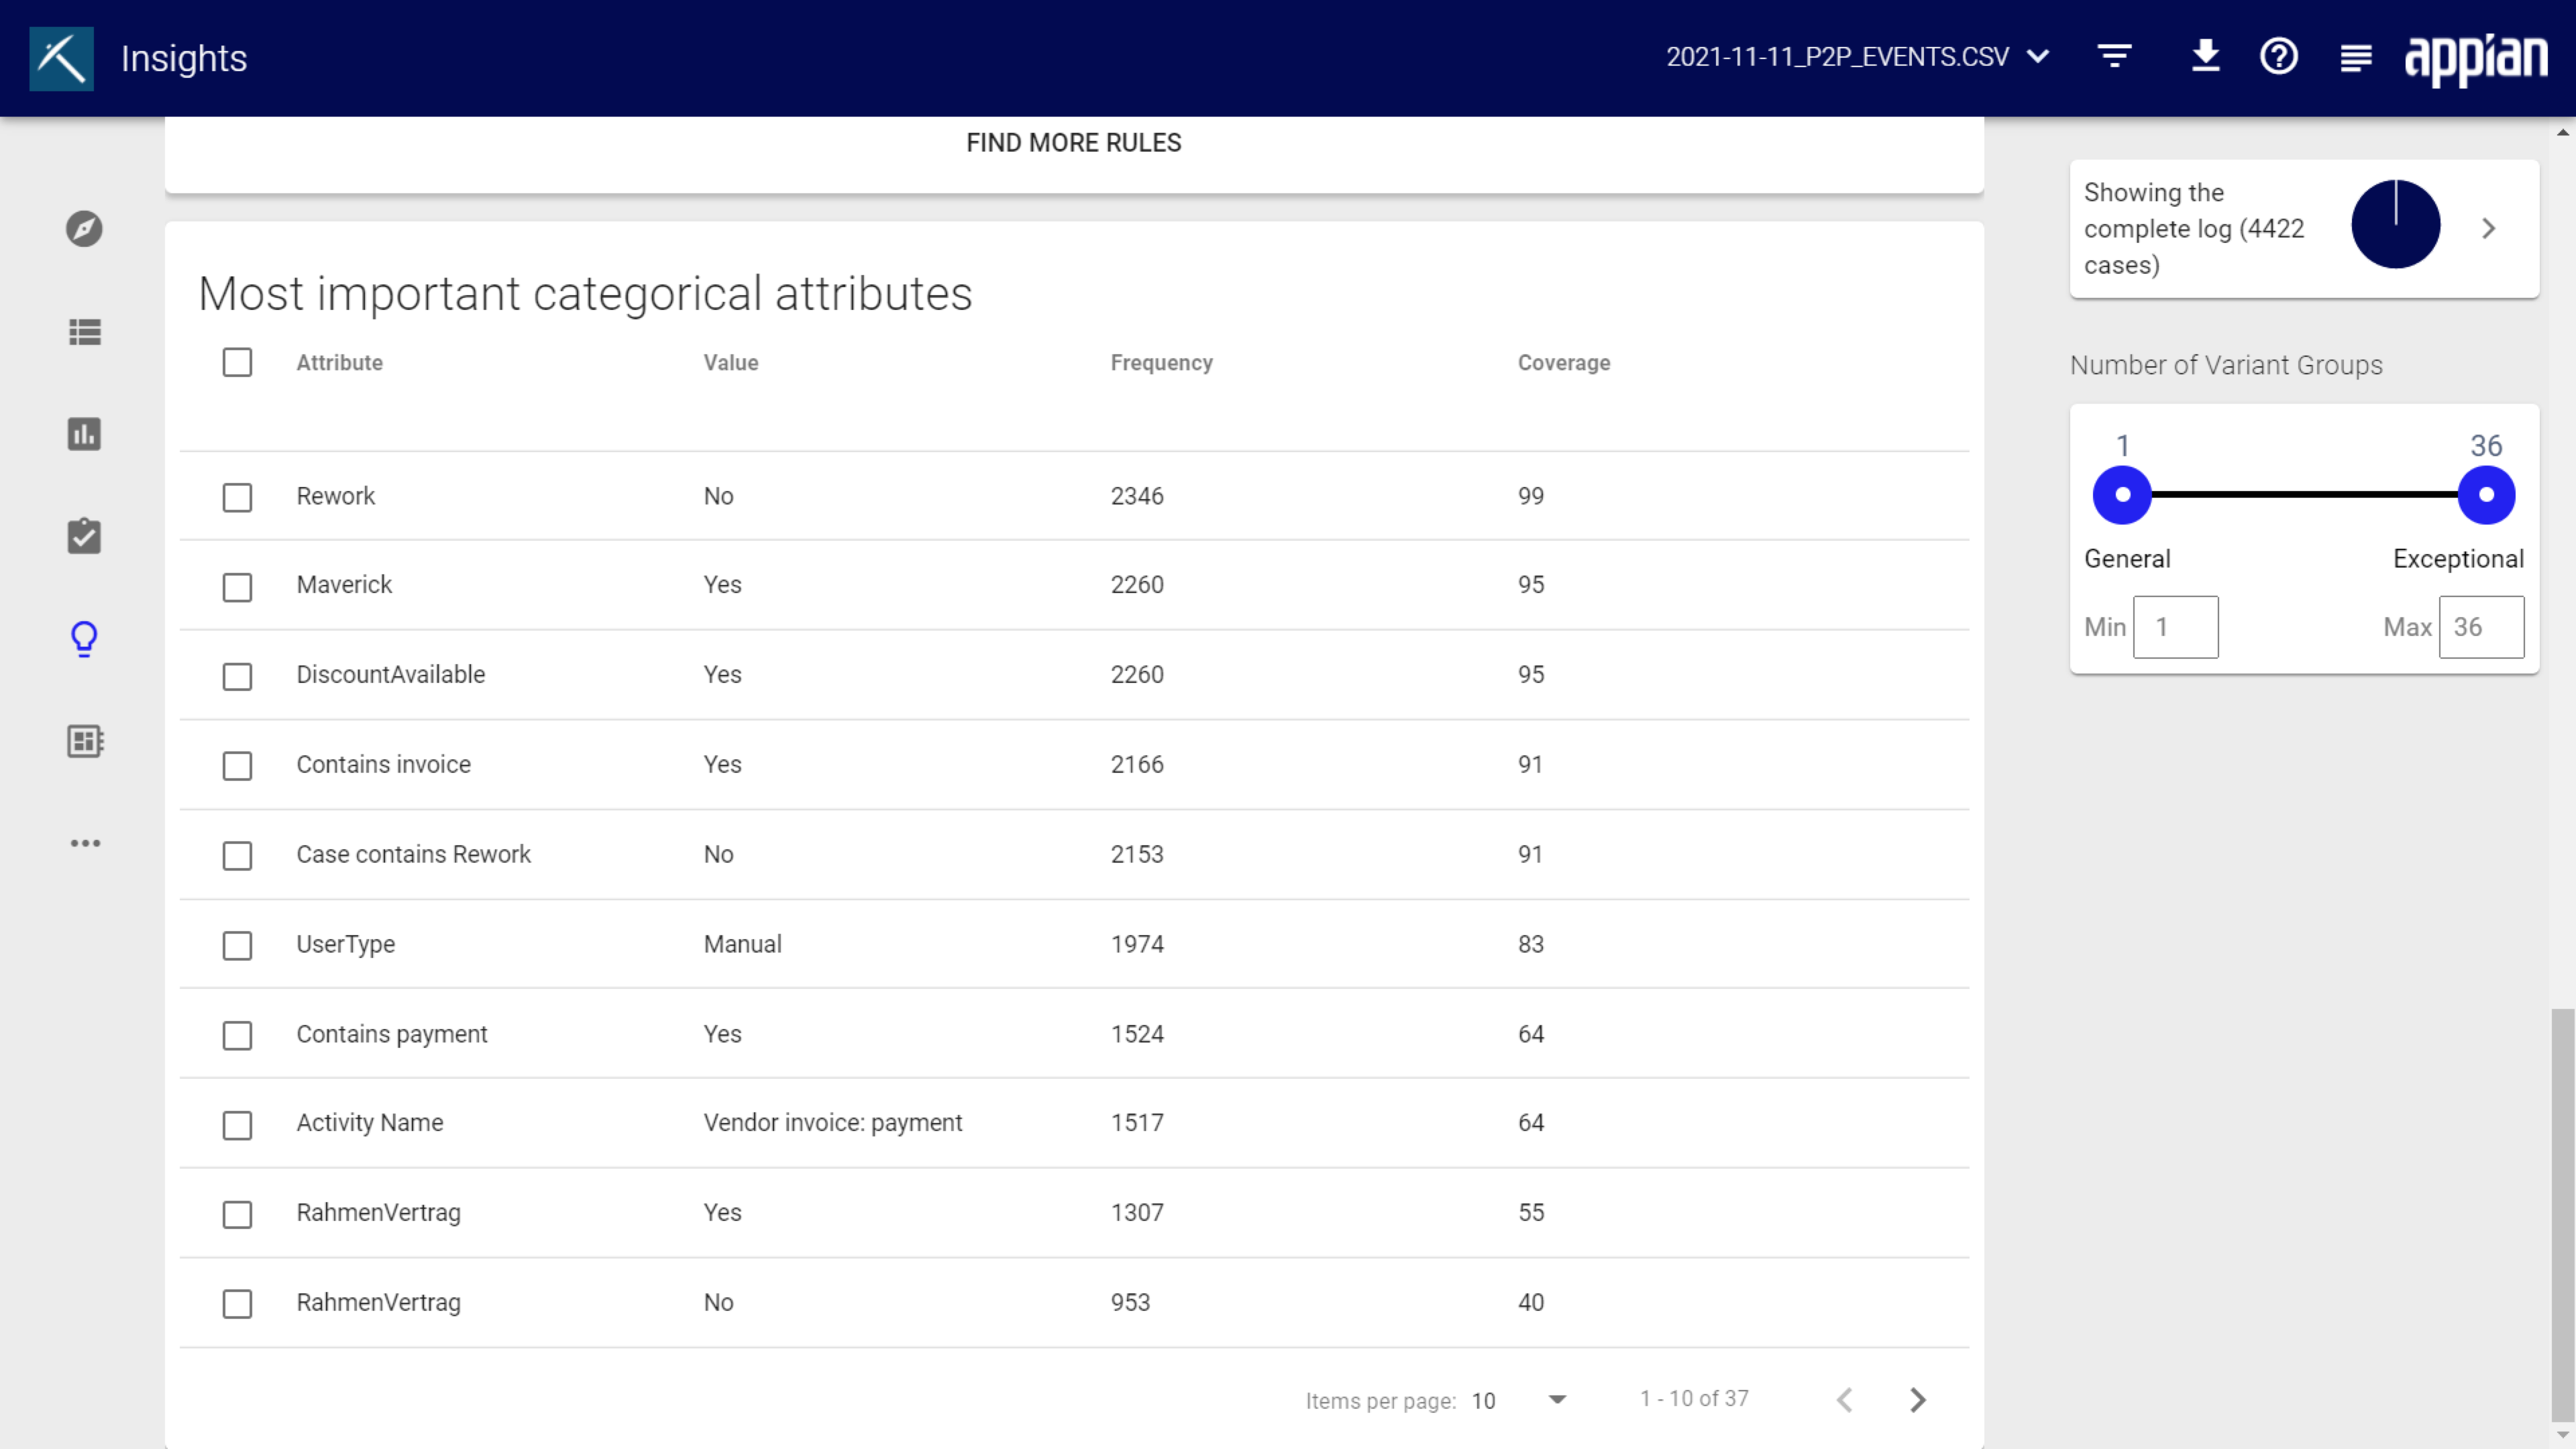
Most important categorical attributesCopy link to clipboard
This section displays the most commonly occurring attributes, their values, frequency, and coverage in the focus area. The coverage is the percentage of cases that have this attribute/value combination.
To set one of the listed attributes as filter, select the checkbox for an attribute and click Filter selected Attribute.
Distribution analysisCopy link to clipboard
Distribution analysis compares the distributions of selected activities or direct follower relations with regard to the selected attributes. Based on the selected data, the distributions for each combination of activity or direct follower relation and attribute value are calculated. Therefore, it is possible to identify if an activity or process sequence is significantly shifted for a certain attribute value.
With distribution analysis, you do not need to know the activity duration beforehand, unlike with root cause analysis. To perform distribution analysis, you need to select at least:
- One activity and one categorical attribute, or
- One follower relationship and one categorical attribute.
If your event log has start and end time stamps, you can select both activities and follower relationships; if not, you can select follower relationships to include in the analysis. In either instance, you also need to select at least one categorical attribute to include.
To start a distribution analysis:
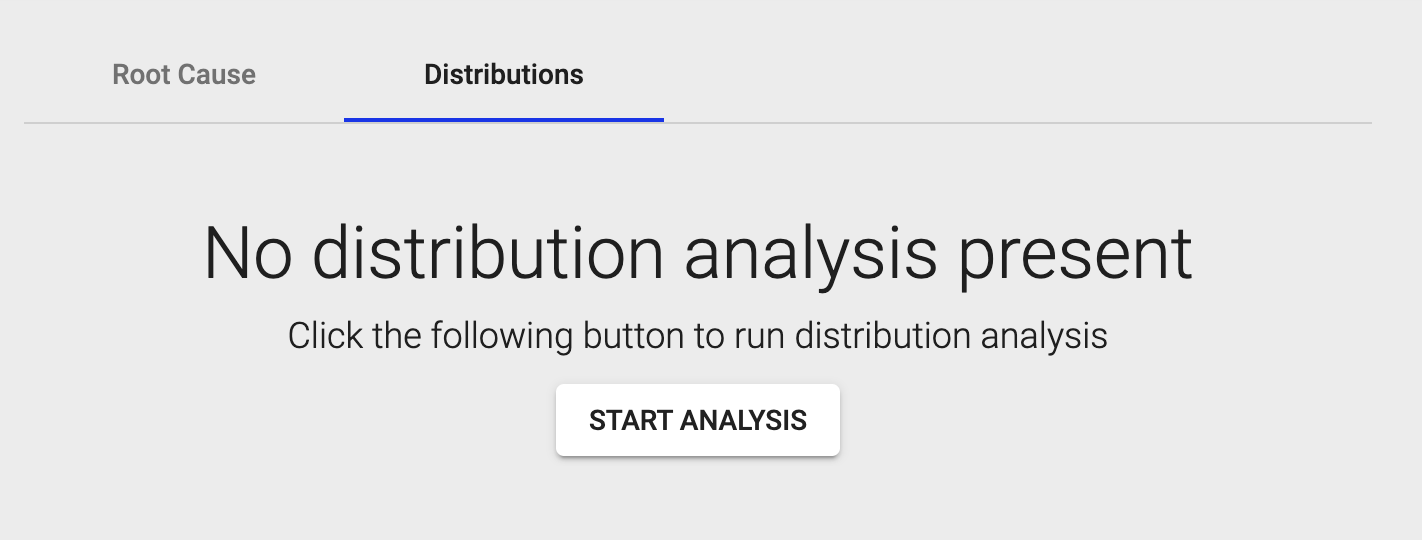
- On the Insights page, go to the Distributions tab.
- Click START ANALYSIS.
- Click the headings in the wizard to configure the necessary steps.
- Select Activities: Select specific activities to include activity durations in the analysis. Activities need start and end time stamps to display in this list.
- Select Follower Relation: Select follower relationships between two activities to include waiting times in the analysis.
- Select Categorical Attributes: Select attributes to consider categorical attributes in the analysis.
- Click RUN.
While Appian runs the distributions analysis, you can continue to use Process Mining. As soon as the analysis is finished, a message appears at the bottom of the screen, which allows you to jump directly back to the distribution analysis page.
Tip: Analysis may take longer if you select many activities, direct follower relations, and attributes for the analysis.
Results of the distribution analysisCopy link to clipboard
The analysis results appear in a table with the following information:
- Metric
- Attribute
- Value
- Median difference: Difference of the medians in both samples. Absolute values in tooltip.
- Difference in distribution:
- 1.0-0.8 is very high
- 0.8-0.6 is high
- 0.6-0.4 is medium
- 0.4-2.0 is low
- 0.2-0.0 is very low
- Width ratio: The quotient of the interquartile ranges of both samples.
To see the distribution analysis results visually, click Plot.
At the top of the Analysis results, you can:
- Click Edit settings on the top right to adjust the current analysis settings.
- Click Start new analysis to create a new analysis.
