| Process Mining is deprecated with Appian 24.2 and will no longer be available in an upcoming release. Instead, we encourage customers to use Process HQ to explore and analyze business processes and data. |
This page discusses what a filter is, the types of filters available in Process Mining, and when and how to use filters during analysis.
What is a filter?Copy link to clipboard
Processes come in all shapes and sizes, as do the event logs that describes how they're operating. This can be a lot of data to work with or try to understand. To help narrow your focus, you can apply filters in Process Mining. A filter restricts the information that's visible on the screen based on your selections. For example, if you wish to see information on activities completed in the last week, this is a filter.
When to use filtersCopy link to clipboard
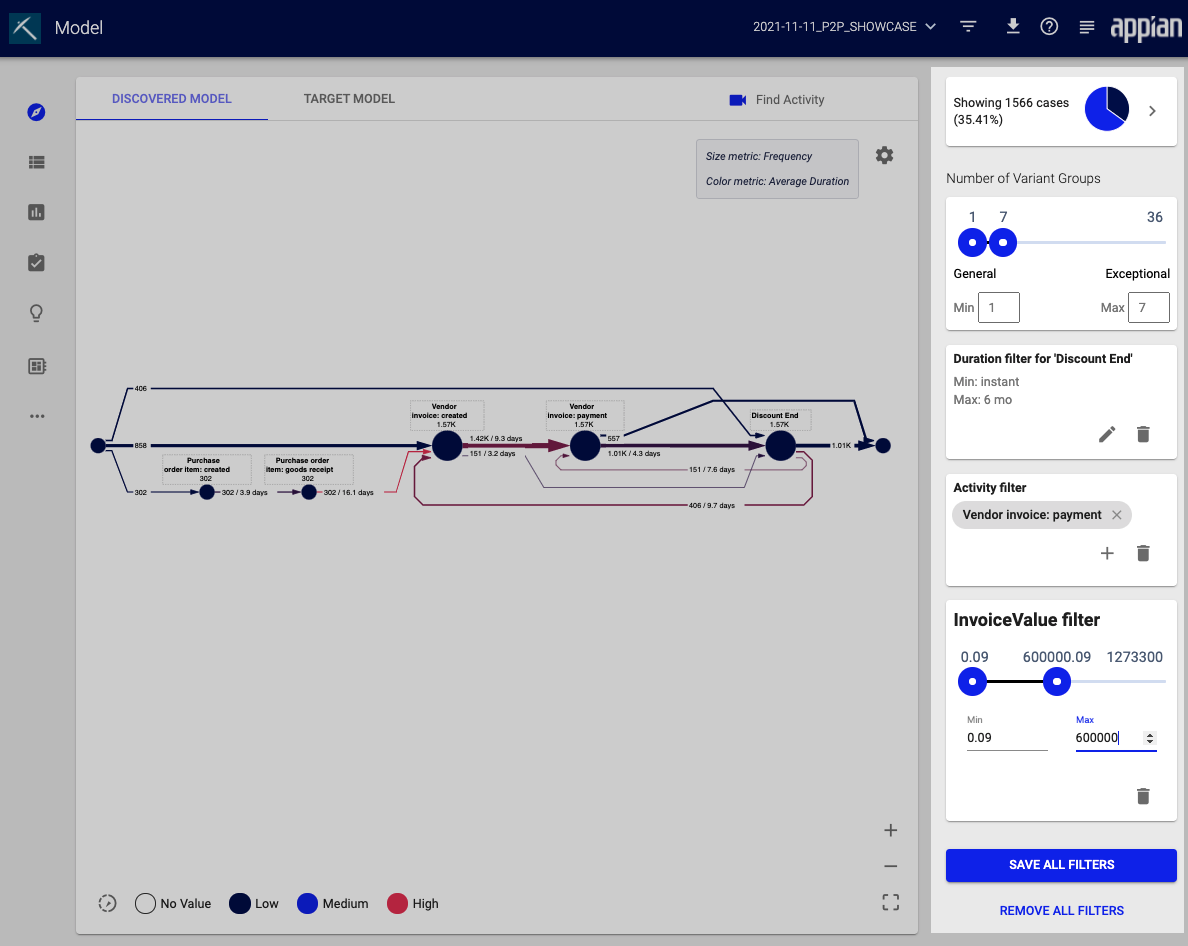
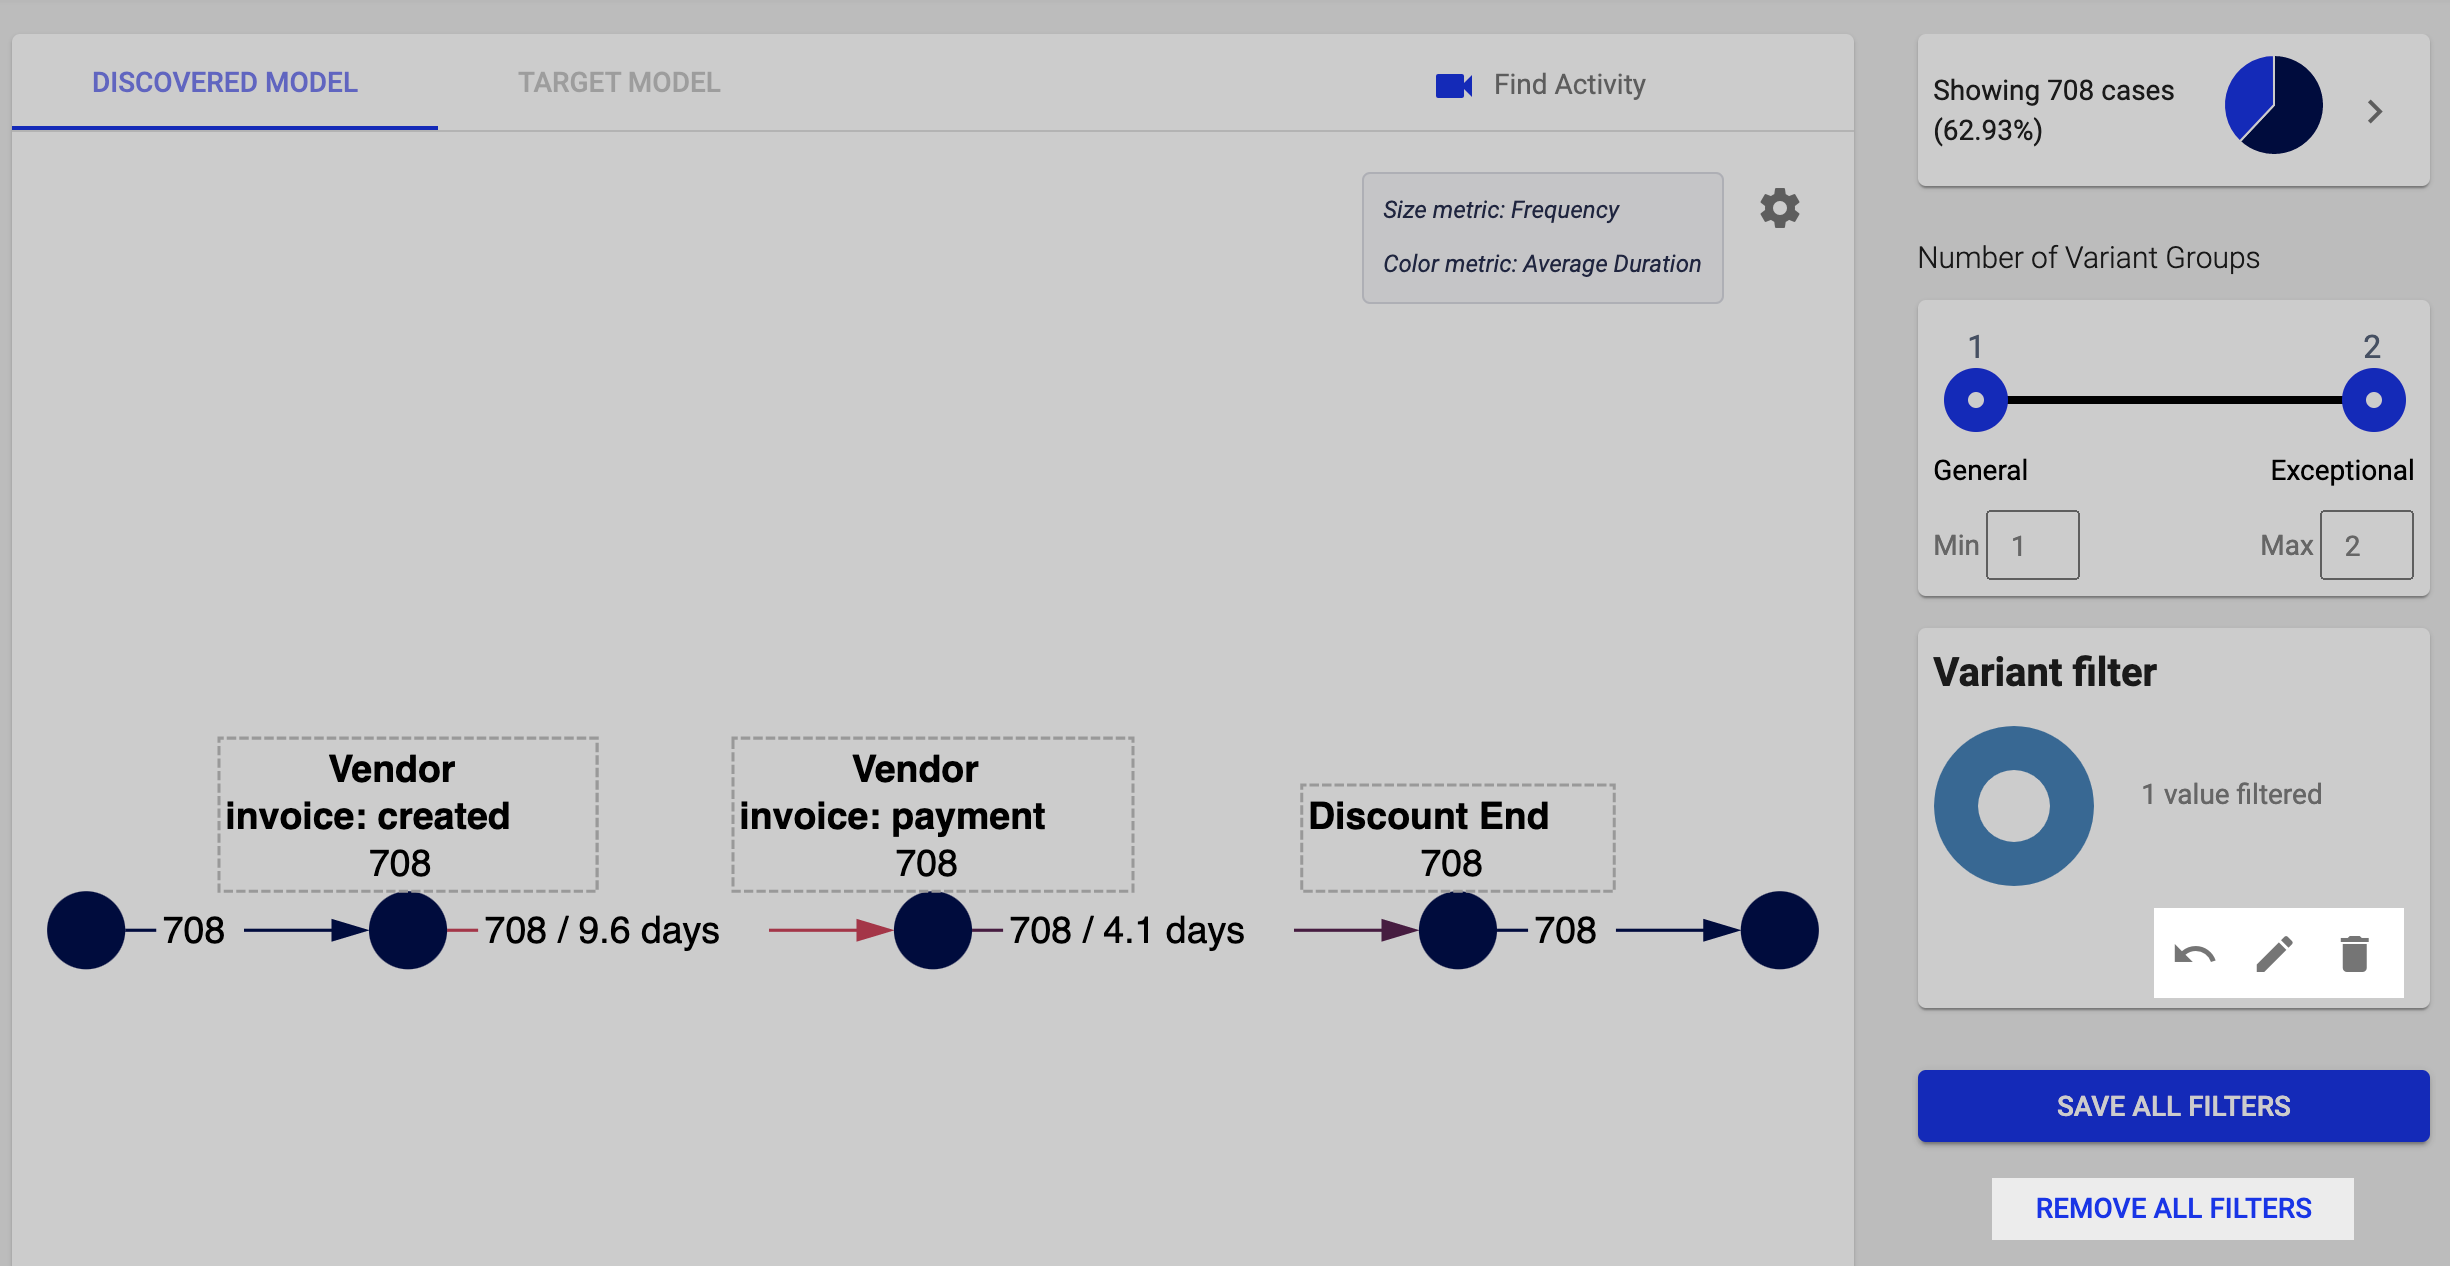
You can use filters to drill down analyses in process mining. For example, it is possible to filter according to certain durations, time spans, or variants to examine these more precisely. When you apply a filter, they affect all displays, statistics, tables, models, diagrams and root cause analyses. Once filters have been applied, the pie chart changes, indicating the percentage of all cases currently visualized and analyzed.
You can apply multiple filters at once, as well as save filter settings for future use.
Where to find filtersCopy link to clipboard
The Filter Menu is available in the toolbar at the top of the Process Mining window. You can apply filters any time.
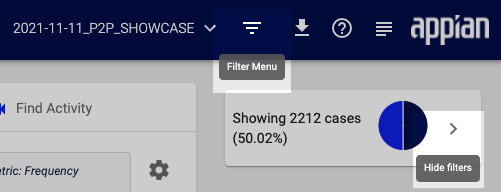
You can hide the filter pane. Click Hide filters to collapse the filter pane. To open the filter pane, click the icon again.
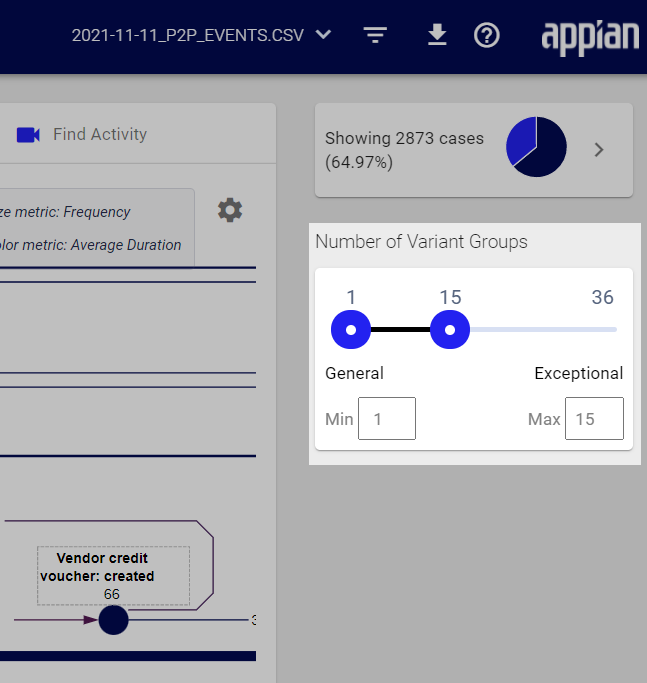
The Number of Variant Groups filter will always appear here by default.
Create a filterCopy link to clipboard
To create a filter:
-
In the toolbar, click the funnel icon next to the name of the selected log.
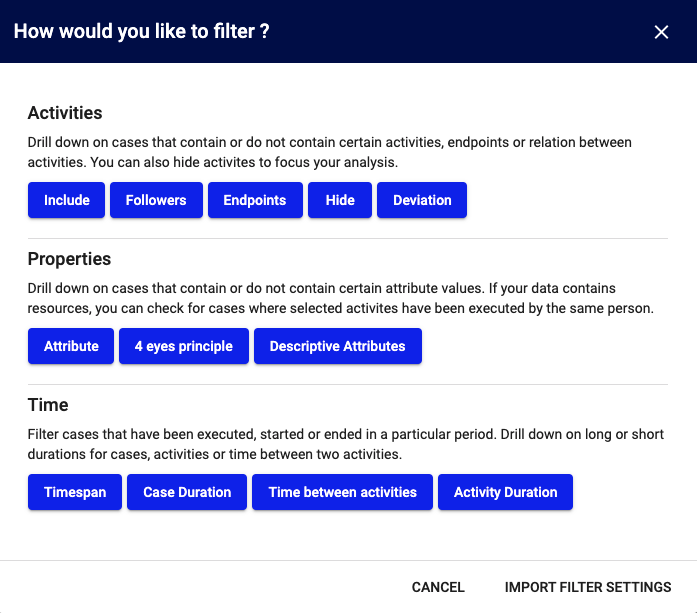
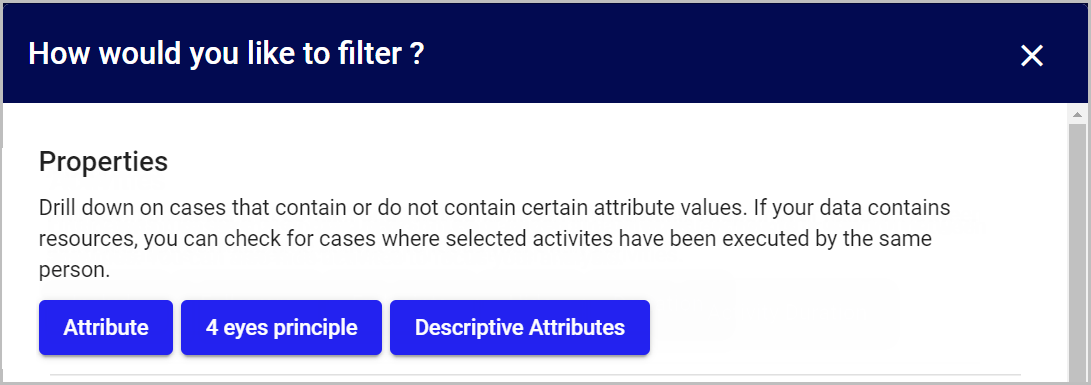
- In the How would you like to filter? window, you'll see all available filters grouped according to their fields of application: Activities, Properties, and Time. Each group contains a short explanation of the respective filters, as well as buttons to select the filters themselves.
- Click a filter type to see the configuration options for that filter. The full list of options is available below.
After you save a filter, it appears in the filter bar on the right side of the screen.
Edit or remove filtersCopy link to clipboard
Each filter appears as a card in the filter pane. In each card, you can:
- Use the pencil icon to edit the filter
- Use the trash icon to delete the filter
- Use the back arrow icon to reset a filter if you've edited it
To delete all filters at once, click REMOVE ALL FILTERS at the bottom of the filter pane.
Types of filtersCopy link to clipboard
Process Mining includes default filters that you can use to show information you're interested in.
Activities filtersCopy link to clipboard
Activities filters narrow your view to show cases that contain or do not contain certain activities, endpoints, or relation between activities.
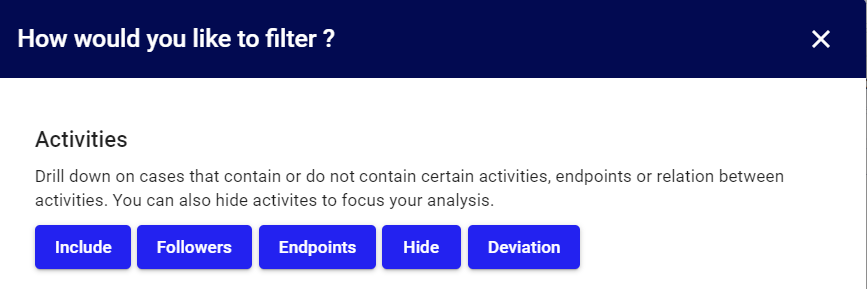
The Include filter lets you select activities that must (or must not) appear in the process flow. A distinction is made between visible and invisible activities. The activities are displayed in two adjacent tables. Use the search and page options to browse the lists.
The Followers filter lets you select process variants that contain or do not contain certain activity sequences. To create this filter:
- Select the From: and To: activities in the filter window. The first activity you select specifies the starting point, and the second activity specifies the end point.
- Use the radio buttons to select how to display the relationship between the two specific activities:
- Activities have to eventually follow each other (i.e. there may be activities between them)
- Activities have to directly follow each other (i.e. no activities are between them)
- Activities must never eventually follow each other (i.e. they must never follow each other, no matter how many activities are between them)
- Activities must never directly follow each other (i.e. they must follow each other, but not occur directly after each other in the process)
- Click FILTER to apply the configured filter.
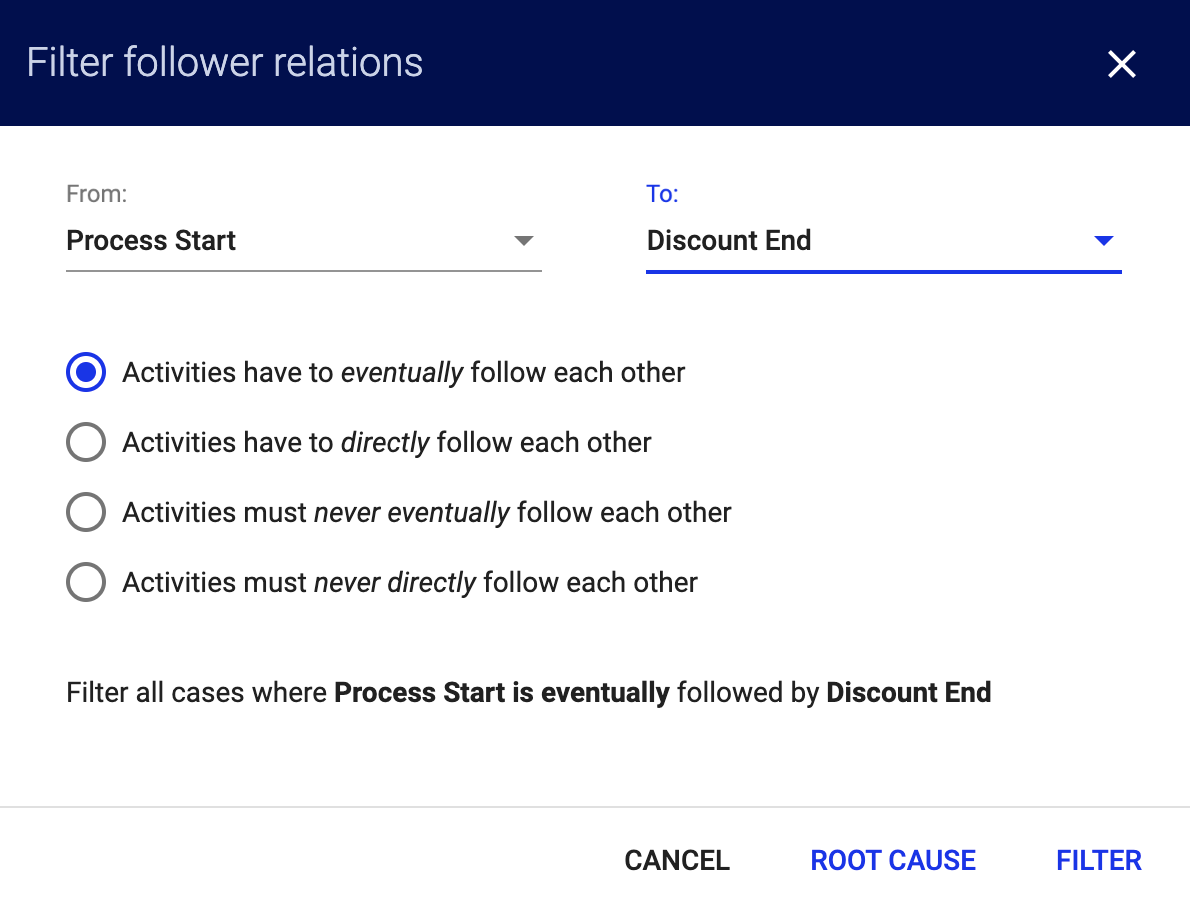
You can use the follower filter to also determine the time between two activities. Choose whether the path duration should lie within a certain range. To do this, a minimum or maximum duration can be required or allowed. Click Filter to apply your selections.
The Endpoints filter lets you select one or more activities from the visible and invisible activities. In this way, you can filter by variants and activity paths that end (or don't end) with a specific activity.
- In the activities table, select the activities to use in this filter.
- In the Filter all cases that section, use the radio buttons to choose whether cases should end with this activity, or whether they never end with the selected activity.
- Click SAVE to apply the configured filter.
In the filter, use the cross icon on the activity name to remove this activity as an endpoint.
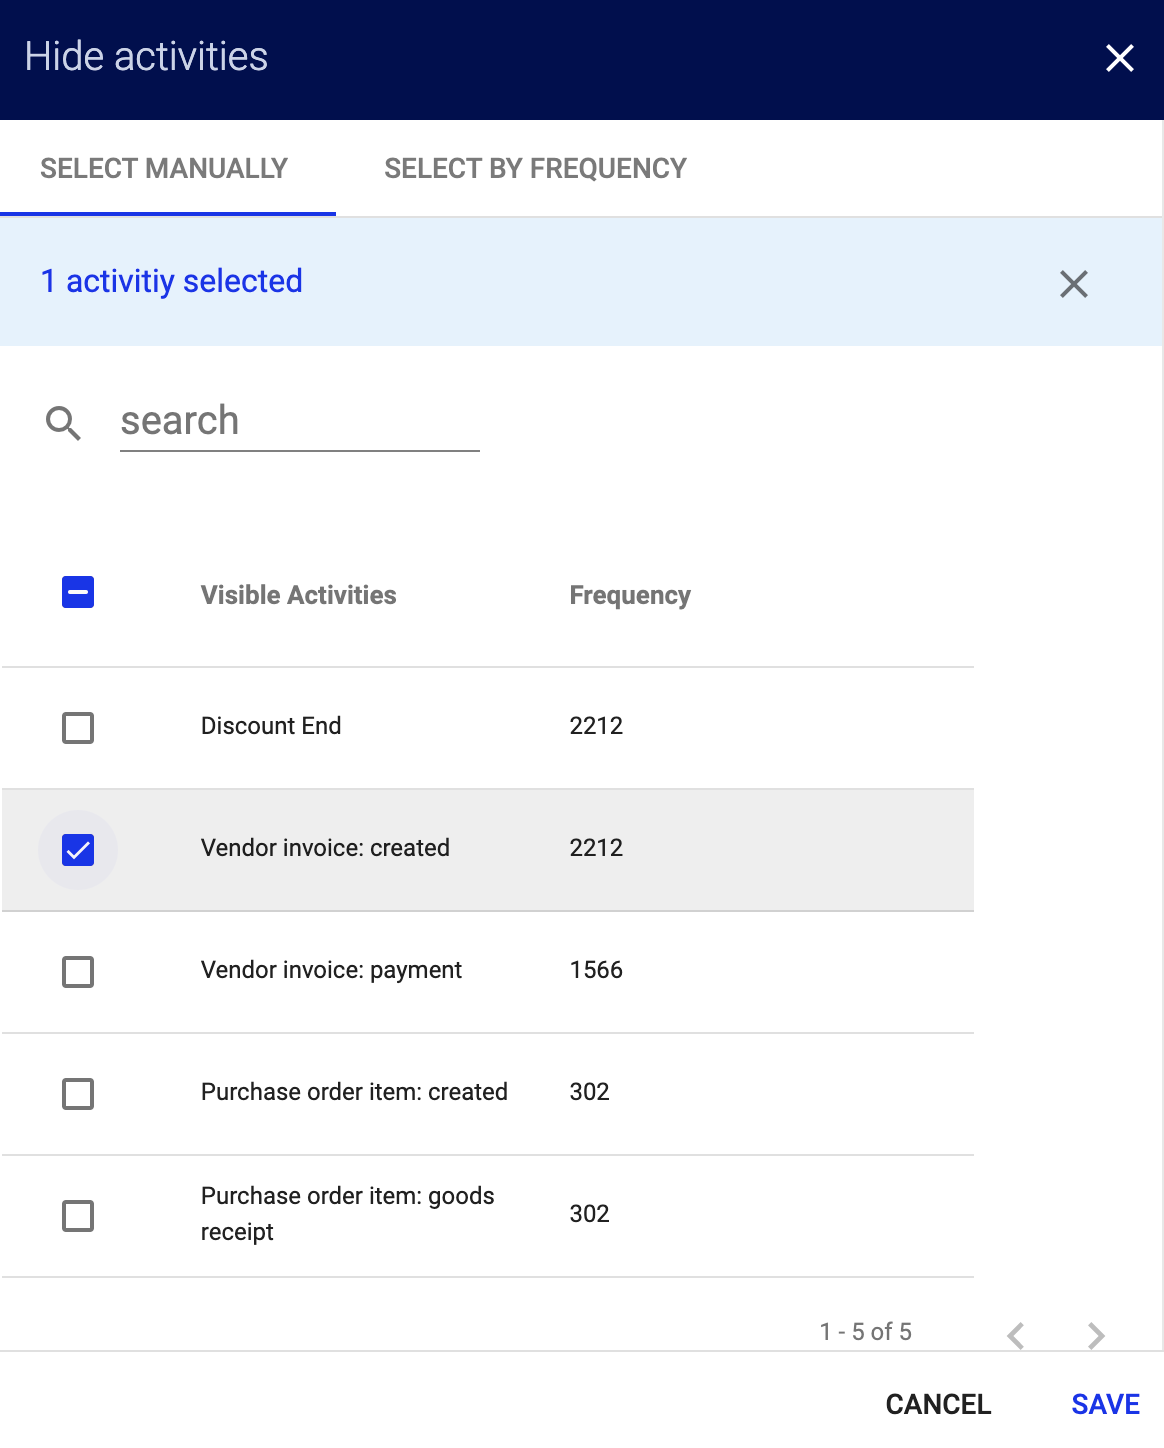
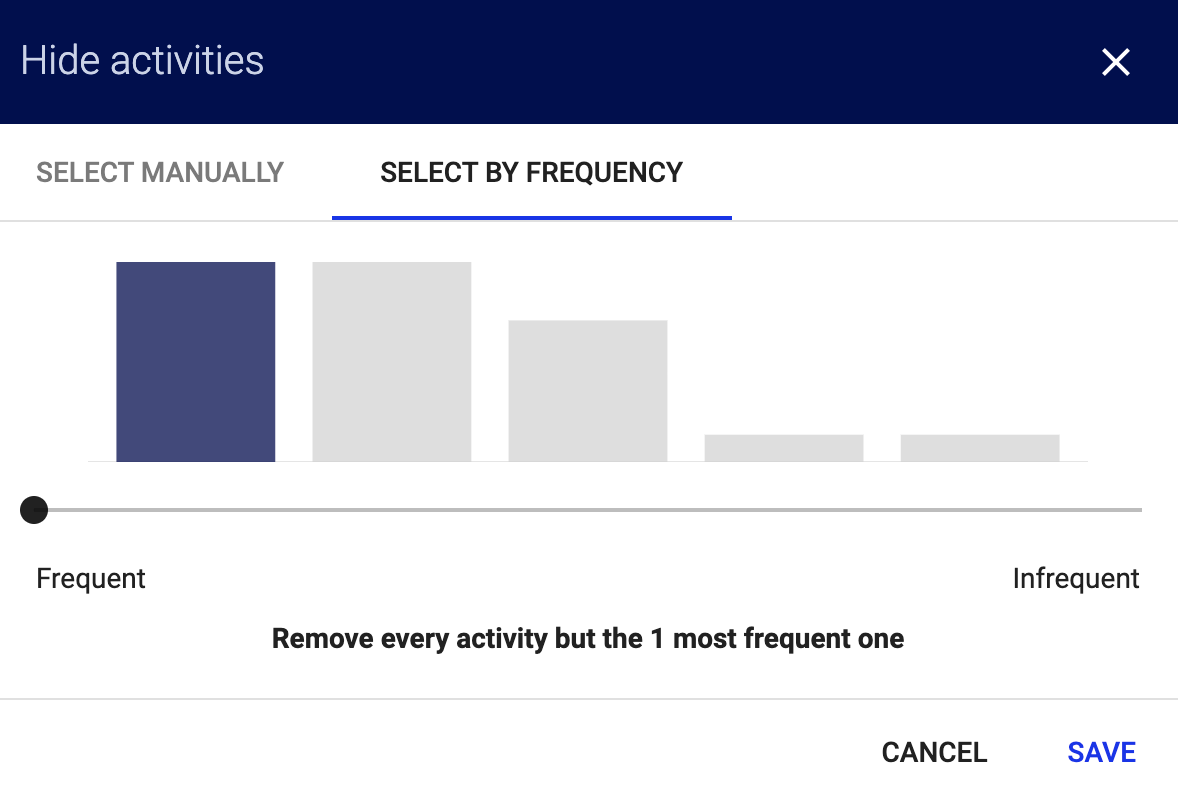
The Hide filter lets you hide or temporarily remove certain activities from the model and the analysis. This filter contains two tabs: SELECT MANUALLY and SELECT BY FREQUENCY.
On the SELECT MANUALLY tab:
- Select the checkbox to choose the activities.
- Use the radio buttons below the tables to decide whether to display or hide the selected activities.
- Click SAVE to apply the configured filter.
You can also select activities based on their frequency on the SELECT BY FREQUENCY tab:
- Hover on one of the bars to see the activity name and the frequency of the activity.
- Use the slider below the chart to set the frequency boundaries and determine which activities to keep. The chart ranges from frequent and infrequent. The number above the point shows you how many activities have been selected. Below the bar you can also see how many of the most common activities are retained after filtering.
- Click SAVE to apply the configured filter.
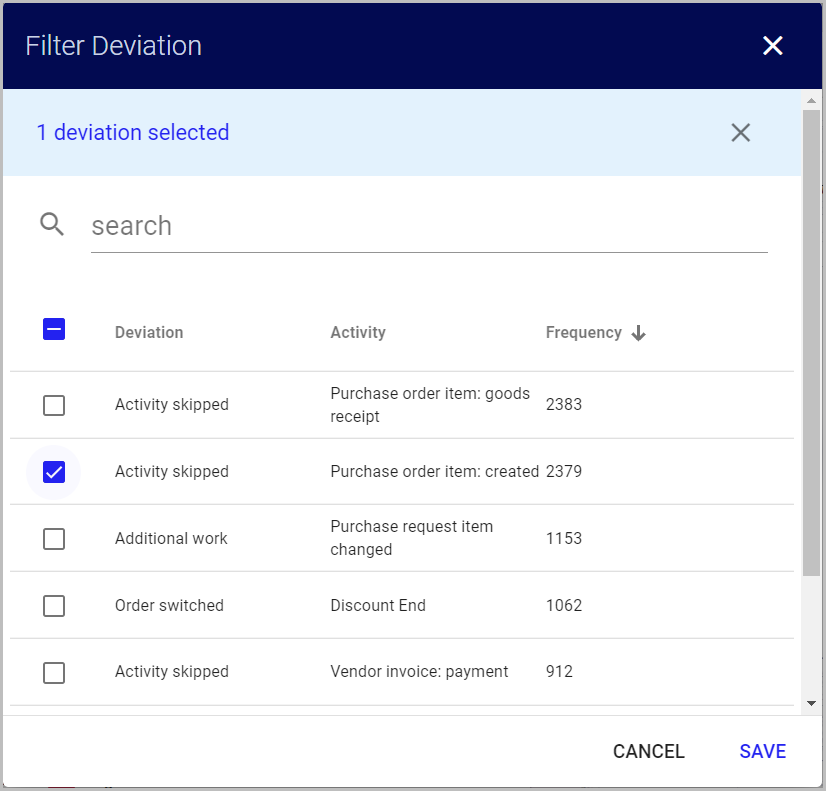
The Deviation filter lets you drill down on cases that contain or do not contain certain deviations.
Properties filtersCopy link to clipboard
Properties filters drill down on cases that contain or do not contain certain attribute values.
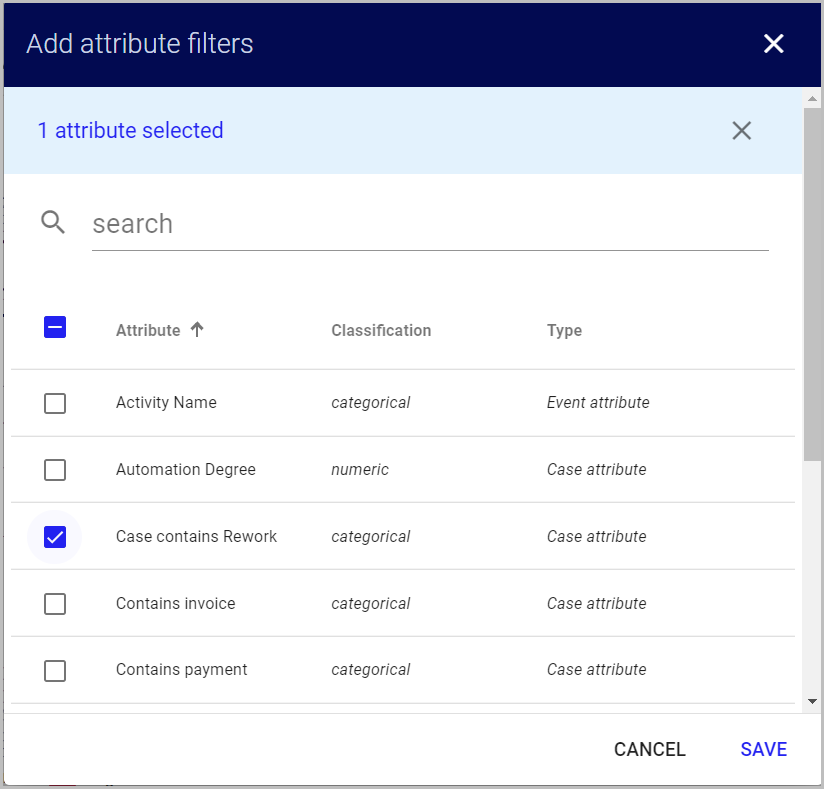
The Attribute filter shows you all available attributes. Next to each attribute name, you'll see the attribute classification (numerical, categorical) and attribute type (event and case attribute).
To create an attribute filter:
- Select an attribute using the checkbox.
- Click SAVE to apply the configured filter.
For each selected attribute, a separate filter is displayed in the filter bar. Categorical attribute values appear in a donut diagram, which displays the distribution of the attributes over the cases. The diagram won't appear if there are more than 10 different values for the attribute. Numeric attribute values appear in a range slider, where you can adjust the minimum and maximum values.
Hover over an area of the diagram to see the value, how many cases have this value, and the percentage of all cases that have this value. Click on a range to set as a filter and see only cases or events that have this attribute.
The 4 eyes principle filter is based on the follower filter. Select the activities in the filter pop-up. The first activity you select specifies the starting point, and the second activity specifies the end point.
Use the radio buttons to select how to display the relationship between the two specific activities:
- Activities have to eventually follow each other (i.e. there may be activities between them)
- Activities have to directly follow each other (i.e. no activities are between them)
- Activities must never eventually follow each other (i.e. they must never follow each other, no matter how many activities are between them)
- Activities must never directly follow each other (i.e. they must follow each other, but not occur directly after each other in the process)
In order to check whether the principle of dual control has been observed, the test steps should be set as start and end activities. The radio buttons can therefore be used to filter out the process variants that have passed both or none of the test steps.
Click FILTER to apply the configured filter.
The Descriptive Attributes filter lets you filter on cases that contain or do not contain certain attribute values. If your data contains resources, you can check for cases where selected activities have been executed by the same person.
Time filtersCopy link to clipboard
Time filters narrow your view of activities or cases that have been executed, started or ended in a particular period. All time filters include default minimum and maximum time stamps, based on the log you have currently selected.
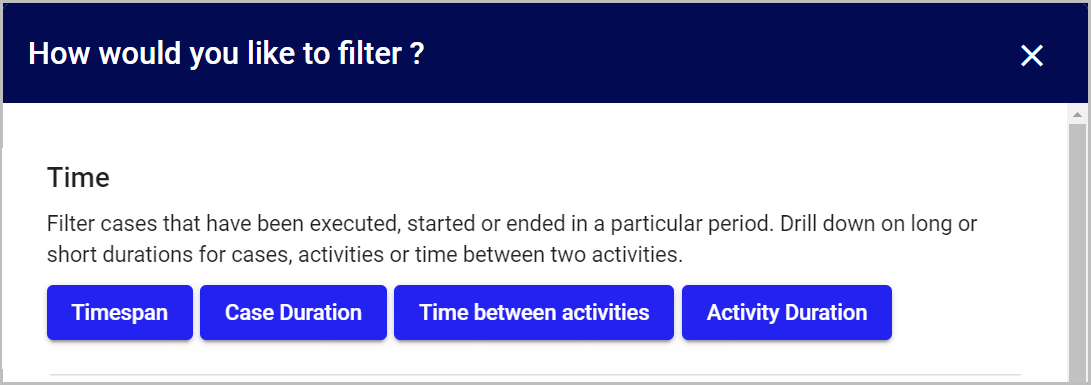
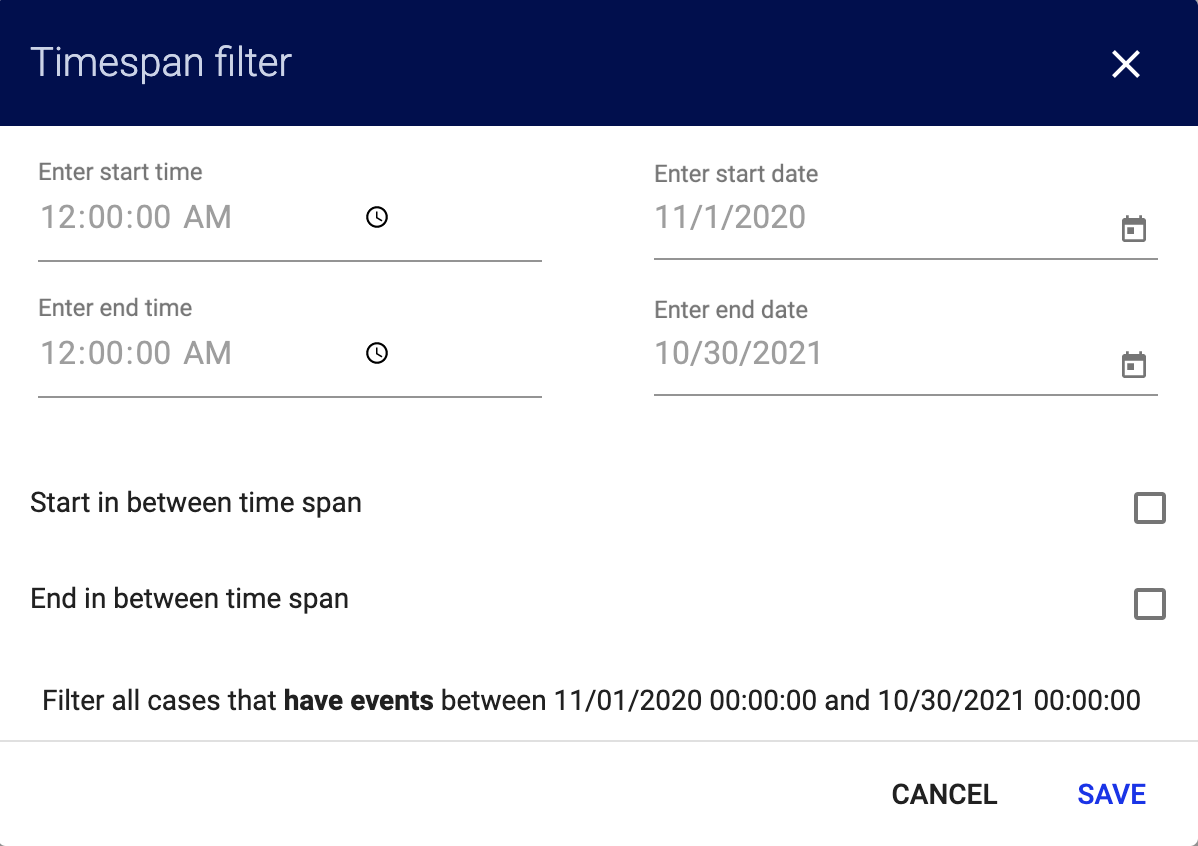
The Timespan filter lets you view cases occurring during a certain period of time.
To use the filter:
- Enter a time and date for both the start and end of the time period.
- Select whether the start or the end lies within the time span.
- Click SAVE to apply the configured filter.
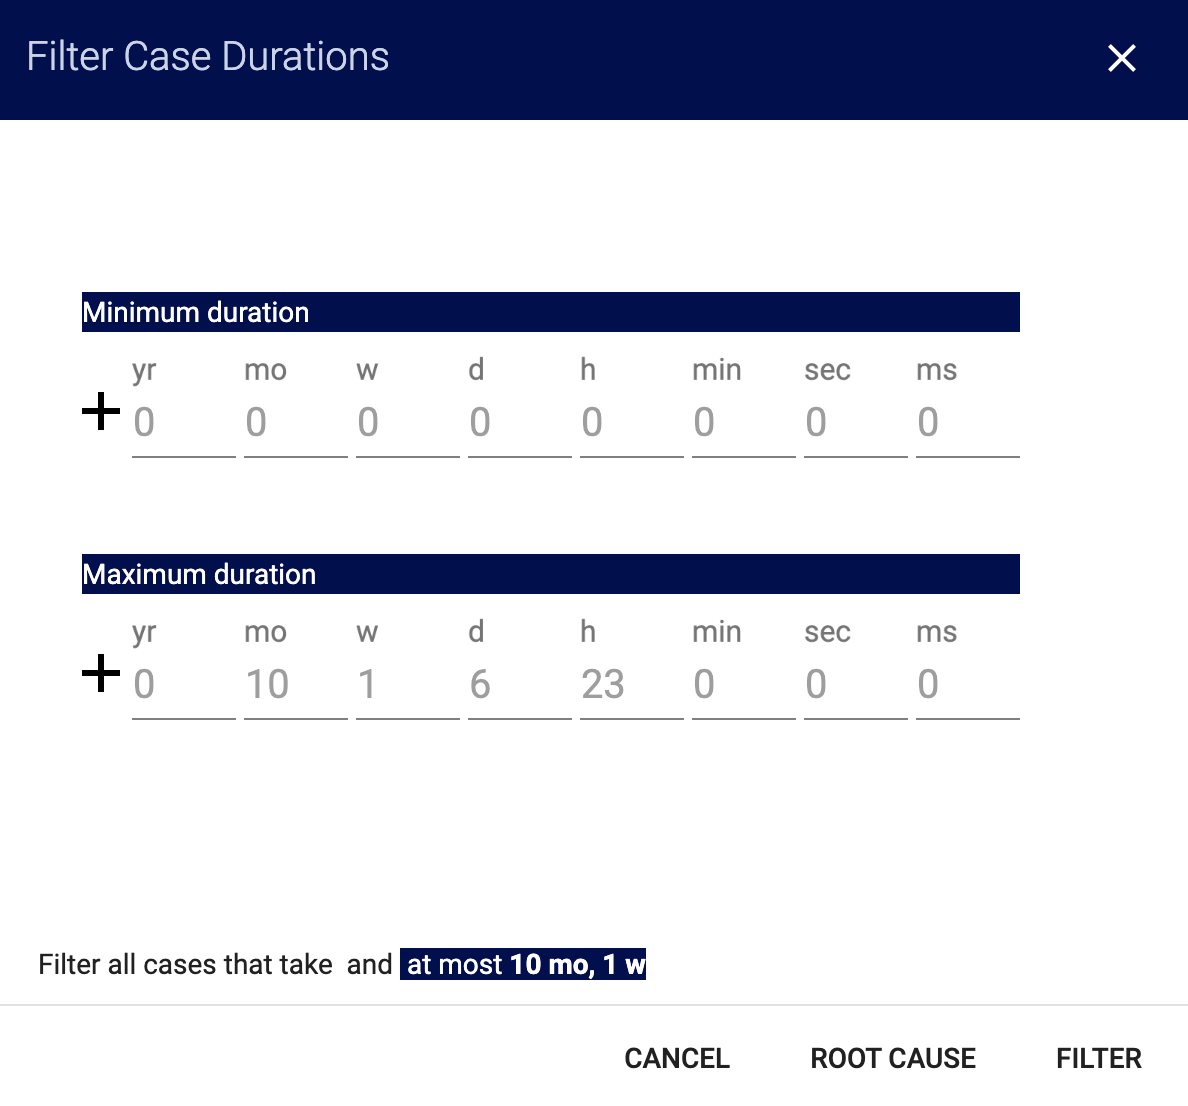
The Case Duration filter lets you focus the analysis on cases whose processing time or case duration is within a defined frame.
To use the filter:
- Determine a minimum and a maximum case duration. The setting options include:
- Years
- Months
- Weeks
- Days
- Hours
- Minutes
- Seconds
- Milliseconds
- Click FILTER to apply the configured filter.
The Time between activities filter lets you drill down on time between two activities.
Use the radio buttons to select how to display the relationship between the two specific activities:
- Activities have to eventually follow each other (i.e. there may be activities between them)
- Activities have to directly follow each other (i.e. no activities are between them)
- Activities must never eventually follow each other (i.e. they must never follow each other, no matter how many activities are between them)
- Activities must never directly follow each other (i.e. they must follow each other, but not occur directly after each other in the process)
The Activity Duration filter lets you focus the analysis on activities whose duration is within a defined frame.
Variant filterCopy link to clipboard
The Number of Variant Groups filter lets you set which variant groups to analyze. The variant filter always appears in the model views of Process Mining.
The variant filter has a range from 1 to n, where n is the number of identified variant groups. This range appears above the variant slider. Use the two ends of the slider to choose the range of variant groups to display. As the number of variant groups grows, the frequency of cases described by the variants of a group decreases.
Note: Variant groups don't necessarily equate to variants in most cases. Variant groups collect variants according to their frequency. This means that all variants with the same frequency are grouped together. Variant group 1 always represents the most frequent variant(s) and variant group n represents all variants with the least (most likely only one occurrence).
Manage filtersCopy link to clipboard
After you create filters, you can use them on other logs or share them with your organization. You can also export the filters for use in other organizations or environments.
Use the pencil icon to edit the filter, and use the trash icon to delete the filter.
Save filtersCopy link to clipboard
You can use filters on another log in your organization.
- Go to the filter pane.
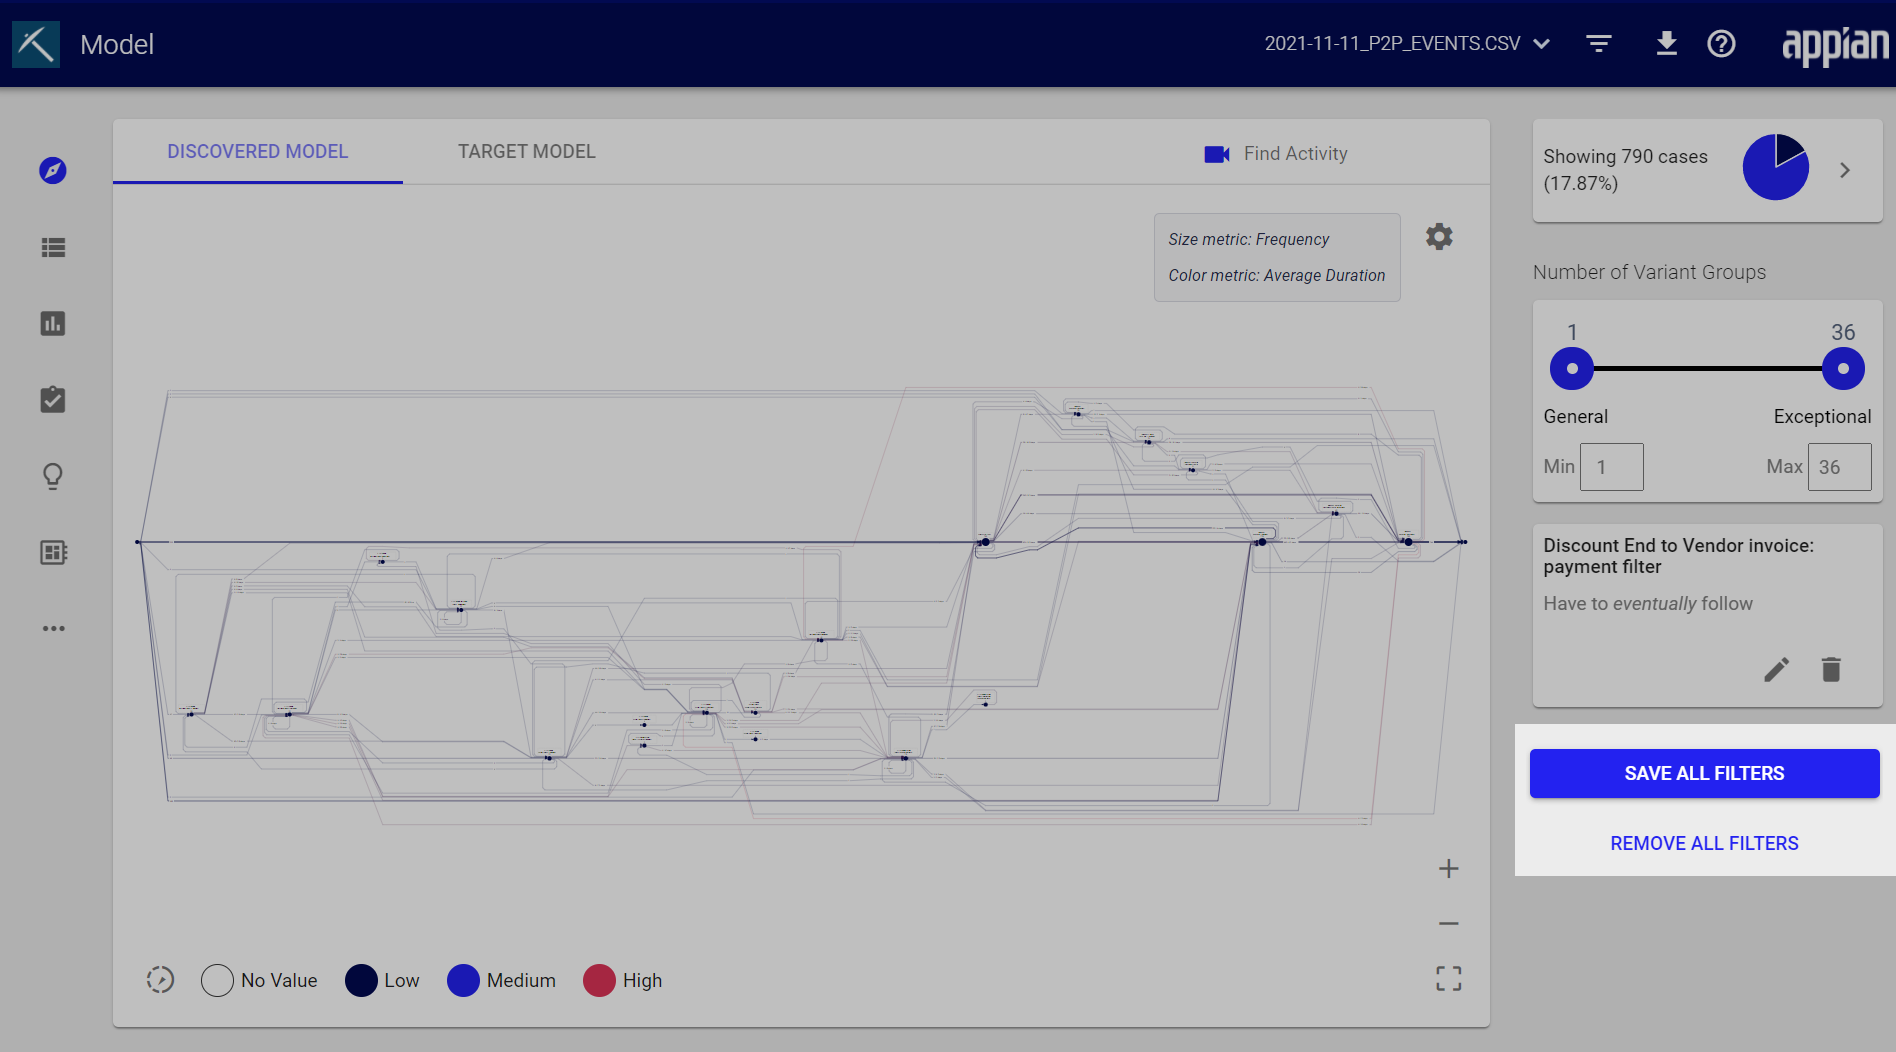
- Below the last filter, click SAVE ALL FILTERS.
- Enter a name for the filter.
- Click SAVE.
Your filter settings are saved to use at a later time. Find your saved filters on the Filter Management page.
To delete all active filter settings, click REMOVE ALL FILTERS in the filter pane.
Export filter settingsCopy link to clipboard
If you want to use filters in another organization or environment, you can export the filters.
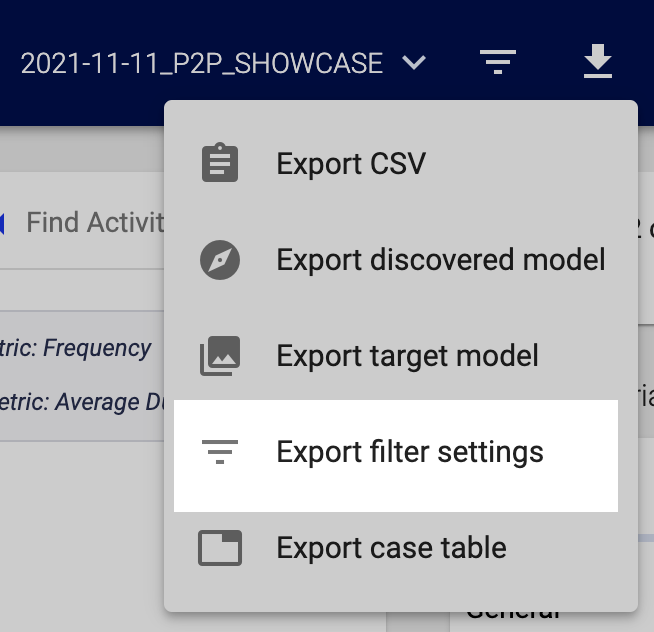
- Click the download icon in the toolbar.
- Click Export filter settings.
- Select how the settings should be exported: download a .JSON file or via API.
- If you select API, a new window opens with the header and the body for the corresponding request. Copy the header and body to use outside of Process Mining.
Import filter settingsCopy link to clipboard
To import filter settings:
- Click the funnel icon to open the filter menu in the toolbar.
- Click IMPORT FILTER SETTINGS.
- Browse for and select the .JSON file with filter settings.
Share filtersCopy link to clipboard
You can share filters with the entire organization or with individual users.
To share a filter:
- Open Filter Management in the menu.
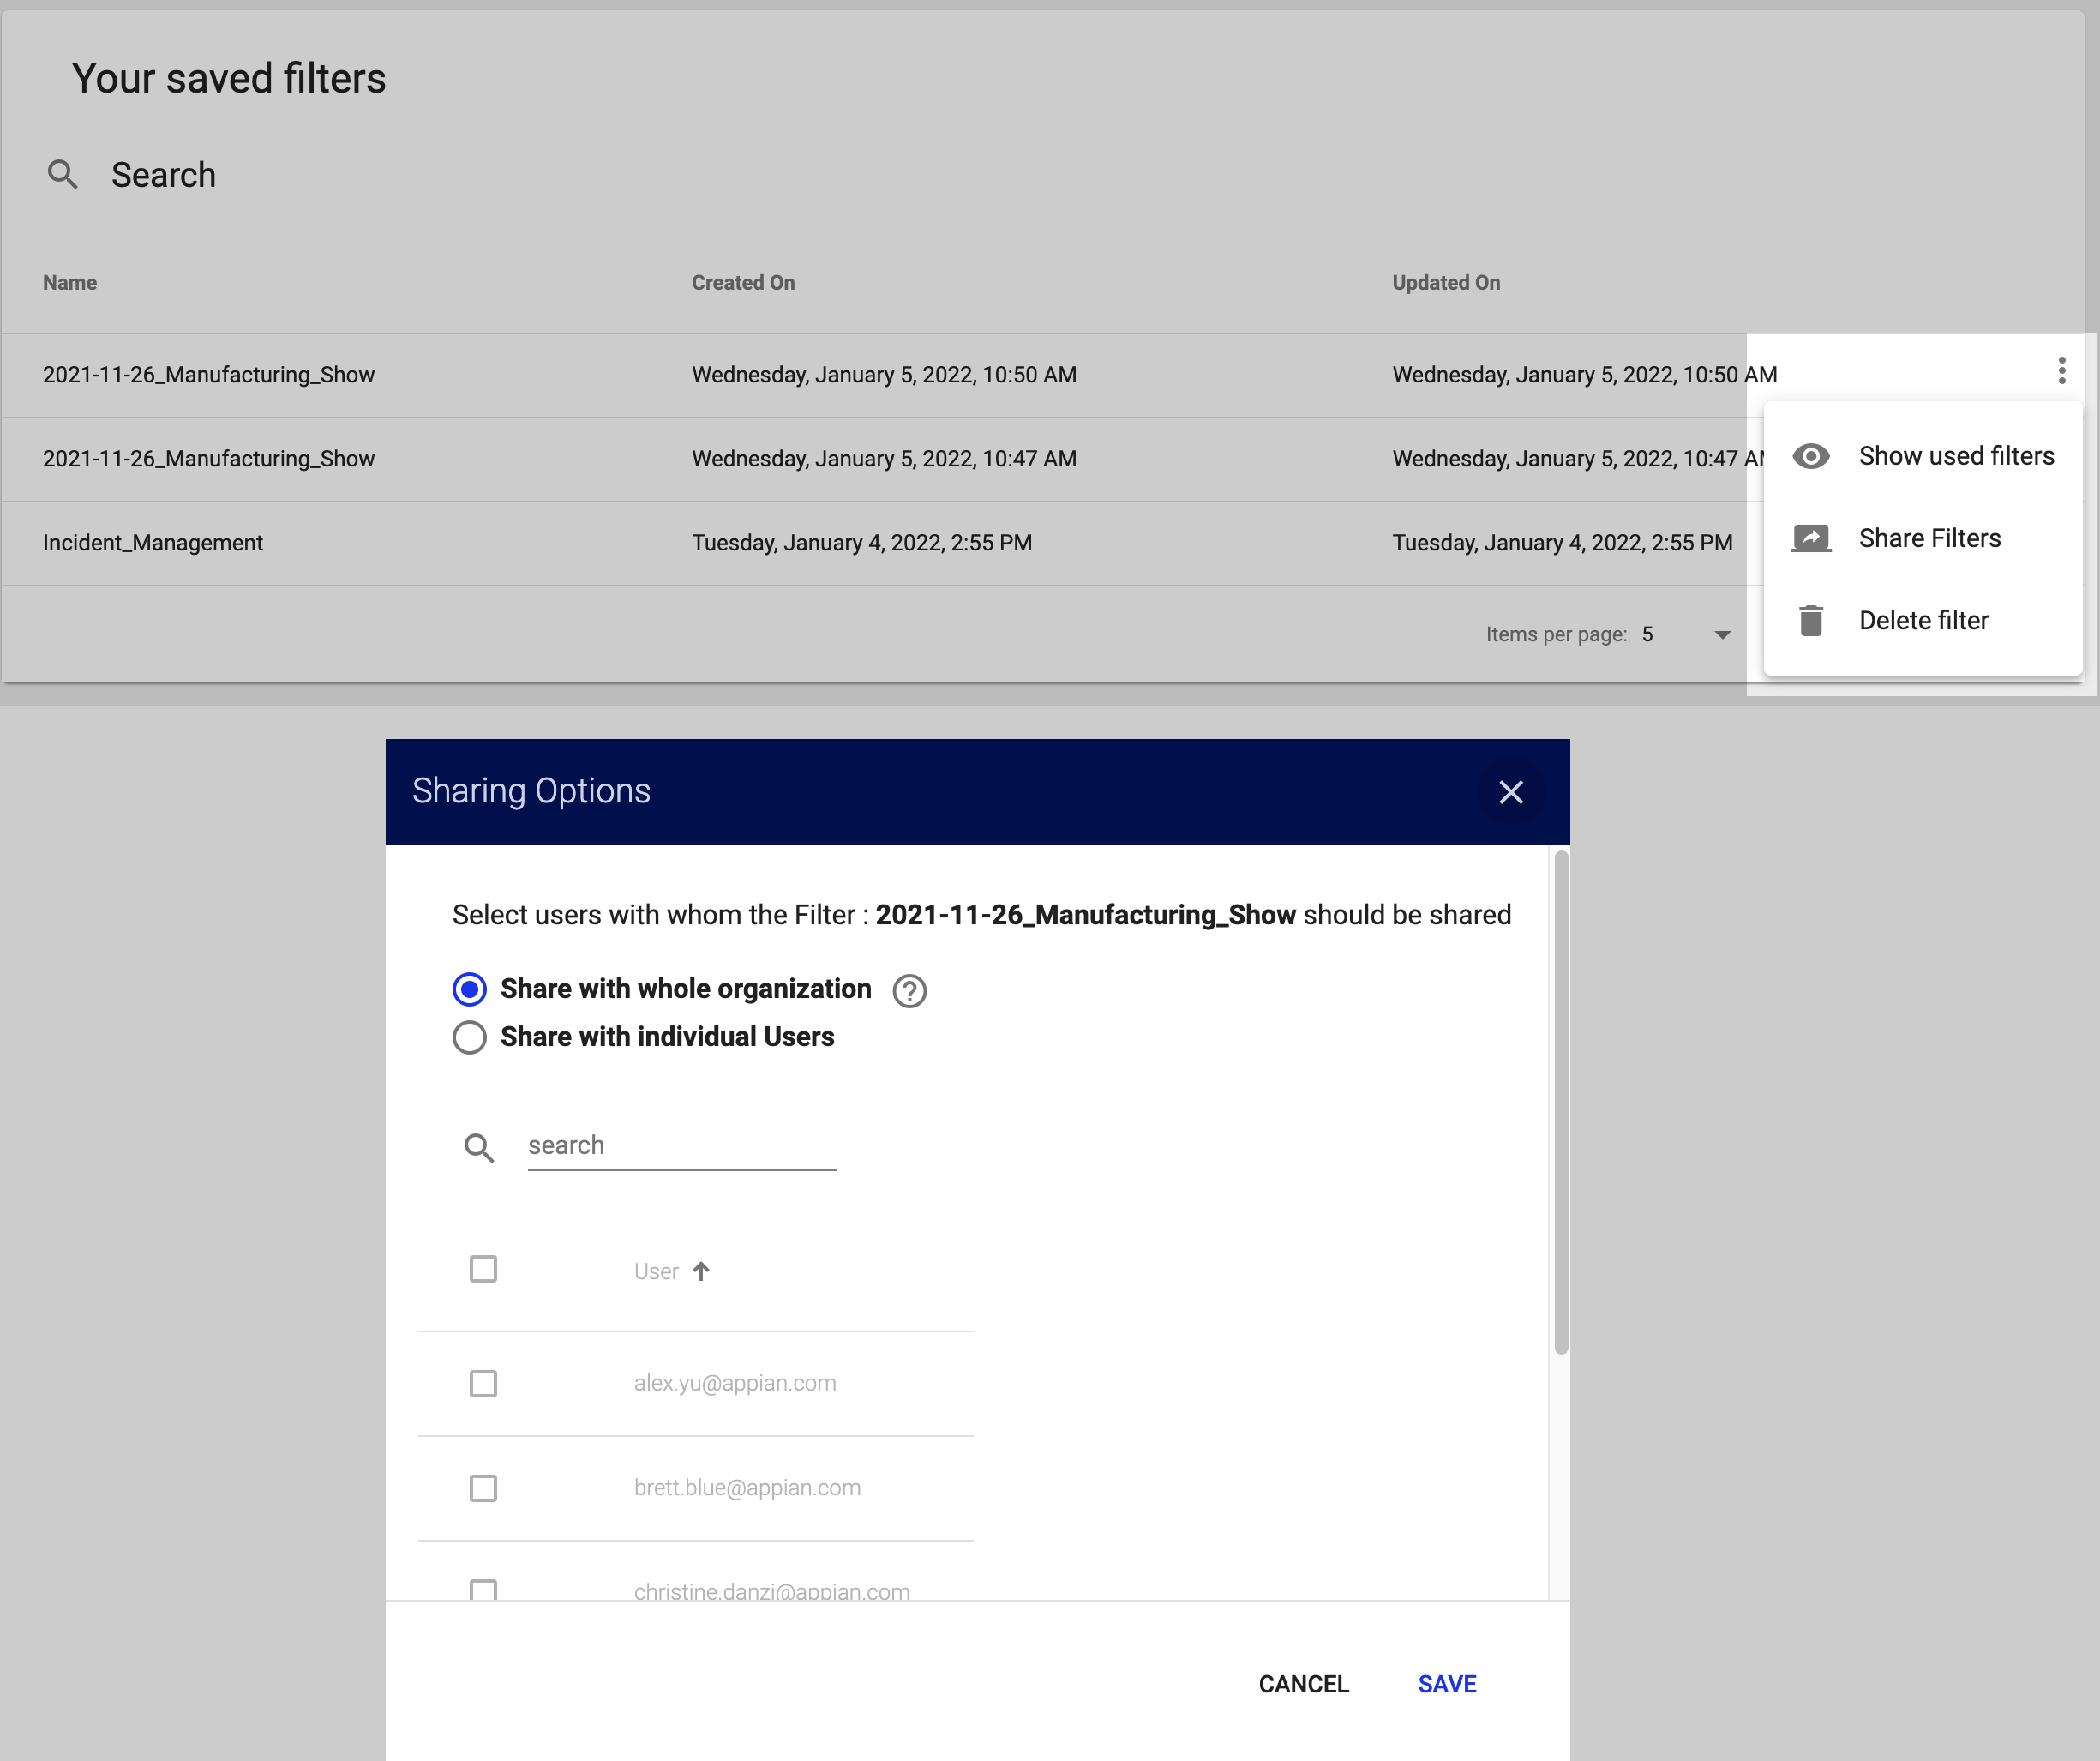
- On the Filter Management page, open the context menu for the filter you want to share.
- Click Share Filters.
- Choose how you want to share the filter:
- Share with whole organization: Make the filter available to everyone else in your organization.
- Share with individual Users: Make the filter available to specific people you choose. Search or browser the users in the list. Select the checkbox next to a user's name to share the filter with them.
- Click SAVE.
To edit sharing preferences:
- Open Filter Management in the menu.
- On the Filter Management page, open the context menu for the filter you want to share.
- Click Edit sharing preferences.
- Edit the selections to change who the filter is shared with.
- Click SAVE.
To unshare a filter:
- Open Filter Management in the menu.
- On the Filter Management page, open the context menu for the filter you want to share.
- Click Unshare Filters.
This removes all sharing for the filter.
Show used filtersCopy link to clipboard
On the Filter Management page, you can see the JSON configuration of each filter you have saved.
- Open Filter Management in the menu.
- On the Filter Management page, open the context menu for the filter you want to share.
- Click Show used filters.
- In the Used filters window, the filter settings as shown as JSON. You can see the selected filters, values, and ranges.
Create a new log with the applied filtersCopy link to clipboard
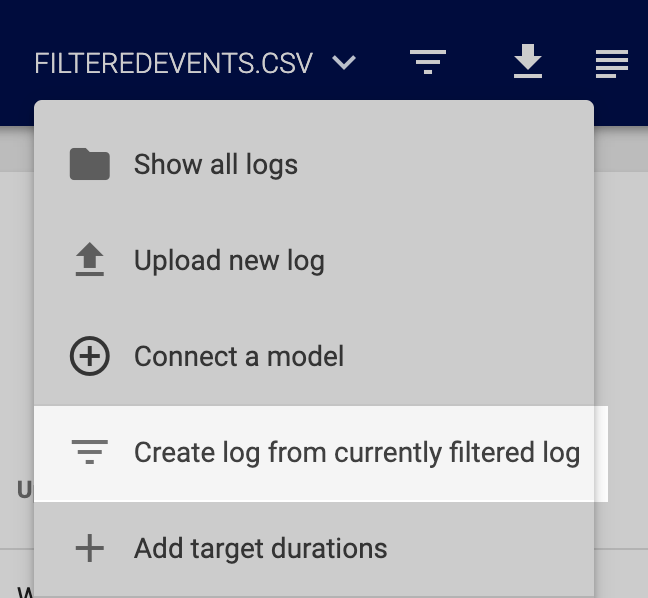
You can create a new log using the filtered data. This is helpful if you want to use the filtered data as a baseline moving forward. The original log file isn't altered. Instead, a new log file is created but only contains the resulting data from the filter currently applied.
To create a new log from the filtered view:
- Click the log name in the toolbar.
- In the menu, select Create log from currently filtered log.
- Type a name for the new log.
- Click CREATE NEW LOG.
- The log file downloads as a
.csvon your machine.
