
| The capabilities described on this page are included in Appian's advanced and premium capability tiers. Usage limits may apply. |
OverviewCopy link to clipboard
Appian's data fabric allows developers to unify, secure, and optimize data spread across the enterprise. With this unified data architecture, you can quickly build modern, data-driven applications that automate your business. But it's not just developers who benefit from a unified data fabric. Data fabric insights extends the power of data fabric to business users.
This page describes the data fabric insights capability, how the data concepts you already know are presented to business users, and how users can leverage that data to answer their common business questions.
If you're already familiar with data fabric insights, learn how to get started securing and preparing data for data fabric insights.
About data fabric insightsCopy link to clipboard
Data fabric insights allows business users to securely explore their data fabric and build custom reports and dashboards in Process HQ.
Users can browse a catalog of datasets—secured by record type security and record-level security—and quickly design reports to fit their business needs. When they partner with Appian AI Copilot, users can either:
- Ask questions of any of their datasets from the data catalog, or
- Dig deeper into their reports by using AI-generated insights to identify patterns, trends, and outliers.
Users can combine their reports into a unified dashboard. Once they finish building their reports and dashboards, users can save them for future exploration, download their charts as images, or export their grids to Microsoft Excel. All saved reports and dashboards are easily accessible from the Process HQ landing page, where users can view, duplicate, and share reports and dashboards.
DatasetsCopy link to clipboard
As a developer, you're familiar with the record type and how relationships and record type security let you access data from the record type and its related record types. To business users, we use datasets to represent this same capability so they don't need as much familiarity with the technical details of your data fabric.
Each dataset is made up of a record type and its one-to-one and many-to-one related record types. For example, the image below illustrates the Customers dataset, where the Customer record type is the base record type. Based on the one-to-one and many-to-one relationships configured on the Customer record type, this dataset would include data from the Customers, Districts, Addresses, and Credit Cards record types.
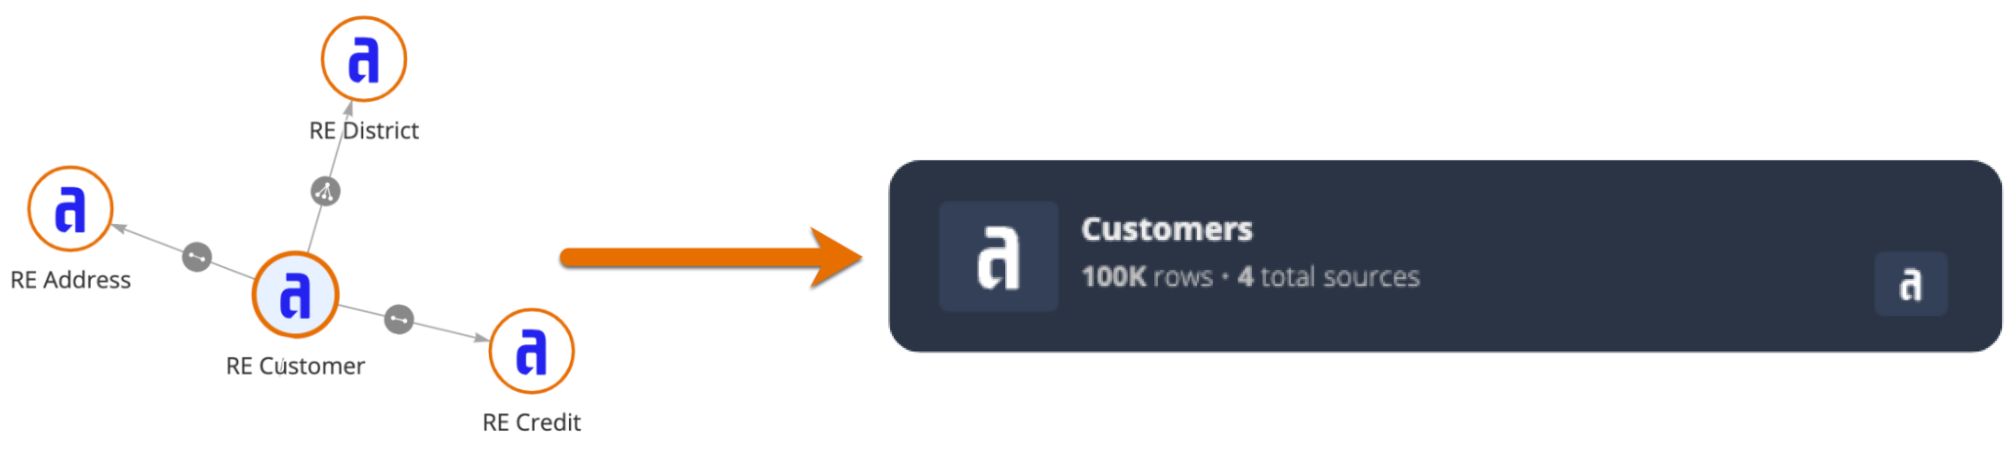

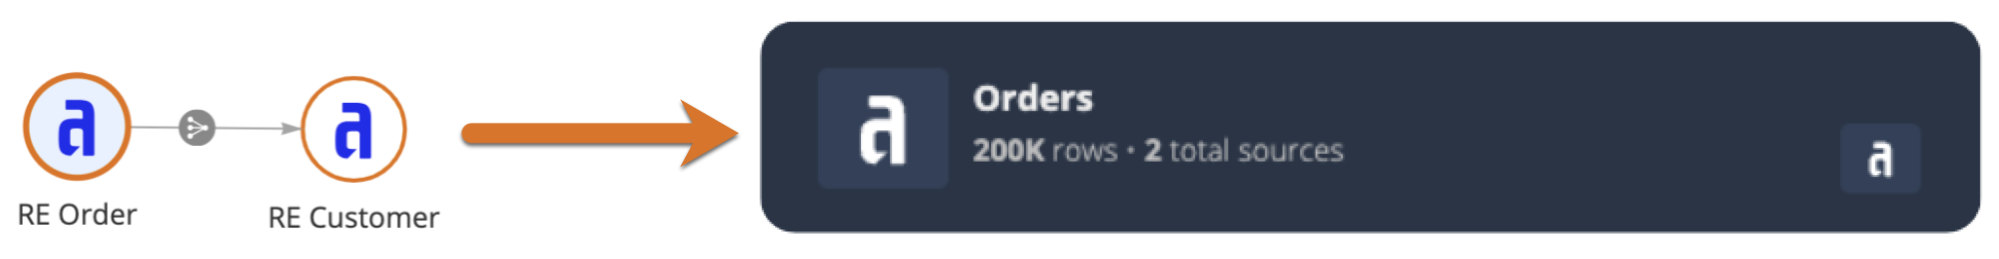
A dataset will not include data from one-to-many relationships. So if the Customer record type has a one-to-many relationship to the Order record type, it would not appear in the Customers dataset. Instead, a user could explore order and customer data together using the Orders dataset, so long as the Order record type has a relationship to the Customer record type.
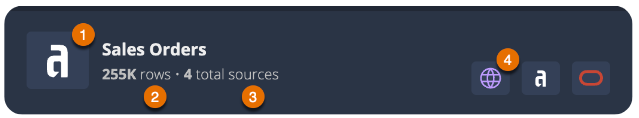
Users can learn more about a dataset by hovering over the vendor logos. The following image highlights the elements that make up a dataset:
| # | Element |
|---|---|
| 1 | The data source of the base record type, represented by the vendor logo. In the example above, the Appian logo represents the Appian Cloud database. Users can hover over the logo to see the source type and the source name of the base record type. |
| 2 | The number of rows in the base record type as of the last full sync. |
| 3 | The number of data sources included in the dataset. This number includes the data source of the base record type. |
| 4 | The data source of each related record type, grouped by vendor. Only the unique vendor logos will display here. Users can hover over each logo to see which data comes from each source. |
ReportsCopy link to clipboard
Business users can further explore and analyze their data by building custom reports.
To create a report, users can select a dataset from the Data Catalog, or use a more guided experience to pick the data and design of their report.

Then, users can hand-pick fields to display in a grid, chart, or KPI. They can also add design elements, like record actions and record links, to empower report viewers to take action from the context of their report. As they design the report, users can filter, sort, and format the data to meet their specific needs.
Once users finish building a report, they can save it for future exploration. By default, a report is only available to the user who created it.
To collaborate across the organization, users can share their reports with everyone in the Data Fabric Report Creators system group.
AI CopilotCopy link to clipboard
Users can gain new insights into their data by asking questions to Appian AI Copilot. Users get faster, real-time insights into their data without relying on a human being to find and analyze the data for them.
Note: AI tools are primarily designed for language-based tasks, such as generating text, answering questions, or providing insights. While AI Copilot for data fabric can assist with obtaining numerical answers, other AI Copilot tools are not optimized for performing precise mathematical calculations or for scenarios that require numerical accuracy.
These capabilities are only available in select regions. If your Appian environment is in an unsupported region, you can choose to send your data to a supported region. This won't change your environment's region. For more information, contact Appian Support.
AI Copilot for data fabricCopy link to clipboard
Note: This feature is available as a preview. Preview features are fully supported; however, they do not reflect the full functionality or performance of the feature yet.
In the Data Catalog, users can ask AI Copilot to filter or analyze data from any dataset. For example:
- Filter: What cases have been created this year?
- Analyze: How many of those cases are open?
Users don't need to know which dataset contains the information they're looking for in order to get started. Instead, they just click AI COPILOT and ask their question in their own words. AI Copilot queries the appropriate dataset to provide insights from the available information. The response also includes information about how AI Copilot arrived at its answer, ensuring trust and accuracy.
AI Copilot can interpret questions and provide answers in many languages, in addition to English. As with all generative AI, you may experience a range of responses depending on factors like language, phrasing, and complexity of the request. If you ask a question that references a field value, we recommend wrapping that literal value in quotation marks so AI Copilot is able to reference it. For example, if your record data is in English, you would format a question in Spanish as: ¿Cuantos casos están "Open"?.
AI Copilot for reportsCopy link to clipboard
Users can ask AI Copilot questions about their reports, or select from a list of suggested questions to discover potential areas of improvements and next steps. AI Copilot can only analyze aggregate data in a report. AI Copilot is available for reports that involve grouped data or basic calculations, such as sum, count, or average. It is not intended for performing precise mathematical calculations or for scenarios that require numerical accuracy.
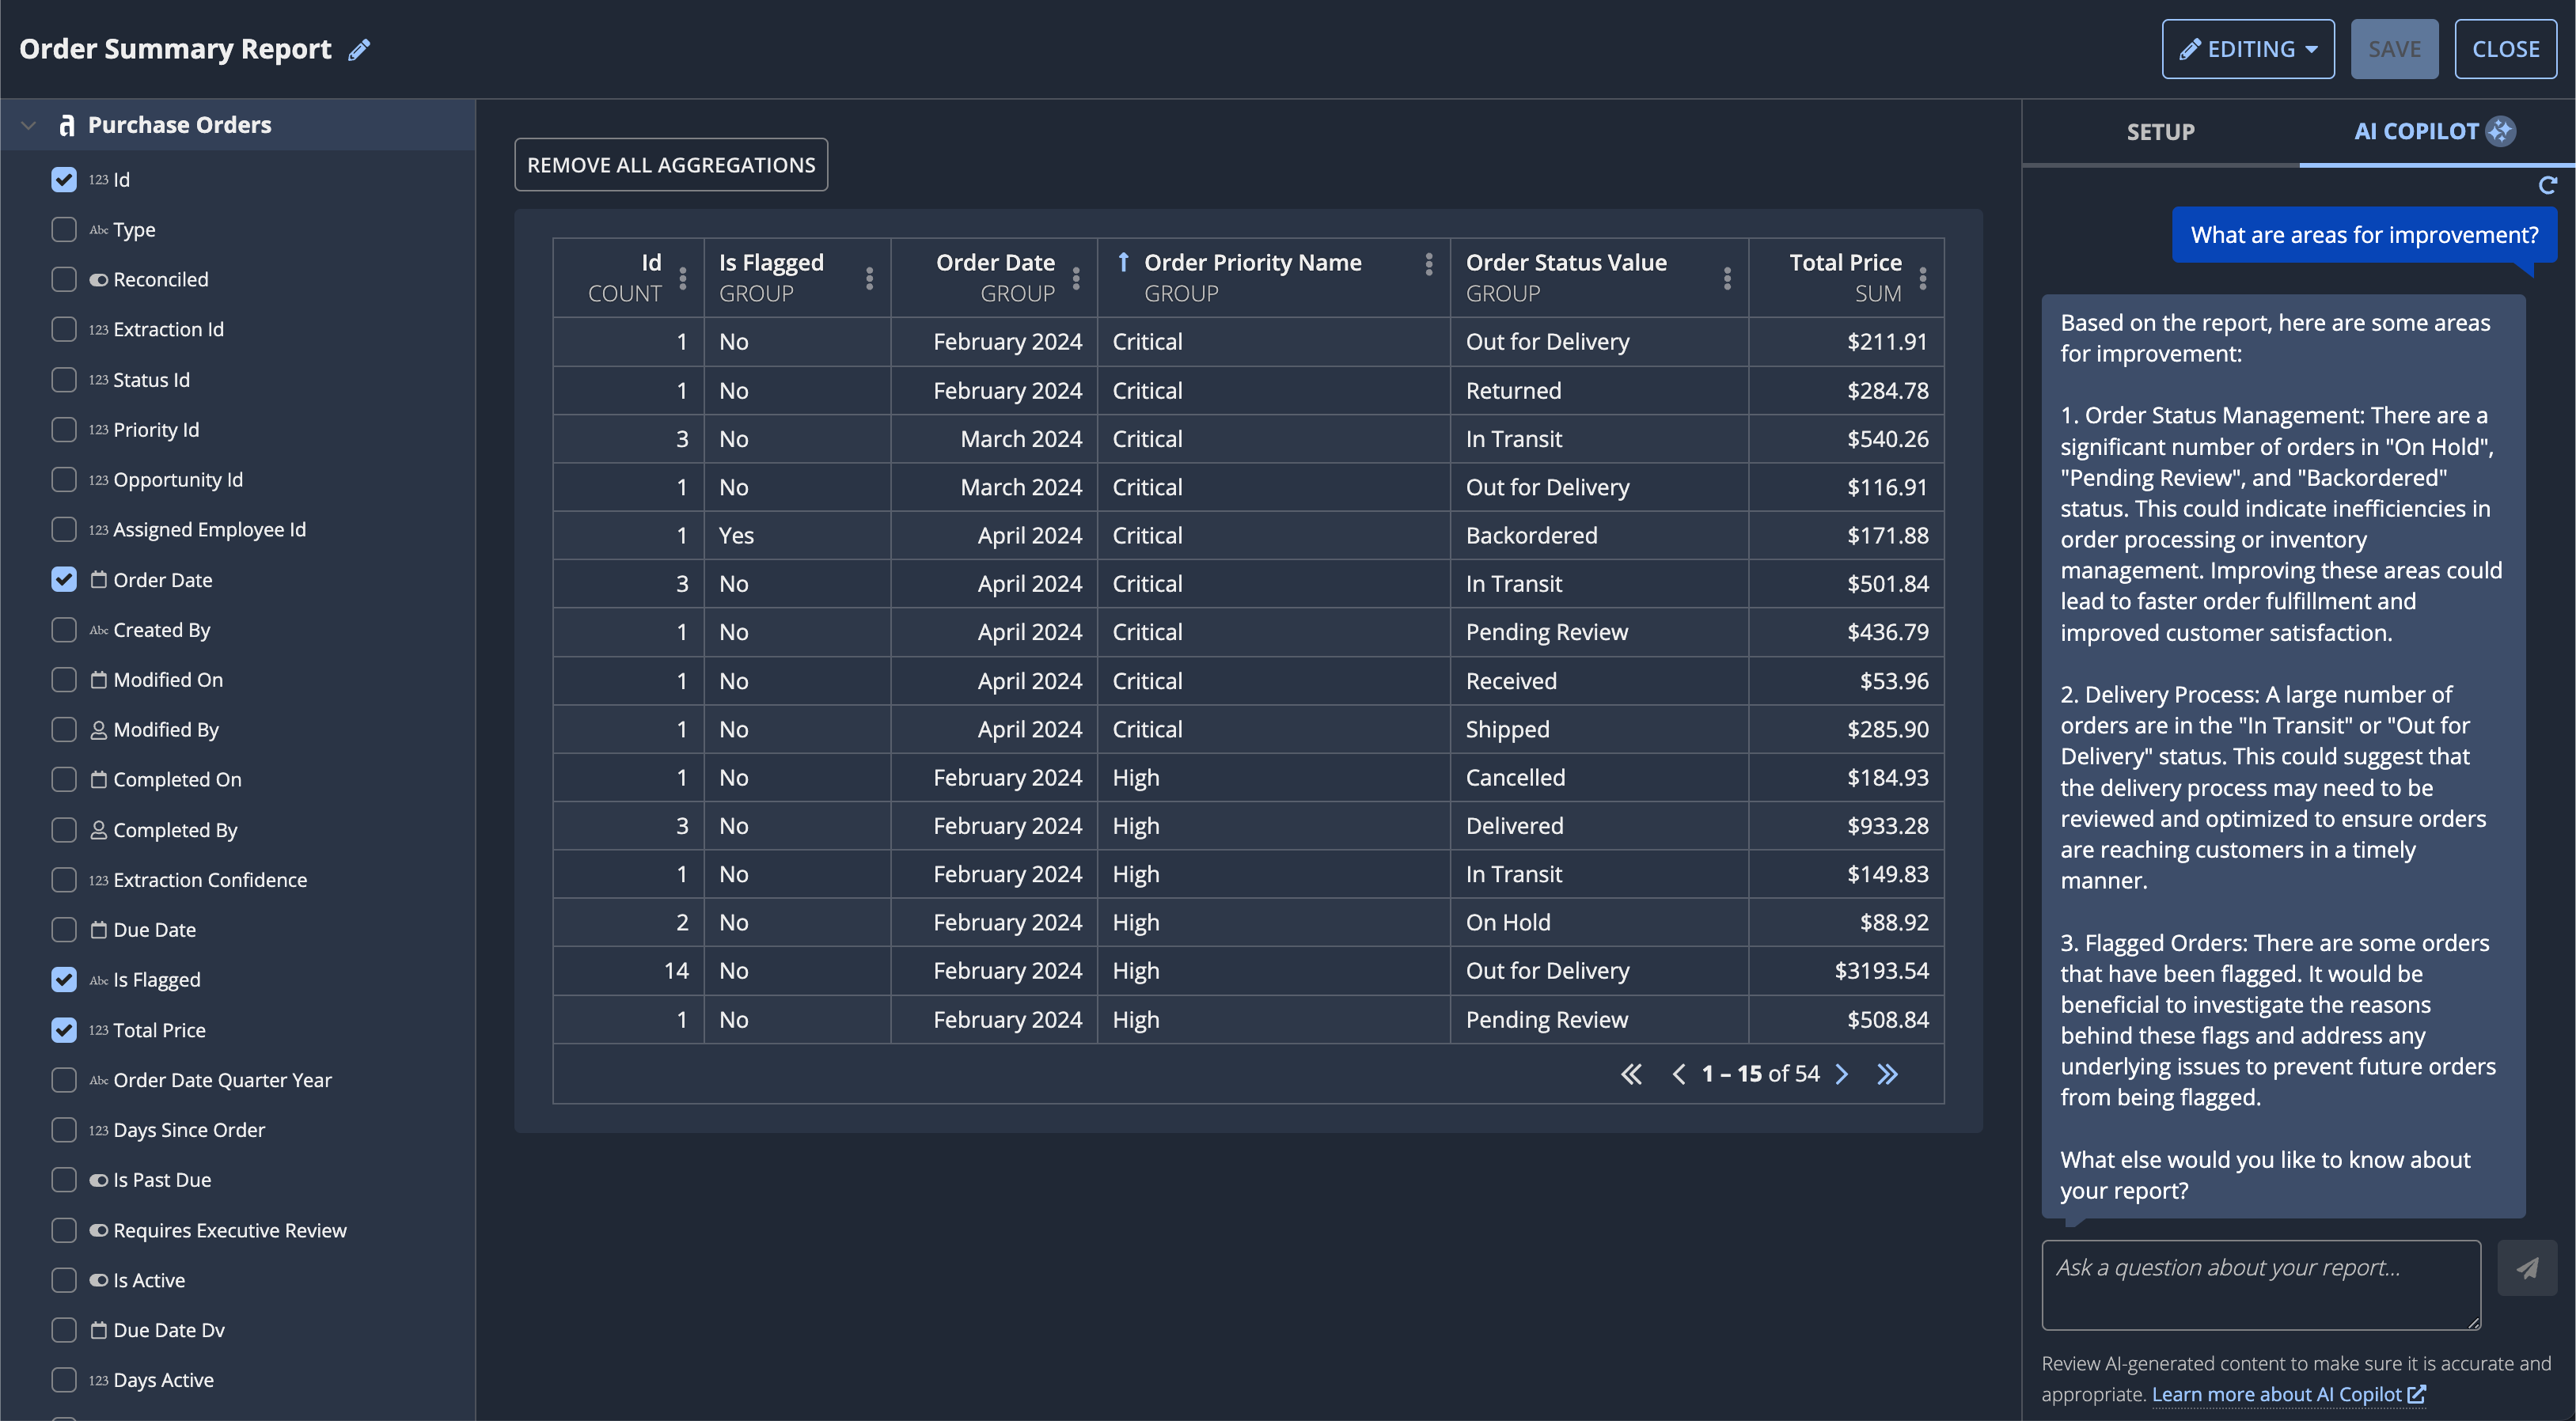
Tip: AI Copilot can only assist users in understanding their custom-built reports; it can't build reports for them.
DashboardsCopy link to clipboard
Users can tell a complete story with their data by combining reports into a comprehensive dashboard. In a dashboard, users can pull together their custom reports and reports shared with them to display related information in an easily scannable format.
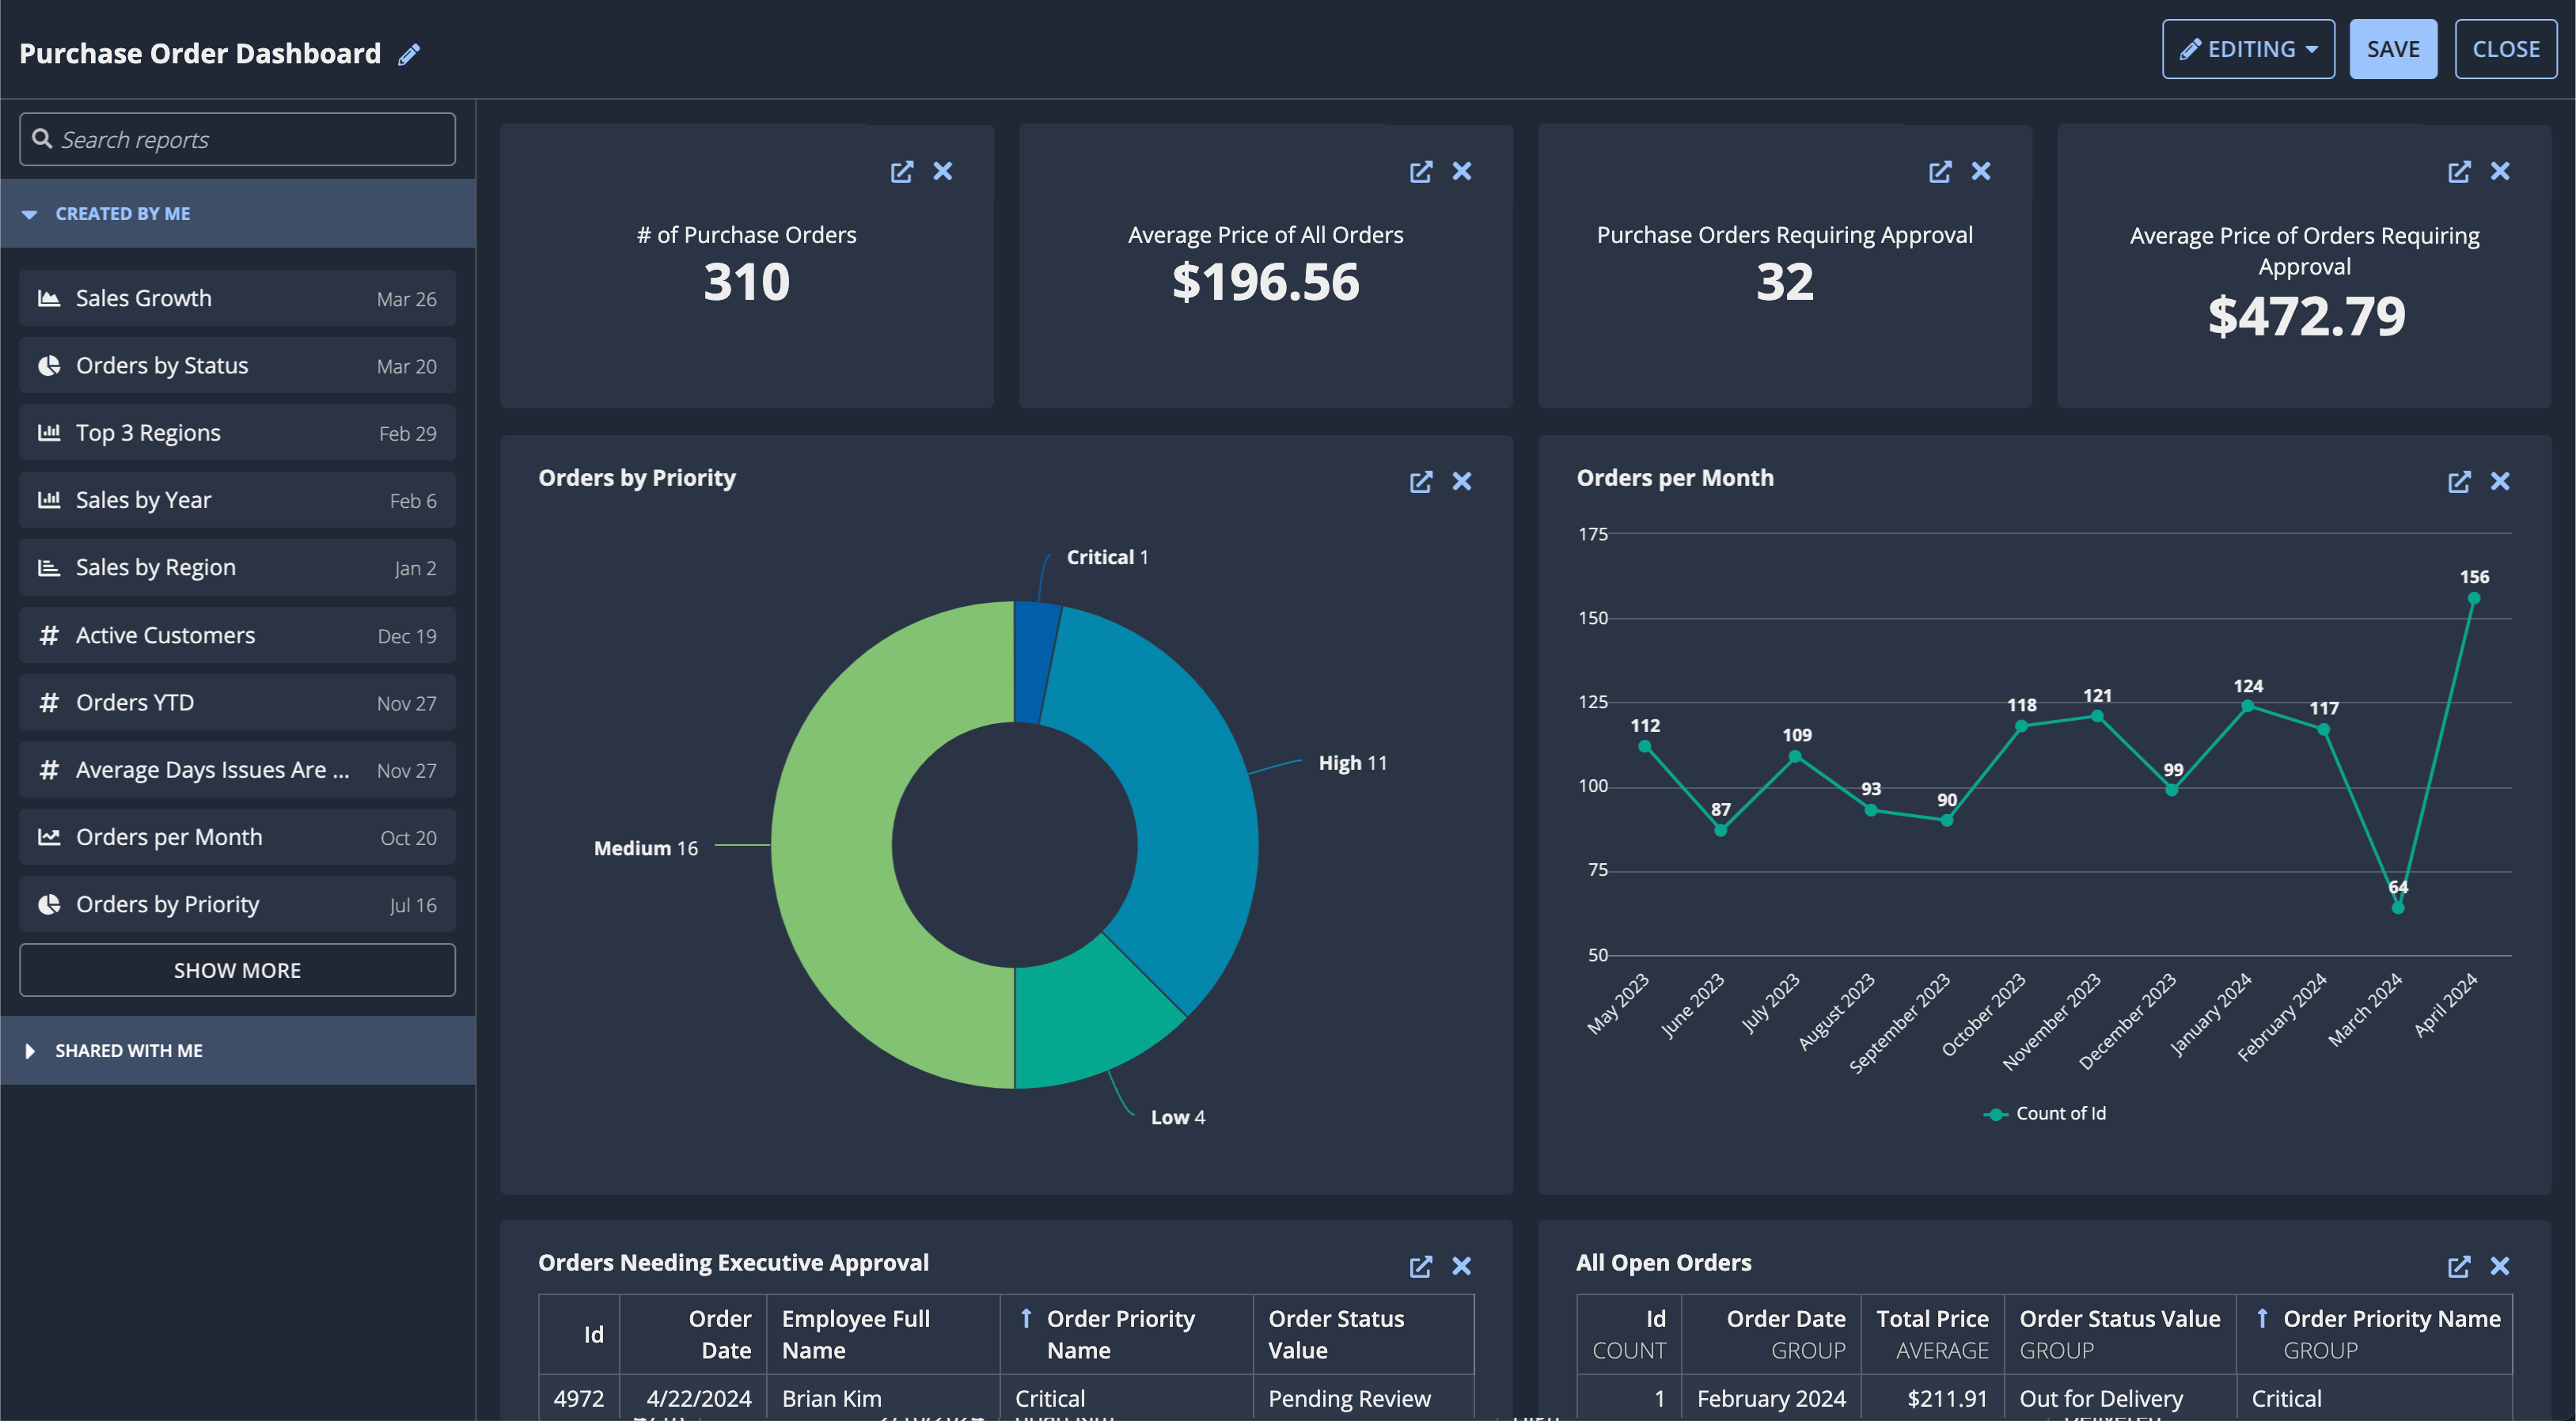
Just like a report, users can save a dashboard for future reference and share it with everyone in the Data Fabric Report Creators system group.
Get startedCopy link to clipboard
To allow users to access data fabric insights and build custom reports and dashboards:
- Add users as report creators.
- Choose which record types are available as datasets in Process HQ.
- Review security on those record types.
- Prepare data for data fabric insights.