The performance view shows you detailed performance information for your expression. You can view live performance results of the expression in the designer or historical trends of the performance over time.
You can access the performance view in any of these objects: interface, record type, or expression rule. In the interface object, you can access it on the Performance tab in the live view. In record types, you can access it on the Performance page. In expression rules, you can access it using the gear menu in the header.
The performance view for rules and interfaces also contains historical performance trends. You can also view performance trends for all interfaces or expression rules in the system from the Rule Performance page of the Admin Console.
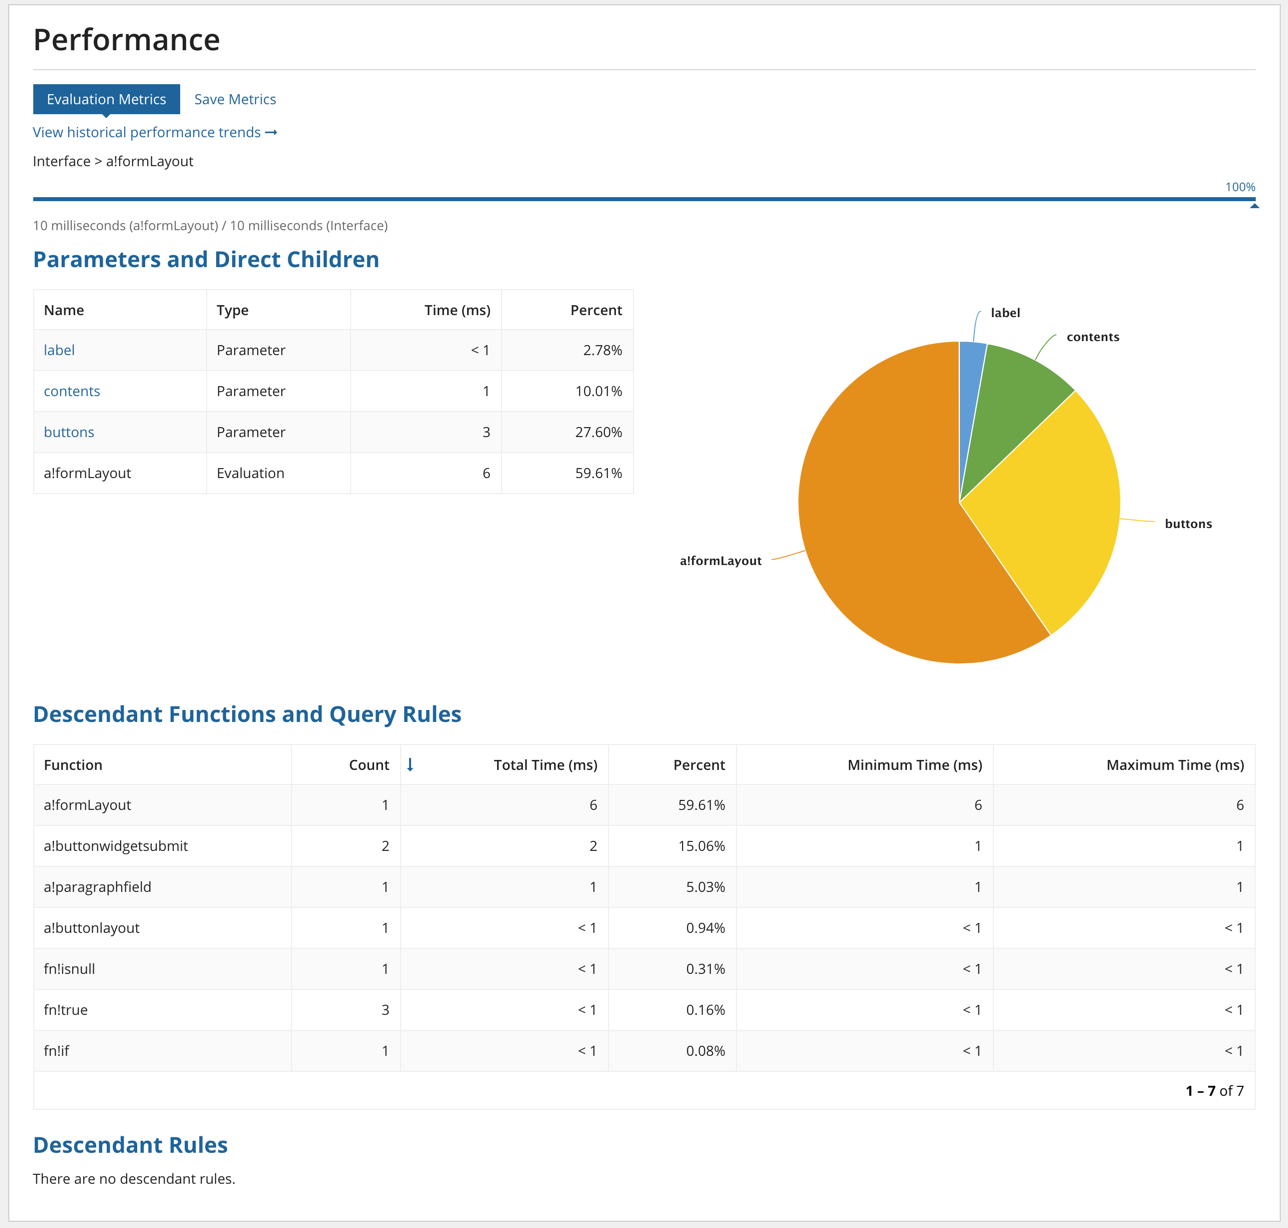
When you open the Performance View, your expression is reevaluated and live performance details are displayed, as shown below. For interfaces, the performance view shows the most recent evaluation of your expression and include Save Metrics in addition to Evaluation Metrics. See the Save Metrics section below for more details.
The performance view provides details on total evaluation time as well as how each part of your expression contributes to that time. This allows you to identify and address performance bottlenecks and to understand the impact of particular rules and functions.
You still have access to your interface expression while viewing the performance view. If you update your expression, the live performance details are updated with the new measurements. Clicking the Test button evaluates the expression as if for the first time, providing updated measurements.
Tip: Because the load() function only makes variable assignments upon its initial evaluation of an interface, measuring those assignments requires entering the performance view and clicking the Test button.
Initially, measurements for the top-level rule or function in the expression are displayed. You can click links or charts to drill down to a particular function, rule, or parameter. When you do, the location at the top of the performance view is updated with a breadcrumb that can be clicked to navigate back to a higher level. The blue bar beneath the breadcrumb shows the current part of the expression's contribution to the overall evaluation time.
Tip: For interfaces and record types, the measured time is often shorter than the time you observe while waiting for the object to load. This is because what is measured is specifically the time spent evaluating your expression and does not include application server overhead, network transmission, or client rendering. For information on other sources of delay, see Interface Evaluation Lifecycle.
This section displays information about the current function, rule, or parameter. The grid displays the following columns:
| Column Name | Description |
|---|---|
| Name | The name of the function, rule, or parameter. |
| Type | The current function, rule, or parameter is labeled *Evaluation* or *Save* if viewing evaluation or save metrics respectively, its parameters are labeled *Parameter*, and rules or functions that were part of its evaluation are labeled *Child*. |
| Time (ms) | The time spent evaluating the function, rule, or parameter. |
| Percent | Percent of the total time spent evaluating this function, rule, or parameter. |
The pie chart visually displays the data described in the Percent column. You can click on a linked name in the grid or a pie chart section to drill into that function, rule, or parameter.
This section displays each function and query that contributed to the overall evaluation time of the current function, rule, or parameter. Initially, it displays all the functions and queries invoked while evaluating the entire expression, but when you drill down, the grid is filtered to show only those functions and rules that contributed to the evaluation time of the current function, rule, or parameter. The grid displays the following columns:
| Column Name | Description |
|---|---|
| Function/Rule | The name of the function or query. |
| Count | Number of times the function or query was invoked while evaluating the current function, rule, or parameter. |
| Total Time (ms) | Cumulative time spent evaluating all invocations of this function or query. |
| Percent | Percent of the total time spent evaluating all invocations of this function or query. |
| Minimum Time (ms) | The shortest evaluation time of the function or query. |
| Maximum Time (ms) | The longest evaluation time of the function or query. |
Like the Descendant Functions and Queries section, this section displays each interface or expression rule that contributed to the overall evaluation time of the current function, rule, or parameter. Initially, it displays all interfaces or expression rules invoked while evaluating the entire expression, but when you drill down, the grid is filtered to show only those interfaces and expression rules that contributed to the evaluation time of the current function, rule, or parameter. The grid displays the same columns as described above.
Note: While function and query evaluation times are independent, rule evaluation times often overlap. If rule!a calls rule!b, then rule!a's measured time will include the time spent evaluating rule!b. This means that adding all the percentages from the Descendant Rules grid often results in a total greater than 100%.
If your interface contains multiple queries, parts of the expression may evaluate in parallel. This means that the total time the interface took to evaluate may be less than the sum of the evaluation time of each function that is called. Because of this, percentages may add up to more than 100%.
When analyzing the performance of an interface that is being evaluated in parallel, the performance view will still help you identify bottlenecks by showing functions or rules that are outliers. As you make changes to the expression, however, you may not see a 1-to-1 improvement between the part you just improved and the overall evaluation time.
To illustrate this, let's look at this example. Say you have an expression that evaluates as described by this diagram:
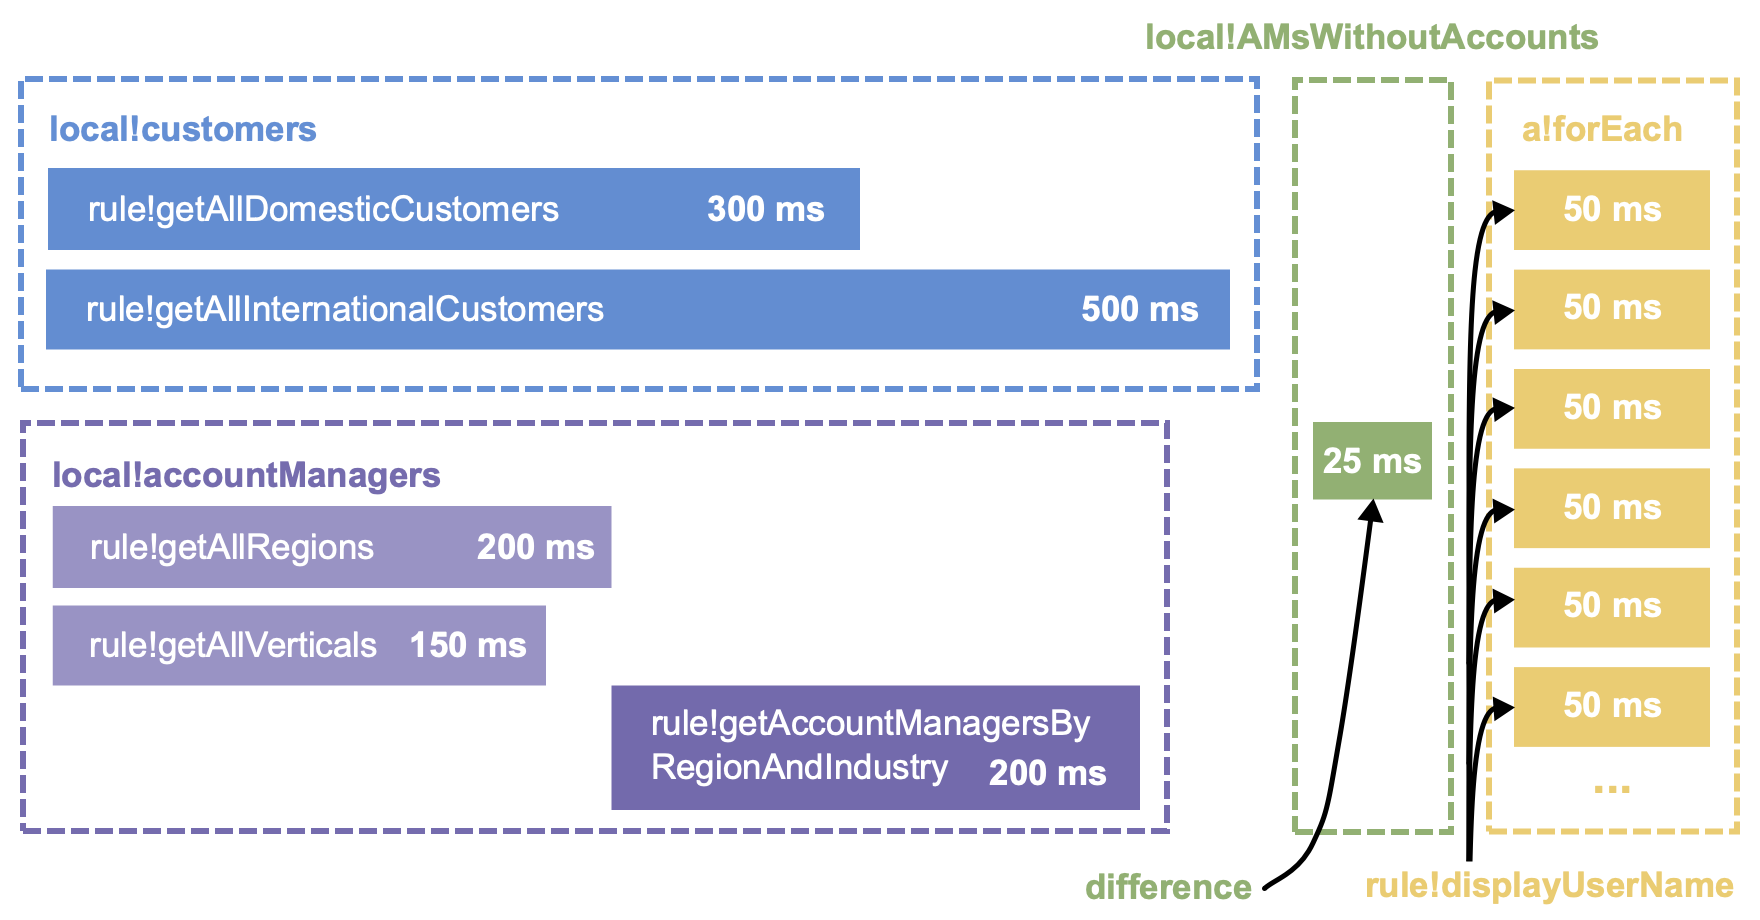
By looking at the performance view for this expression, you may identify rule!getAllInternationalCustomers and rule!getAllDomesticCustomers as bottlenecks and target them for performance improvements. If you were able to improve the performance of rule!getAllDomesticCustomers to 100 ms, you would notice that the overall evaluation time would not decrease because that query is being evaluated in parallel with other queries which are still taking longer. However, if you instead were to improve the performance of rule!getAllInternationalCustomers to 100 ms, the overall evaluation time would decrease by 100 ms instead of 400 ms because it is still evaluating in parallel with local!accountManagers, which now becomes the new bottleneck.
Tip: It is always advantageous to improve the performance of parts of your expression where you can, even if it may not make a noticeable difference when evaluated in parallel. First, expressions are only evaluated in parallel when resources are available. If an expression is evaluated while the site is under load, it may not be able to evaluate in parallel. Second, improving the performance of queries reduces the overall load on both Appian and the system that is being queried.
As outlined on the Interface Evaluation Lifecycle, when the server receives a change to a component value, it must first evaluate the expression to locate and execute the component's save configuration (the saveInto parameter). Save metrics show the performance of the component's save configuration. Then, the expression is evaluated again to display the new interface context; these metrics are shown on the evaluation metrics tab.
Not all save configurations are displayed on the save metrics tab. Simple variable assignments (setting the saveInto parameter to be a variable) do not appear within save metrics as these evaluations are negligible in the context of performance. However, complex saves, where there are expressions (including rules) executed within the value parameter of a save function, will be displayed on the save metrics tab. To illustrate this point further, let's use the examples from the Save Function page.
For each example below, copy and paste the expression into the INTERFACE DEFINITION in EXPRESSION MODE. Then, type something into the text field on the Edit or Preview tab and switch to the Performance tab and select Save Metrics.
Simple variable assignment - does not appear on Save Metrics tab
1
2
3
4
5
6
7
8
9
10
11
	=a!localVariables(
	  local!text,
    local!number,
	  a!textField(
	    value: local!text,
	    saveInto: {
	       local!text,
	       a!save(local!number, 1)
      }
	  )
	)
Complex save to uppercase the typed text - will appear on Save Metrics tab
1
2
3
4
5
6
7
	=a!localVariables(
	  local!text,
	  a!textField(
	    value: local!text,
	    saveInto: a!save(local!text, upper(save!value))
	  )
	)
The historical performance trends subview of the performance view offers a look at how this interface or expression rule has performed in the past. A moving window of thirty days of performance metrics are gathered and stored as end users interact with the interface or expression rule. The data in this view can help you understand how your expression is performing under real usage by showing the overall trends over time.
The historical performance trends are always for the top-level expression. It does not show the historical performance of the particular function, rule, or parameter within the expression.
Like the live performance details, this historical view captures only the time spent evaluating the expression. It does not capture network transmission or client rendering time, so the values shown in this interface are always slightly less than the load time experienced by end users of your interface.
The evaluation times recorded do not include the evaluation of the expression while it is tested through the interface or expression rule designers. The exception to this is when the interface or expression rule is embedded within a different expression and that expression is evaluated or tested in the interface or expression rule designers.
There are 4 aggregation levels offered for analyzing the historical performance of the interface.
The per-minute aggregation level of the historical performance trends shows the performance of the interface or expression rule on a minute by minute basis. It is the highest granularity view of the performance data and is most suitable for analyzing performance changes during iterative interface and rule design. In this view, you are able to filter the results even further with a given start date, start time, end date, and end time.
The times are displayed in the time zone of the user viewing the grid. There are 2 graphs and a grid shown when this aggregation is selected:
The hourly aggregation analyzes the performance on an hourly basis, providing insight into how the performance changes hour by hour. It is the default aggregation level of the historical performance trends. In this view, you are able to filter the results even further with a given start date, start time, end date, and end time.
When viewing the hourly aggregation, the hours are displayed in the time zone of the user viewing the grid. The averages are calculated using the unweighted average of the per-minute averages corresponding to the hour. There are 2 graphs and a grid shown when this aggregation is selected:
The daily aggregation analyzes the performance on a daily basis. The day boundaries are determined based on the viewing user's time zone (midnight to midnight in their time zone). The averages are calculated using the unweighted average of the per-minute averages corresponding to the day. Like the hourly aggregation, there are 2 graphs and a grid shown when this aggregation is selected:
The weekly aggregation analyzes the performance on a week to week basis. The week boundaries are determined based on the viewing user's time zone, starting on Sunday (Sunday through Saturday). The averages are calculated using the unweighted average of the per-minute averages corresponding to the week. Like the hourly and daily aggregations, there are 2 graphs and a grid shown when this aggregation is selected:
