OverviewCopy link to clipboard
Asynchronous (async) loading can provide a better user experience by allowing users to interact with key elements of the interface while they are waiting for slower-loading components to display. By reducing the initial wait time, users experience a more responsive interface, keeping them engaged and productive. This is especially useful in dashboards and employee home pages.
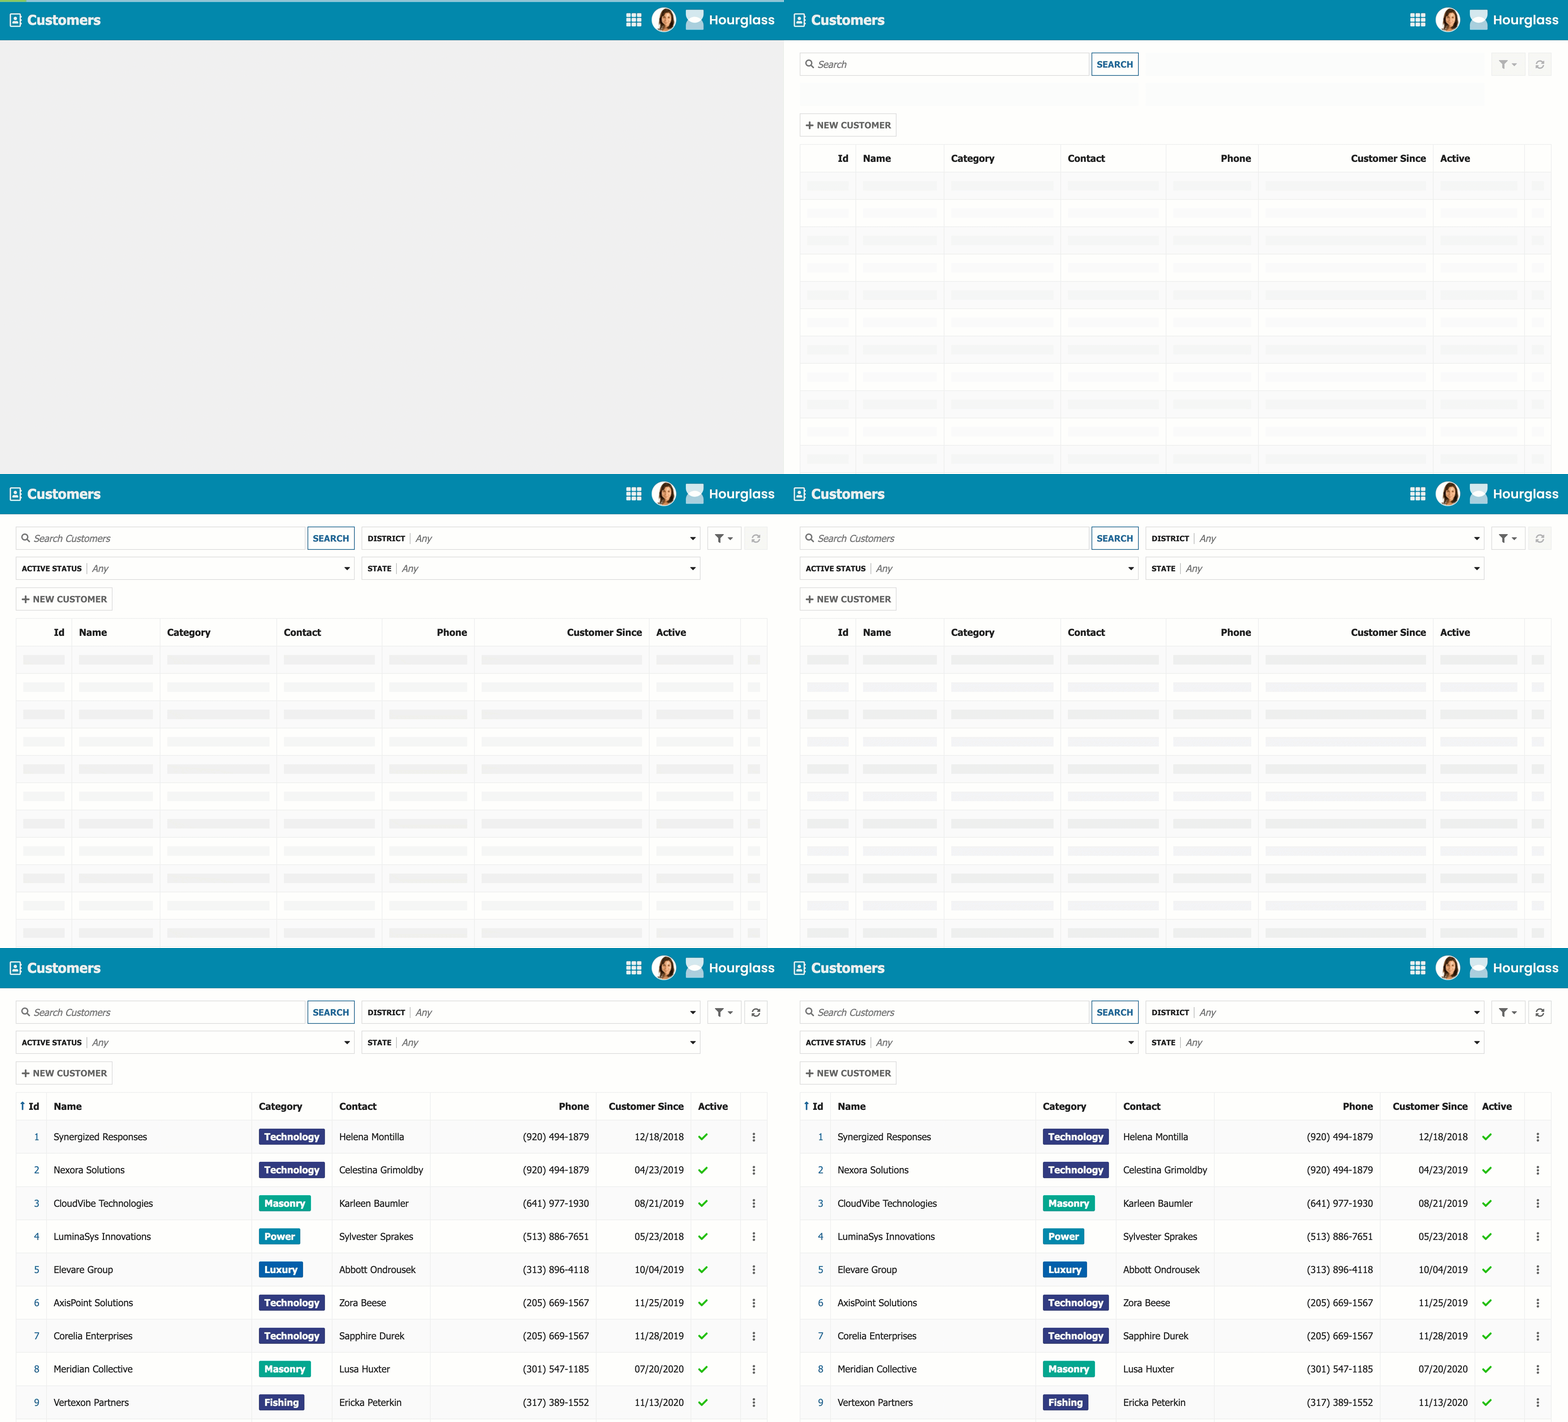
You can configure read-only grids, charts, and KPIs to load independently from the rest of the interface content. The rest of the interface will display as soon as it is finished loading. The async components will be replaced with placeholder skeletons while they are waiting for their data to load, so users will know they can expect the data to display soon.
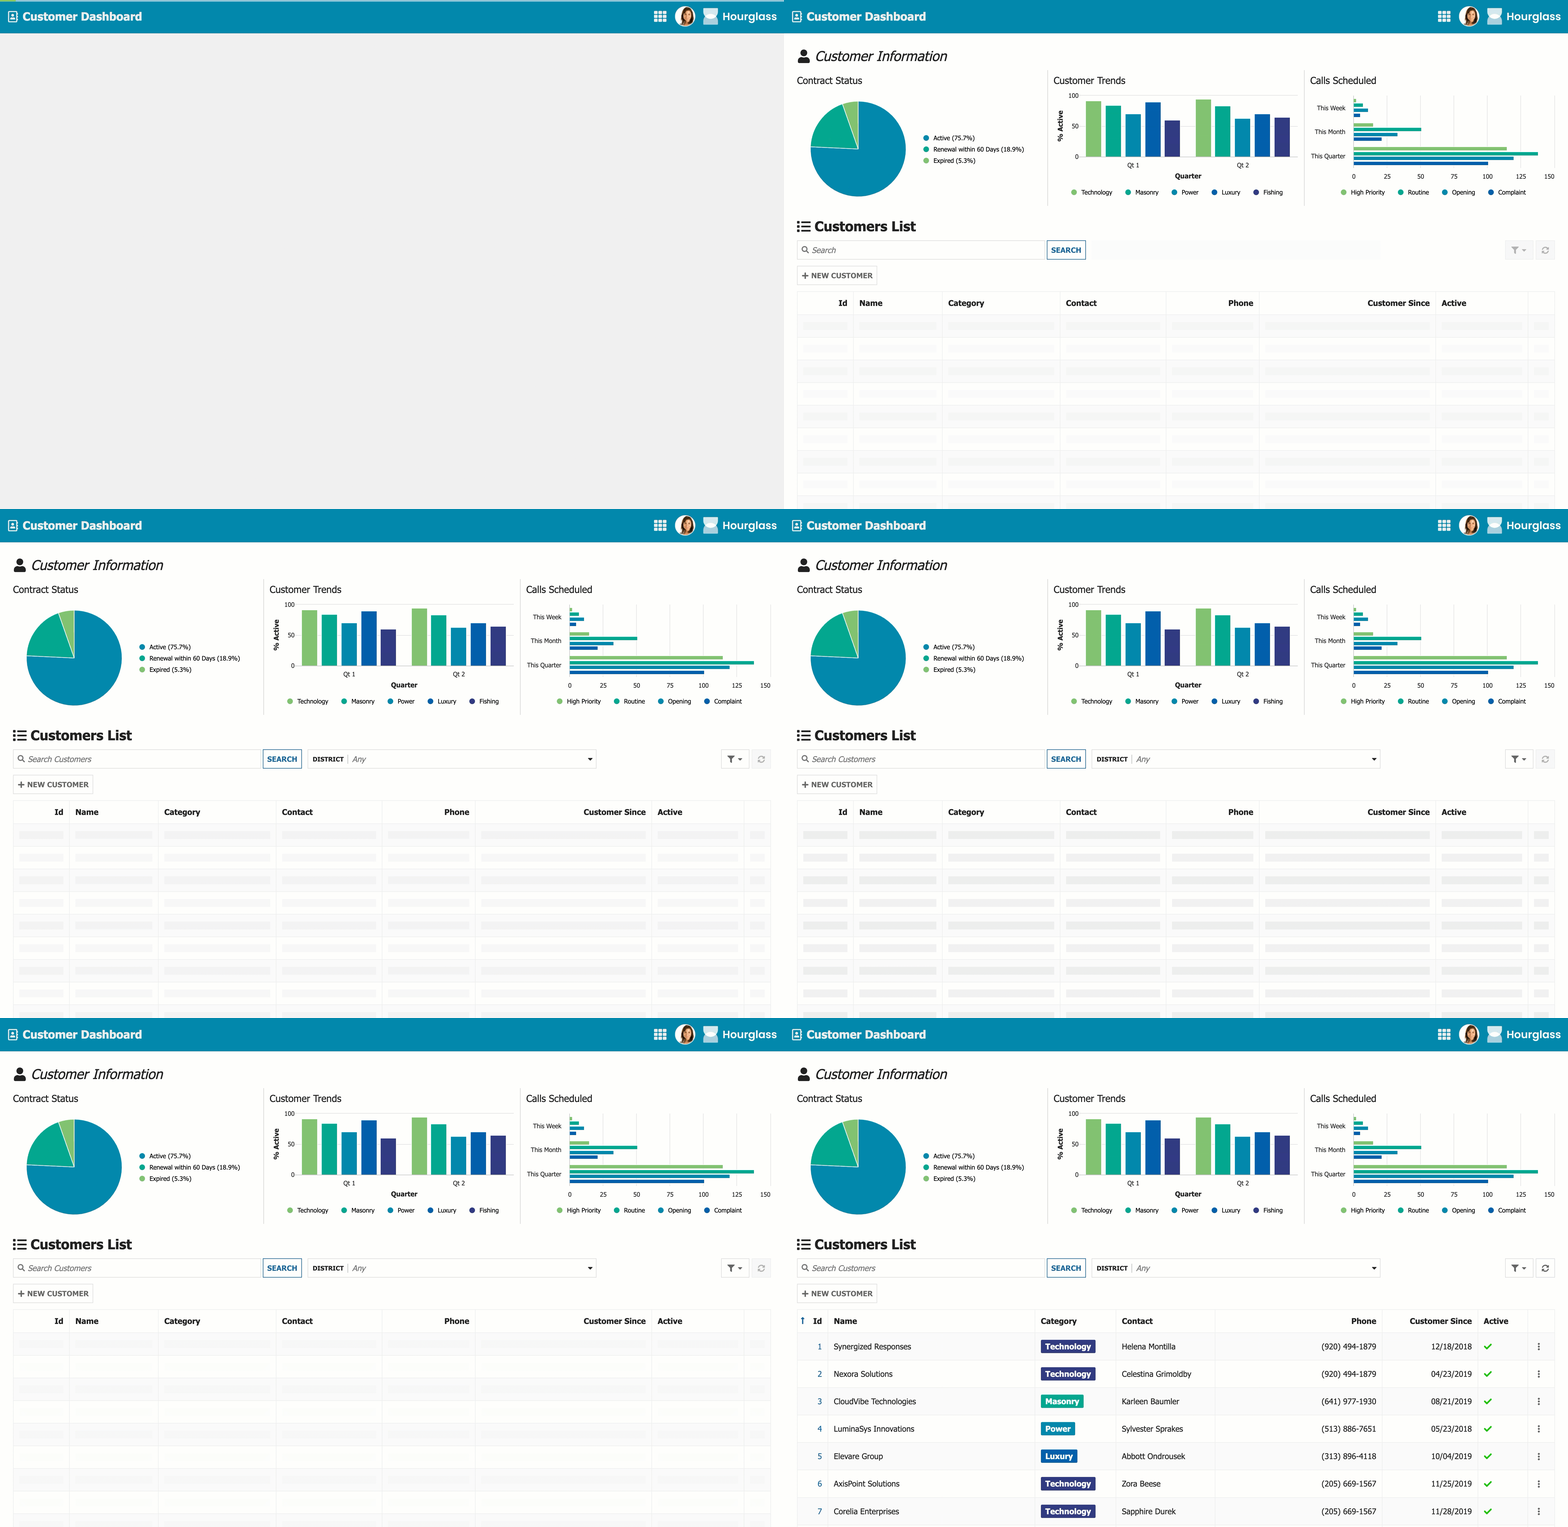
This page explains when and how to enable async loading and usage considerations for using async loading.
When to enable async loadingCopy link to clipboard
The loadDataAsync parameter is set to false by default on all read-only grids, charts, and KPIs so that you have the option of turning it on when it is the most beneficial for your users. This section details some basic guidelines for when to enable async loading on these components.
Note: This guidance does not apply to offline interfaces or portals. Async loading is not compatible with those types of interfaces.
Enable it when the grid, chart, or KPI is the slowest component on the interfaceCopy link to clipboard
Async loading is most beneficial when your read-only grid, chart, or KPI is the slowest component on the interface to load. You can determine this by checking the Performance tab in the interface object.
If you enable this on a grid, chart, or KPI that is faster than other components to load, it could unnecessarily delay the loading of the async component. Therefore, we recommend the following general steps to determine if you should enable it.
Keep in mind that development versus production environments will likely have different performance results. If your data is sourced from the database or modern records, see Best Practices: Database Volume Testing on Appian MAX for some ideas of how to mimic production-level data in your development or staging environment.
To determine if it is the slowest loading component:
- If the interface with the grid, chart, or KPI is already in production, record how long it takes the interface to load in the production environment, ideally in milliseconds.
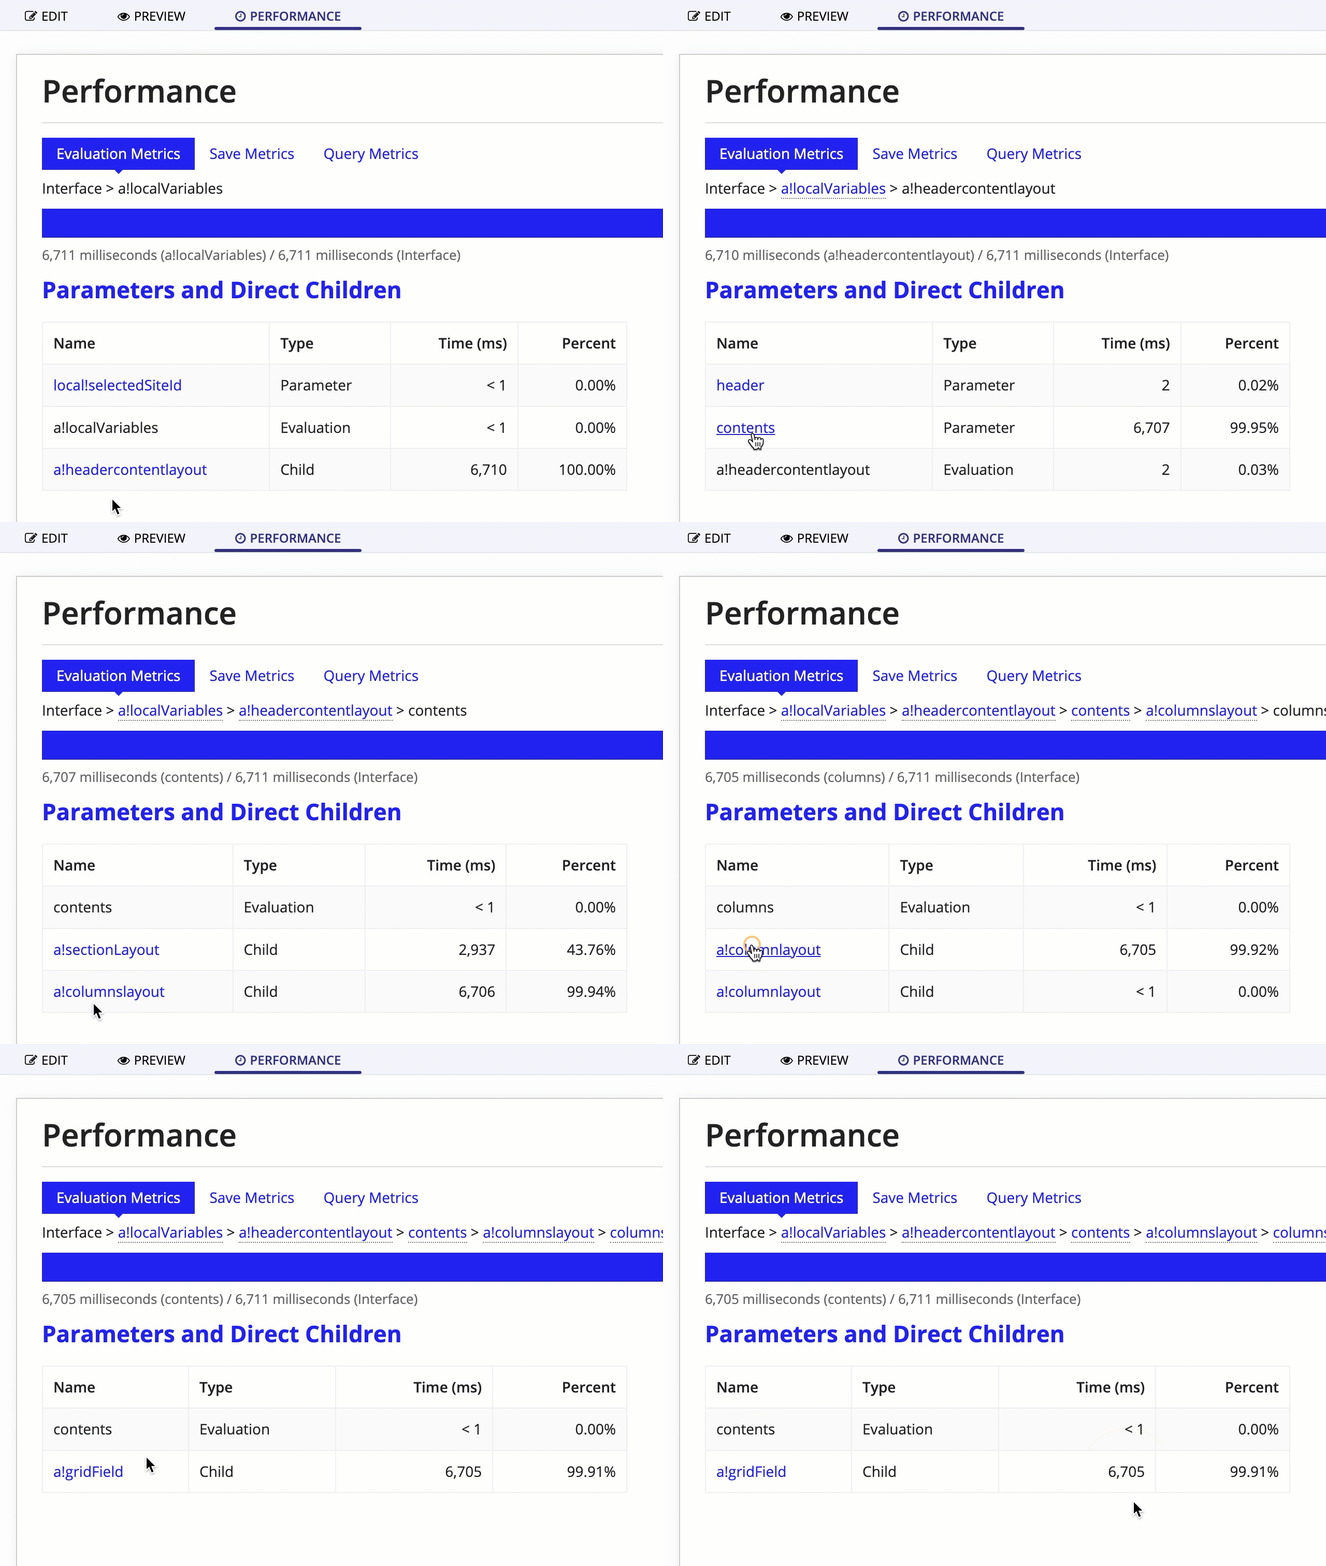
- In the interface object in your development or staging environment, click the PERFORMANCE tab, then click TEST to perform an initial evaluation. The performance details display.
-
Under Parameters and Direct Children, drill down to find the grid, chart, or KPI component.
Tip: You may need to click into a layout like
a!headerContentLayout()to find the component you are looking for. You may also need to navigate through several other components, such as column or side-by-side layouts. - Check the value in the Time (ms) column and verify that it is the slowest loading component on the interface.
- If it is the slowest component, set the loadDataAsync parameter for the grid, chart, or KPI to
trueand click SAVE CHANGES. - After the changes are live, measure again how long the interface takes to load in the production environment. Verify that the rest of the interface loads faster than it did in the initial timing.
Enable it when the grid, chart, or KPI is the only component on the interfaceCopy link to clipboard
It can also be beneficial to enable async loading for interfaces that only contain read-only grids, charts, or KPIs, if they take more than one second to load. That way users will see the placeholder skeleton while the data is loading, instead of just the loading bar at the top of the interface.
This can provide a better user experience because the placeholder skeleton prevents users from thinking the site is broken and makes the wait feel shorter.
How to enable async loadingCopy link to clipboard
To make sure async loading works as intended, you need to make sure the data is set up correctly so that it can load independently from the rest of the interface. To do this, you must query the data directly in the data parameter of the read-only grid, chart, or KPI component. You cannot query the data in a local variable elsewhere in the interface.
To enable async loading:
-
Make sure the data is being loaded in the data parameter of the grid, chart, or KPI component, not a local variable elsewhere in the interface. For example:
1
2
3
4
5
6
7
8
9
10
11
12
13
14
15
16
17
18
19
{
  a!gridField(
    labelPosition: "COLLAPSED",
    data: 'recordType!{SYSTEM_RECORD_TYPE_USER}User',
    loadDataAsync: true,
    columns: {
      a!gridColumn(
        label: "First And Last Name",
        sortField: 'recordType!{SYSTEM_RECORD_TYPE_USER}User.fields.{SYSTEM_RECORD_TYPE_USER_FIELD_firstAndLastName}firstAndLastName',
        value: fv!row['recordType!{SYSTEM_RECORD_TYPE_USER}User.fields.{SYSTEM_RECORD_TYPE_USER_FIELD_firstAndLastName}firstAndLastName']
      ),
      a!gridColumn(
        label: "Title",
        sortField: 'recordType!{SYSTEM_RECORD_TYPE_USER}User.fields.{SYSTEM_RECORD_TYPE_USER_FIELD_title}title',
        value: fv!row['recordType!{SYSTEM_RECORD_TYPE_USER}User.fields.{SYSTEM_RECORD_TYPE_USER_FIELD_title}title']
      )
    }
  )
}
Copy -
Set the loadDataAsync parameter to
true.
How async loading worksCopy link to clipboard
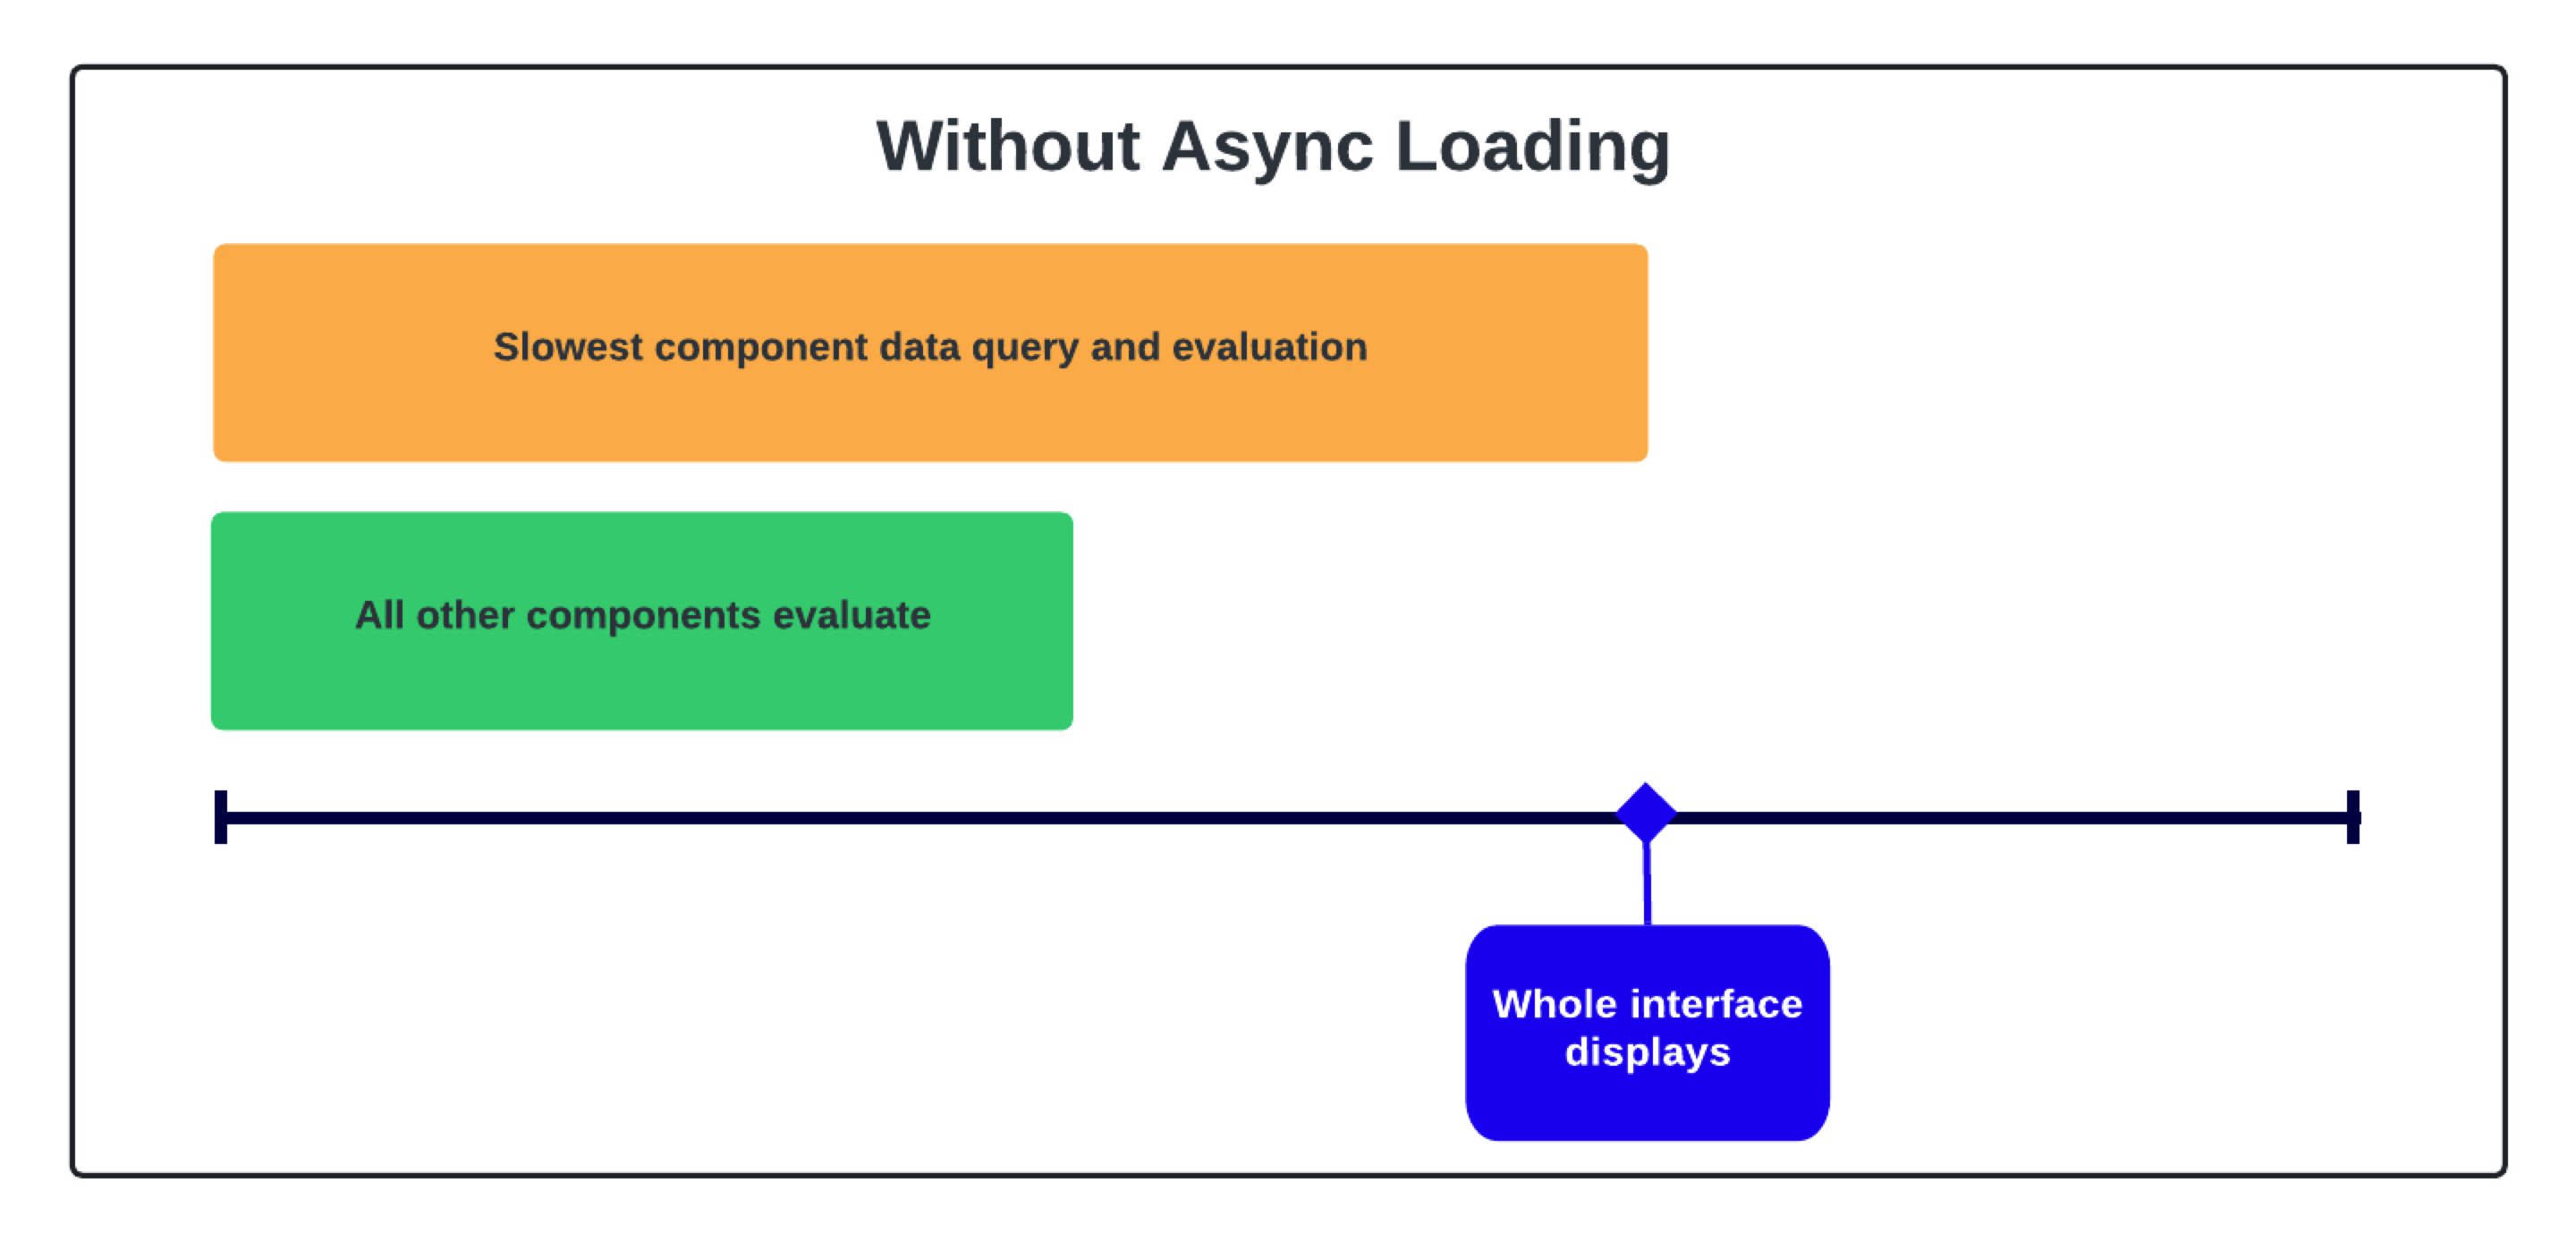
Normally, when an interface evaluates, it must wait for all of the components and data queries to load before it can display the whole interface, as in the following diagram.
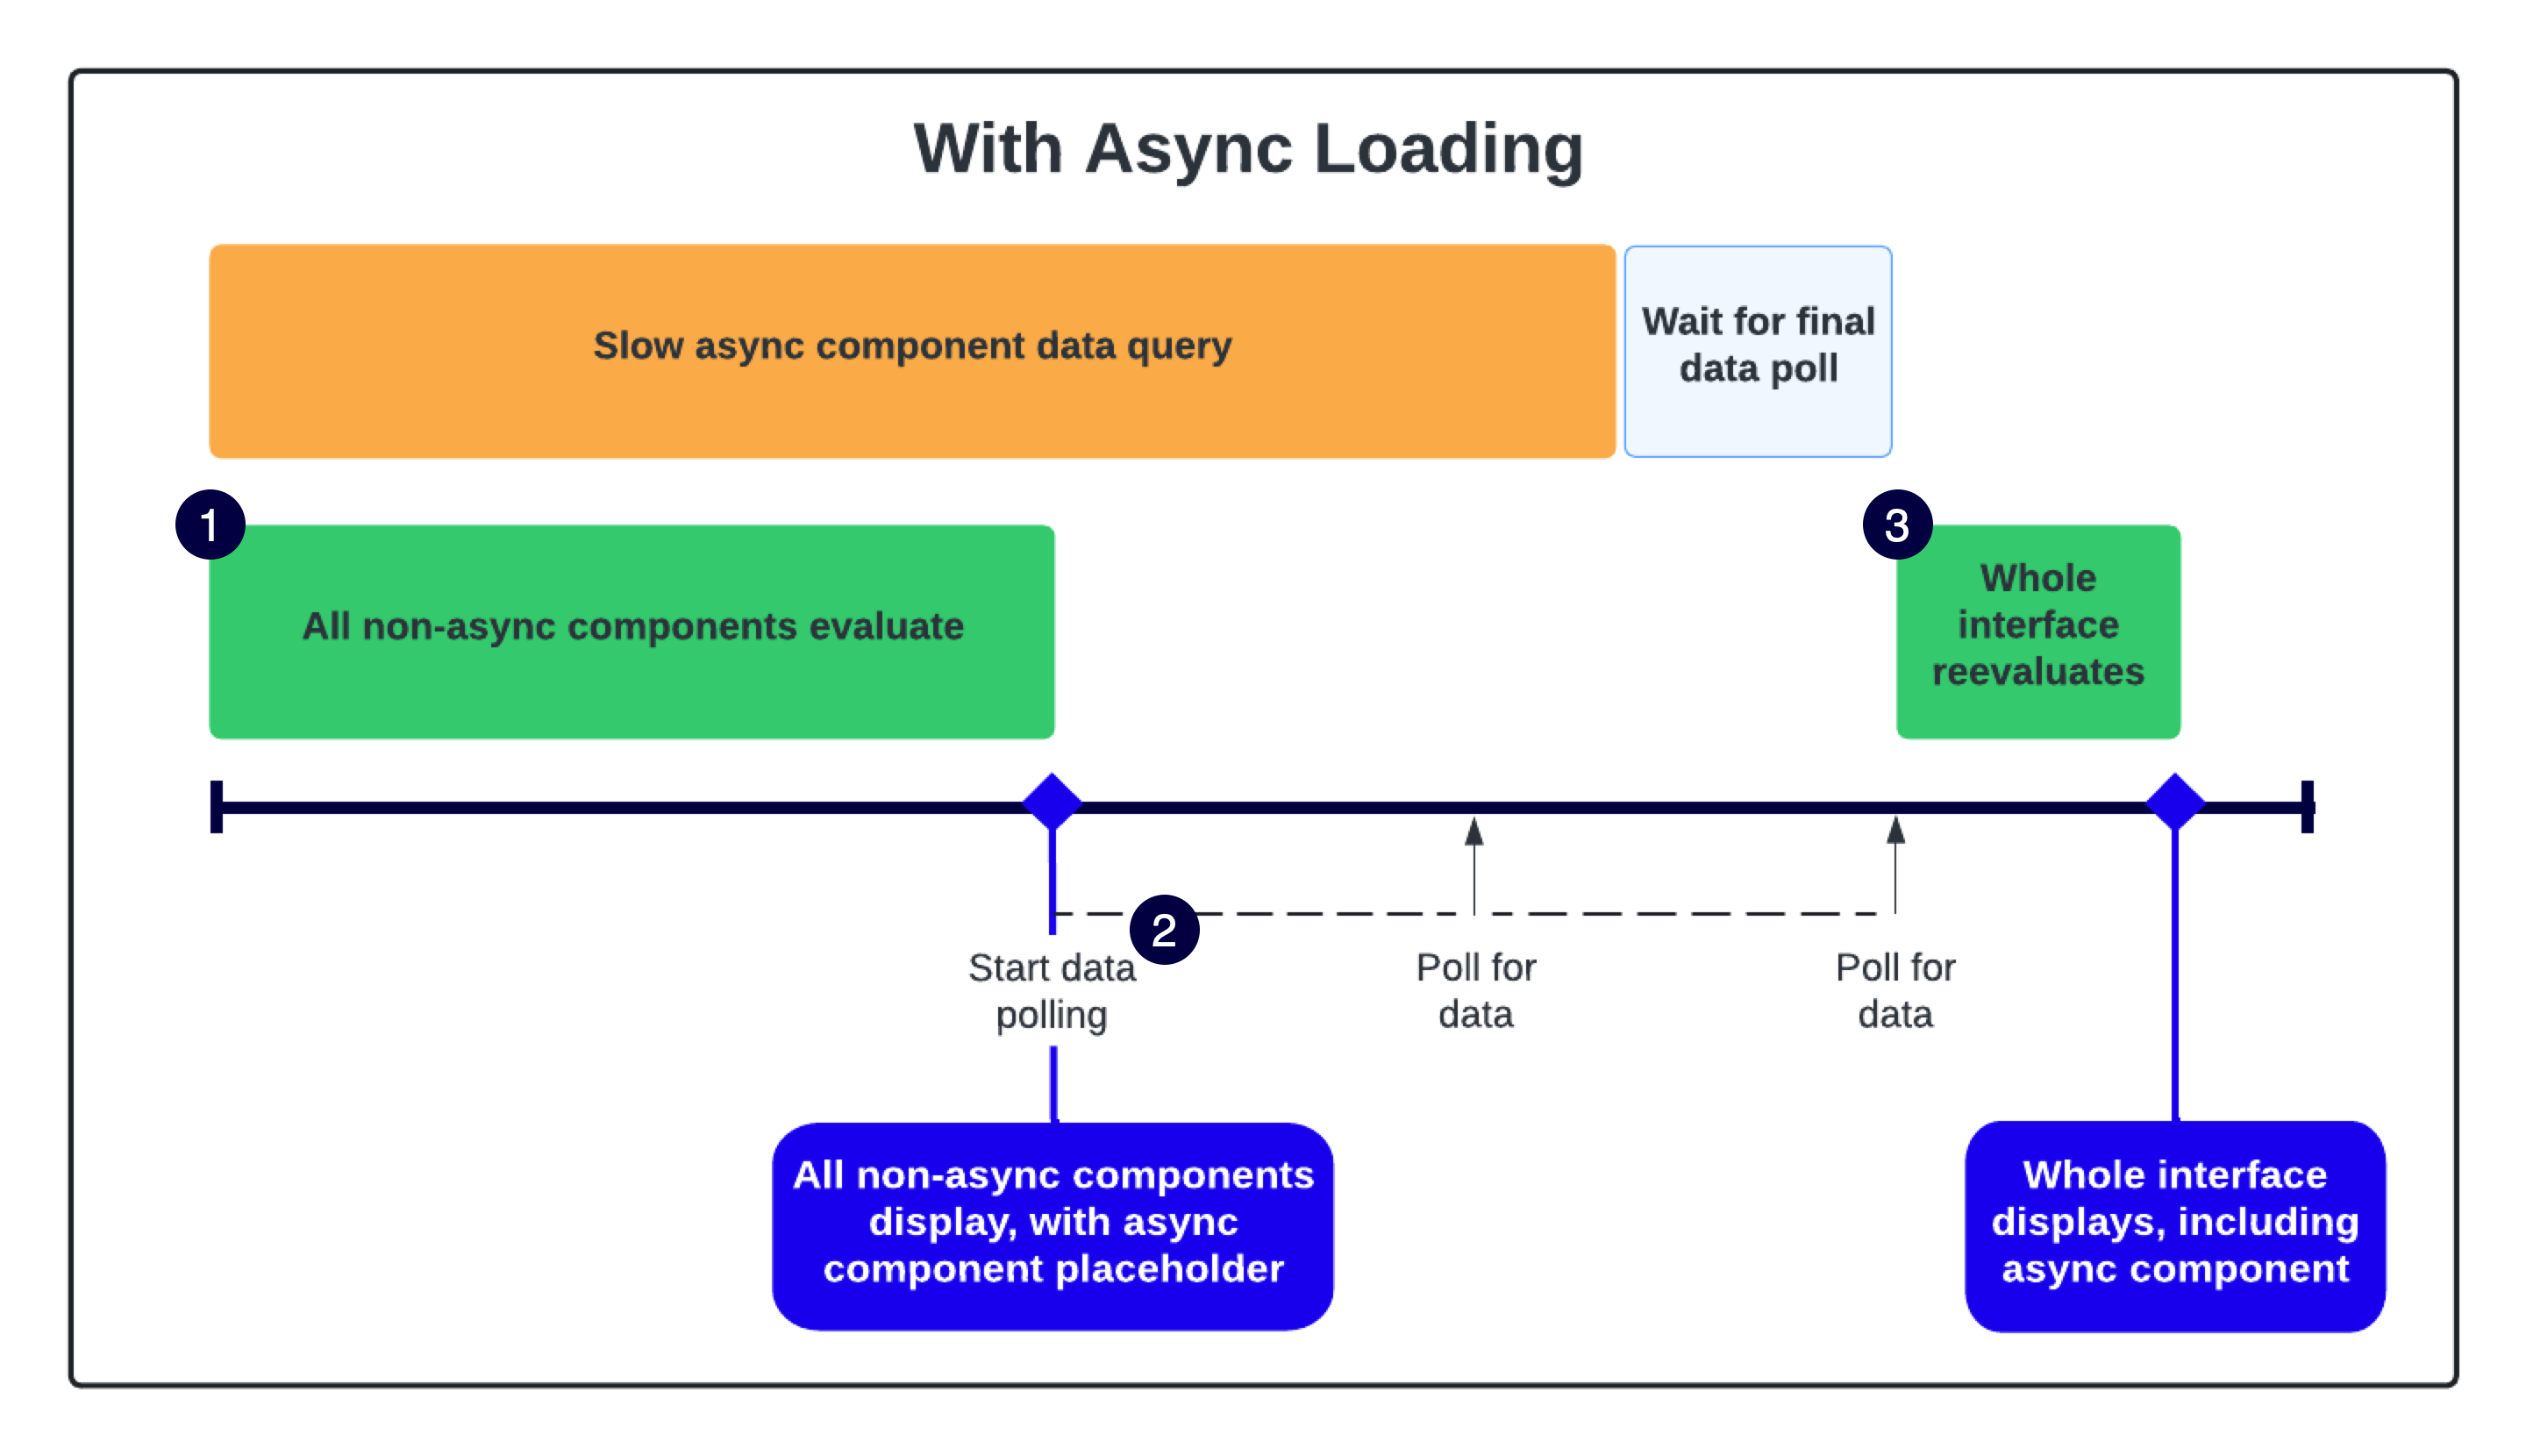
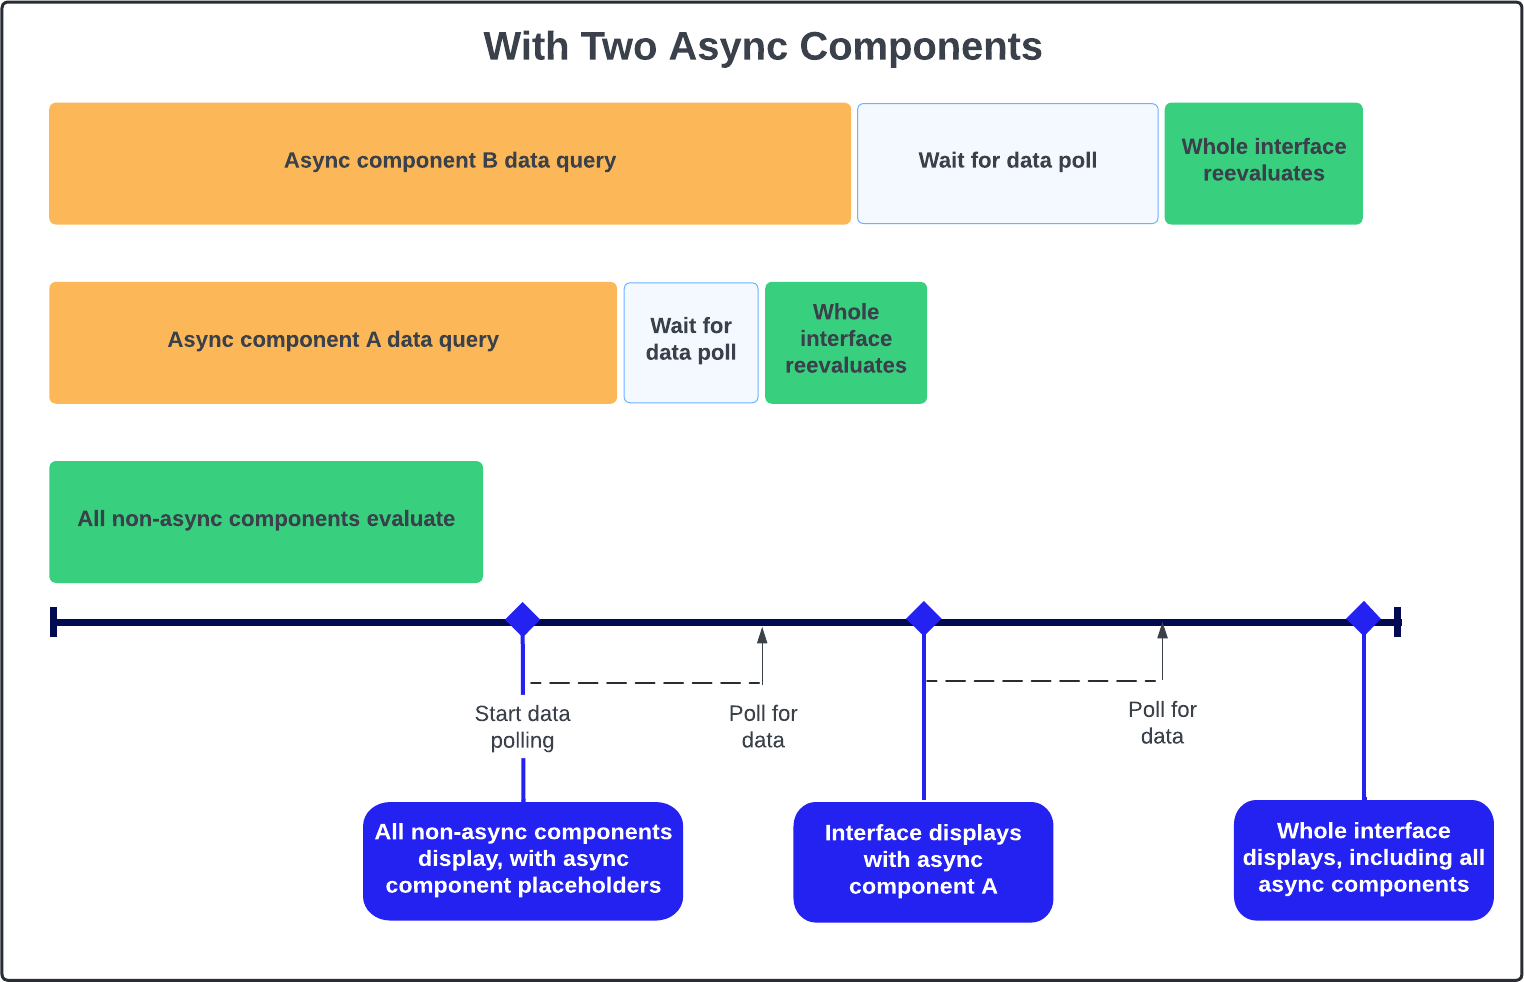
Async loading allows the rest of the interface to display while it waits for the data to load in the background using a technique called polling, which works like this:
- All non-async components evaluate. The non-async components load as normal and the async component displays a placeholder skeleton.
- After the initial evaluation, every 625 ms the interface sends a poll request to check if the async component data query is done.
- After the data query is complete, the whole interface reevaluates on the next data poll and all components display, including the async component.
Tip: For records-powered grids, the user filters load async as well as the data in the grid.
If you have more than one async component, they will load independently from each other. After one async component displays, the data polling restarts for the remaining async components. This continues until all the async components are finishing loading.

