Tip: Interface patterns give you an opportunity to explore different interface designs. Be sure to check out How to Adapt a Pattern for Your Application.
GoalCopy link to clipboard
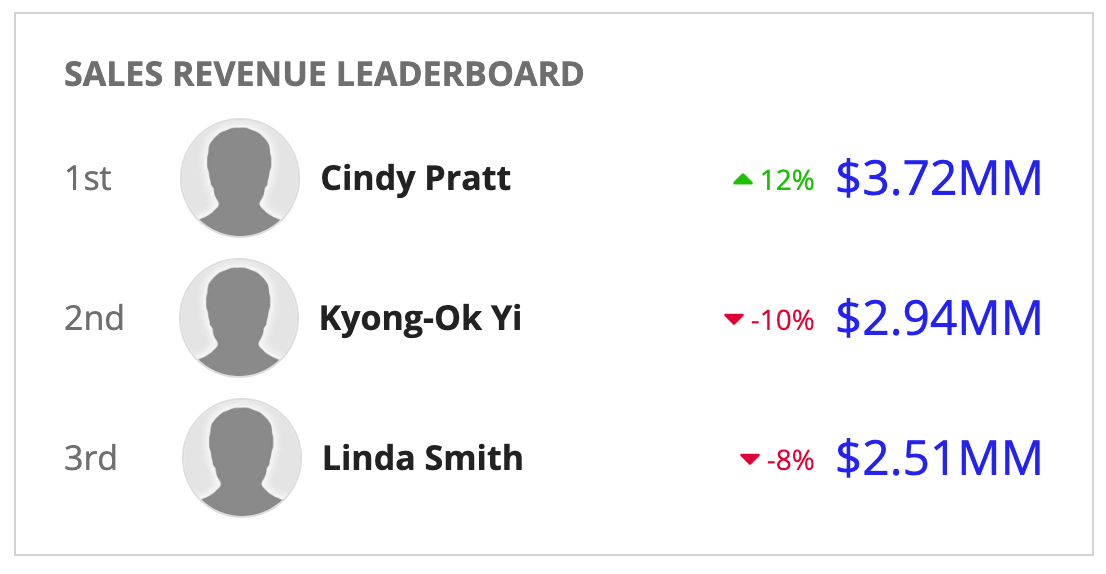
Use the leaderboard pattern to show a selection of your data in an easy to read ranked display. This page explains how you can use this pattern in your interface, and walks through the design structure in detail.

Design structureCopy link to clipboard
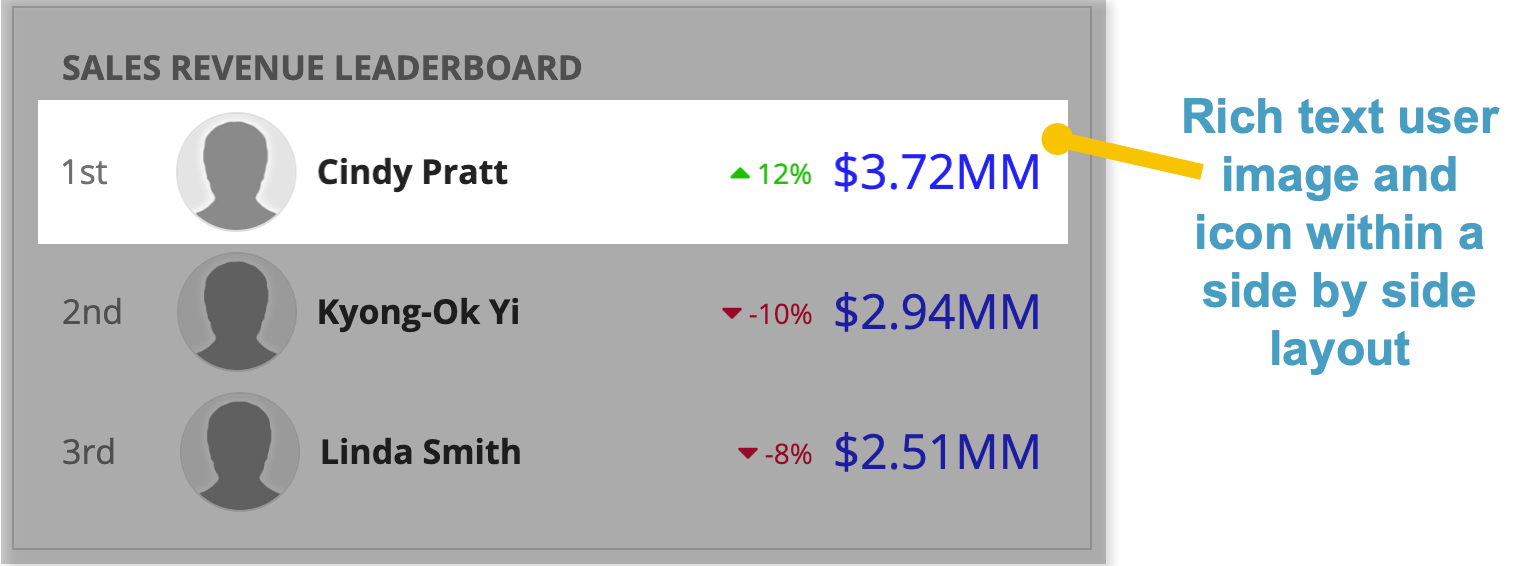
The main components in this pattern are card layouts, side by side layouts, rich text, and user images. This pattern shows the information, sales revenue, and rate of revenue increase or decrease for each sales leader.
The image below displays how the pattern looks on a blank interface with callouts for the main components. You can examine the entire expression or jump down to the subsections below with referenced line numbers to see a detailed breakdown of the main components.

Pattern expressionCopy link to clipboard
When you drag and drop the leaderboard pattern onto your interface, 132 lines of expressions will be added to the section where you dragged it.
1
2
3
4
5
6
7
8
9
10
11
12
13
14
15
16
17
18
19
20
21
22
23
24
25
26
27
28
29
30
31
32
33
34
35
36
37
38
39
40
41
42
43
44
45
46
47
48
49
50
51
52
53
54
55
56
57
58
59
60
61
62
63
64
65
66
67
68
69
70
71
72
73
74
75
76
77
78
79
80
81
82
83
84
85
86
87
88
89
90
91
92
93
94
95
96
97
98
99
100
101
102
103
104
105
106
107
108
109
110
111
112
113
114
115
116
117
118
119
120
121
122
123
124
125
126
127
128
129
130
131
132
{
  a!localvariables(
    local!salesLeaders: {
      a!map(rank: "1st", name: "Cindy Pratt", revenue: "$3.72MM", percentChange: 12),
      a!map(rank: "2nd", name: "Kyong-Ok Yi", revenue: "$2.94MM", percentChange: -10),
      a!map(rank: "3rd", name: "Linda Smith", revenue: "$2.51MM", percentChange: -8)
    },
    {
      a!columnsLayout(
        columns: {
          a!columnLayout(
            contents: {
              a!cardLayout(
                contents: {
                  a!sectionLayout(
                    contents: {
                      a!richTextDisplayField(
                        labelPosition: "COLLAPSED",
                        value: {
                          a!richTextItem(
                            text: upper("Sales Revenue Leaderboard"),
                            color: "#6f6f6f",
                            size: "MEDIUM",
                            style: "STRONG"
                          )
                        }
                      ),
                      /* Displays a row for each sales leader */
                      a!forEach(
                        items: local!salesLeaders,
                        expression: a!sideBySideLayout(
                          items: {
                            a!sideBySideItem(
                              item: a!richTextDisplayField(
                                labelPosition: "COLLAPSED",
                                value: {
                                  a!richTextItem(
                                    text: fv!item.rank,
                                    color: "#6f6f6f",
                                    size: "MEDIUM"
                                  )
                                }
                              ),
                              width: "2X"
                            ),
                            a!sideBySideItem(
                              item: a!imageField(
                                labelPosition: "COLLAPSED",
                                images: a!userImage(),
                                size: if(
                                  a!isPageWidth("PHONE"),
                                  "TINY",
                                  "SMALL"
                                ),
                                isThumbnail: false,
                                style: "AVATAR"
                              ),
                              width: "MINIMIZE"
                            ),
                            a!sideBySideItem(
                              item: a!richTextDisplayField(
                                labelPosition: "COLLAPSED",
                                value: {
                                  a!richTextItem(
                                    text: fv!item.name,
                                    size: "MEDIUM",
                                    style: "STRONG"
                                  )
                                }
                              ),
                              width: if(
                                a!isPageWidth("PHONE"),
                                "5X",
                                "8X"
                              )
                            ),
                            a!sideBySideItem(
                              item: a!richTextDisplayField(
                                labelPosition: "COLLAPSED",
                                value: {
                                  /* Displays an icon depending on if    *
                                   * the change was positive or negative */
                                  a!richTextIcon(
                                    icon: if(fv!item.percentChange > 0, "caret-up", "caret-down"),
                                    caption: "Percent change in sales revenue",
                                    color: if(fv!item.percentChange > 0, "POSITIVE", "NEGATIVE"),
                                    size: "MEDIUM"
                                  ),
                                  a!richTextItem(
                                    text: fv!item.percentChange & "%",
                                    color: if(fv!item.percentChange > 0, "POSITIVE", "NEGATIVE")
                                  )
                                },
                                align: "LEFT"
                              ),
                              width: "MINIMIZE"
                            ),
                            a!sideBySideItem(
                              item: a!richTextDisplayField(
                                labelPosition: "COLLAPSED",
                                value: {
                                  a!richTextItem(
                                    text: fv!item.revenue,
                                    color: "ACCENT",
                                    size: "MEDIUM_PLUS"
                                  )
                                },
                                align: "RIGHT"
                              ),
                              width: "MINIMIZE"
                            )
                          },
                          alignvertical: "MIDDLE"
                        )
                      )
                    },
                    marginBelow: "NONE"
                  )
                },
                height: "AUTO",
                style: "NONE",
                padding: "STANDARD",
                marginBelow: "STANDARD"
              )
            },
            width: "MEDIUM_PLUS"
          )
        }
      )
    }
  )
}
Copy
[Line 1-7] Define local variablesCopy link to clipboard
These local variables provide the name, ranking, and sales revenue information for each sales leader.
1
2
3
4
5
6
7
{
  a!localvariables(
    local!salesLeaders: {
      a!map(rank: "1st", name: "Cindy Pratt", revenue: "$3.72MM", percentChange: 12),
      a!map(rank: "2nd", name: "Kyong-Ok Yi", revenue: "$2.94MM", percentChange: -10),
      a!map(rank: "3rd", name: "Linda Smith", revenue: "$2.51MM", percentChange: -8)
    },
Copy
[Line 29-115] Define a row for each sales leaderCopy link to clipboard
This section brings together all of the components that make up each row of the leaderboard and uses a!forEach() to loop over the same row definition to display the information for each leader. Each row is made up of rich text items, rich text icons, and user image components.
Lines 77-97 show how to create styling that can change based on the information for each leader. Depending on whether the leader's sales revenue is up or down, the if() statements conditionally apply positive or negative styling to the rich text items and icons.
29
30
31
32
33
34
35
36
37
38
39
40
41
42
43
44
45
46
47
48
49
50
51
52
53
54
55
56
57
58
59
60
61
62
63
64
65
66
67
68
69
70
71
72
73
74
75
76
77
78
79
80
81
82
83
84
85
86
87
88
89
90
91
92
93
94
95
96
97
98
99
100
101
102
103
104
105
106
107
108
109
110
111
112
113
114
115
                   a!forEach(
                        items: local!salesLeaders,
                        expression: a!sideBySideLayout(
                          items: {
                            a!sideBySideItem(
                              item: a!richTextDisplayField(
                                labelPosition: "COLLAPSED",
                                value: {
                                  a!richTextItem(
                                    text: fv!item.rank,
                                    color: "#6f6f6f",
                                    size: "MEDIUM"
                                  )
                                }
                              ),
                              width: "2X"
                            ),
                            a!sideBySideItem(
                              item: a!imageField(
                                labelPosition: "COLLAPSED",
                                images: a!userImage(),
                                size: if(
                                  a!isPageWidth("PHONE"),
                                  "TINY",
                                  "SMALL"
                                ),
                                isThumbnail: false,
                                style: "AVATAR"
                              ),
                              width: "MINIMIZE"
                            ),
                            a!sideBySideItem(
                              item: a!richTextDisplayField(
                                labelPosition: "COLLAPSED",
                                value: {
                                  a!richTextItem(
                                    text: fv!item.name,
                                    size: "MEDIUM",
                                    style: "STRONG"
                                  )
                                }
                              ),
                              width: if(
                                a!isPageWidth("PHONE"),
                                "5X",
                                "8X"
                              )
                            ),
                            a!sideBySideItem(
                              item: a!richTextDisplayField(
                                labelPosition: "COLLAPSED",
                                value: {
                                  /* Displays an icon depending on if    *
                                   * the change was positive or negative */
                                  a!richTextIcon(
                                    icon: if(fv!item.percentChange > 0, "caret-up", "caret-down"),
                                    caption: "Percent change in sales revenue",
                                    color: if(fv!item.percentChange > 0, "POSITIVE", "NEGATIVE"),
                                    size: "MEDIUM"
                                  ),
                                  a!richTextItem(
                                    text: fv!item.percentChange & "%",
                                    color: if(fv!item.percentChange > 0, "POSITIVE", "NEGATIVE")
                                  )
                                },
                                align: "LEFT"
                              ),
                              width: "MINIMIZE"
                            ),
                            a!sideBySideItem(
                              item: a!richTextDisplayField(
                                labelPosition: "COLLAPSED",
                                value: {
                                  a!richTextItem(
                                    text: fv!item.revenue,
                                    color: "ACCENT",
                                    size: "MEDIUM_PLUS"
                                  )
                                },
                                align: "RIGHT"
                              ),
                              width: "MINIMIZE"
                            )
                          },
                          alignvertical: "MIDDLE"
                        )
                      )
Copy
