OverviewCopy link to clipboard
Processes are an integral part of your applications, so it's important that they execute efficiently so users can add, update, delete, or view the information they need. Using two out-of-the-box process reports, you can easily evaluate the design performance of your process model by reviewing a historical execution report.
These reports provide metrics on past performance of each node in a process model. These metrics can often serve as barometers when it comes to identifying bottlenecks in a process model and can be used to fine tune a process model for optimal performance.
The following page describes how to access these reports and view their contents.
Prebuilt process optimization reportsCopy link to clipboard
There are two out-of-the-box process reports that can analyze the performance of your process model:
- Default Process Model Optimization Metrics: Displays the average lag time and average completion time of the tasks in a process.
- Default Process Optimization Metrics: Displays the actual lag time and actual completion time of the tasks in a process.
View the process optimization reportsCopy link to clipboard
To view either of these reports:
- In the Objects view, search for
Default Process Model Optimization MetricsorDefault Process Optimization Metrics. - Select the report.
- In the Choose Process Models dialog, select a process to analyze. You can only select a process model in which you have at least Viewer permission.
-
Click OK. Each report includes three columns of data:
Report Columns Default Process Model Optimization Metrics
- Name: The task name.
- Avg Lag: Average delay between assignment and acceptance of a task.
- Avg Completion: Average elapsed time between assignment and completion of a task.
Default Process Optimization Metrics - Name: The task name.
- Act Lag: Absolute delay between assignment and acceptance of a task.
- Act Completion: Absolute elapsed time between assignment and completion of a task.
Edit the process optimization reportsCopy link to clipboard
By default, each report will contain three columns and group the data by the node name. You can further customize your report by adding new fields, removing existing ones, or changing the name of your report.
To customize either of these reports:
- In the Appian Process Report Designer, click the Edit.
- In the Report Options dialog, go to the Data tab to edit existing data or add new columns.
- Click SAVE.
-
In the report, click to save your changes.
Note: Only system administrators can save the report template. Saving a report template results in the change being applied system-wide.
Learn more about Editing a Report.
View lag and completion times in a processCopy link to clipboard
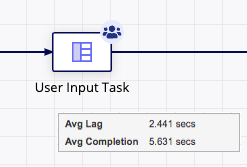
When viewing a process model, all columns configured through the Default Process Model Optimization Metrics report appear as a metric for each node in the process model.
When editing a running process, all columns configured for both the Default Process Model Optimization Metrics and the Default Process Optimization Metrics reports are displayed as metrics for each node in the process.
A maximum of 20 metrics can be displayed for a node on the designer canvas. If more than 20 columns are configured, only the first 20 columns appear in the modeler.
To view the process metrics:
- Open a process model.
- In the toolbar, click View Metrics
 .
.

All columns configured in the report are displayed in the same order in which they appear in the report. Each column of data is aggregated. If no data is available for a particular metric, n/a appears next to the metric for the given node. All formatting applied to the data in the report is preserved when it is displayed as metric in the Process Modeler.
