| Process Mining is deprecated with Appian 24.2 and will no longer be available in an upcoming release. Instead, we encourage customers to use Process HQ to explore and analyze business processes and data. |
The Insights page lets you dive deeper into your processes to uncover trends and patterns that help you resolve problems in your processes. You can choose between two analysis modes: Root Cause and Distributions.
Choose an analysis modeCopy link to clipboard
The Insights page lets you investigate the discovered process, but where do you start? That depends on what type of information you're interested in:
- Root cause analysis is useful for locating process errors and uncovering their underlying causes. If the underlying cause is found to affect other areas of the process, you might also find it useful to apply the same remedies to additional areas.
- Distribution analysis is useful for spotting trends among multiple dimensions within your data.
Root cause analysisCopy link to clipboard
Root cause analysis helps you uncover the source of a problem so you can resolve it. Appian Process Mining uses a mixture of cluster and decision tree algorithms to automatically perform root cause analysis on your data.
This technique splits the available event log with respect to a deviation, case duration, or follower relationship. Depending on the option you select, one part of the event log contains the deviation, case duration, or follower relation, and the other part does not. Root cause analysis is able to uncover frequency of attribute values that correlate with the source of the problem.
Root cause analysis answers questions about your processes like:
- Why did an activity get skipped?
- Why did an activity repeat?
- Why did an activity occur out of order?
- Why did a case take a certain amount of time?
- Why did an activity happen after another?
Note: Filters apply to root cause analysis; therefore, they limit the data that is included in the analysis. When applied intentionally, filters are useful to focus your analysis. Before starting, review your current filters to ensure you're analyzing the complete set of data you're interested in.
When you first go to the Root Cause page, you must first choose whether you want to perform root cause analysis on a PROCESS DEVIATION, CASE DURATION, or DIRECT FOLLOWER:
- Process deviation: A change to an activity compared to a target model that negatively impacts the normal execution of a process.
- Case duration: The amount of time a case or single occurrence of a process takes to complete from the first activity through the last activity.
- Direct follower: The relationship between two activities.

Process deviationCopy link to clipboard
You can perform root cause analysis on any deviation that Process Mining automatically identified. Deviations are only available if a target model is connected and multiple variant groups are displayed.
To perform root cause analysis on a deviation:
- Go to the Insights page.
- Click PROCESS DEVIATION.
- Select the deviation you want to analyze.
- Click ROOT CAUSE.
-
Configure the following options:
- Remove current filter settings: Clears any filters currently applied to the data.
- Configure attributes used: Choose to exclude any attributes from the analysis.
- Excluded Attributes: Select the attributes you want to exclude.
- Configure parameters used: Change values for the follow options:
- Accuracy Threshold: Stops the rule discovery if the accuracy of the rules drops below the threshold.
- Maximum Description Length Growth: Stops the rule discovery if adding new rules will increase the minimum description length of the current rule set by the amount specified.
- Maximum Iterations: Stops the rule discovery if the limit for the number of rule growing and pruning iterations has been reached.
- Timeout (ms): Stops the rule discovery if it takes longer than the timeout value in milliseconds.
- Number of Binary Scans: Perform a binary search over the range of the numeric attribute up to a depth lower than the threshold when growing the rules.
- Maximum Number of Attribute Values: Consider only categorical attributes that have less attribute values than the threshold when growing the rules.
- Number of Folds: Defines how the data for the rule creation is split, with folds - 1 part of the data for the growing set and 1 part for the pruning set.
- Number of Optimization Passes: Defines the number of iterations for the rule optimization phase of the algorithm.
- Covered Fraction Threshold: Defines a minimum for the fraction of correctly classified positive instances by all rules.
- Description Length Redundancy: Defines an adjustment for possible redundancy in the attributes when computing the description length of rules.
- Click RUN.
Tip: You can also perform root cause analysis directly from the Deviations page.
Once the automated root cause analysis finishes, a confirmation message displays at the bottom of the screen. Click this message to go to your results. The analysis runs in the background, so you can continue to use Process Mining while it completes.
Case durationCopy link to clipboard
You can perform root cause analysis on cases with a duration that fall within a threshold you define. For example, on the Statistics page you may notice cases with specific durations that you want to analyze further. You can start a root cause analysis from here by clicking Filter or from the Insights page.
To perform root cause analysis on a case duration:
- Go to the Insights page.
- Click CASE DURATION.
- Select the Minimum duration for cases.
- Select the Maximum duration for cases.
- Optionally, click FILTER to create a case duration filter based on the thresholds you configured when you want to focus your analysis further. This exits root cause analysis.
- Click ROOT CAUSE.
-
Configure the following options:
- Remove current filter settings: Clears any filters currently applied to the data.
- Configure attributes used: Choose to exclude any attributes from the analysis.
- Excluded Attributes: Select the attributes you want to exclude.
- Configure parameters used: Change values for the follow options:
- Accuracy Threshold: Stops the rule discovery if the accuracy of the rules drops below the threshold.
- Maximum Description Length Growth: Stops the rule discovery if adding new rules will increase the minimum description length of the current rule set by the amount specified.
- Maximum Iterations: Stops the rule discovery if the limit for the number of rule growing and pruning iterations has been reached.
- Timeout (ms): Stops the rule discovery if it takes longer than the timeout value in milliseconds.
- Number of Binary Scans: Perform a binary search over the range of the numeric attribute up to a depth lower than the threshold when growing the rules.
- Maximum Number of Attribute Values: Consider only categorical attributes that have less attribute values than the threshold when growing the rules.
- Number of Folds: Defines how the data for the rule creation is split, with folds - 1 part of the data for the growing set and 1 part for the pruning set.
- Number of Optimization Passes: Defines the number of iterations for the rule optimization phase of the algorithm.
- Covered Fraction Threshold: Defines a minimum for the fraction of correctly classified positive instances by all rules.
- Description Length Redundancy: Defines an adjustment for possible redundancy in the attributes when computing the description length of rules.
- Click RUN.
Once the automated root cause analysis finishes, a confirmation message displays at the bottom of the screen. Click this message to go to your results. The analysis runs in the background, so you can continue to use Process Mining while it completes.
Direct followerCopy link to clipboard
You can perform root cause analysis on activities that explicitly follow or don't follow each other.
For example, this is useful to determine why a loop is happening in your process or why an activity is occurring out of an expected order. You can also use Filter for duration to investigate why it is taking a long time to proceed from one activity to the next.
To perform root cause analysis on a follower relationship:
- Go to the Insights page.
- Click DIRECT FOLLOWER.
- Select the first activity in From.
- Select the next activity in To.
- Select the the relationship between the activities to analyze:
- Activities have to eventually follow each other: Follower relationship must exist between both activities, but there may be other activities between them.
- Activities have to directly follow each other: Follower relationship must exist between both activities, but no other activities may lie between them.
- Activities must never follow each other: There must be no follower relationship between the two activities, not even if there are other activities between them.
- Activities must never directly follow each other: There must be no follower relationship between the two activities.
- Optionally, click FILTER to create a filter based on the activity relationships you configured when you want to focus your analysis further. This exits root cause analysis.
- Click ROOT CAUSE.
-
Configure the following options:
- Remove current filter settings: Clears any filters currently applied to the data.
- Configure attributes used: Choose to exclude any attributes from the analysis.
- Excluded Attributes: Select the attributes you want to exclude.
- Configure parameters used: Change values for the follow options:
- Accuracy Threshold: Stops the rule discovery if the accuracy of the rules drops below the threshold.
- Maximum Description Length Growth: Stops the rule discovery if adding new rules will increase the minimum description length of the current rule set by the amount specified.
- Maximum Iterations: Stops the rule discovery if the limit for the number of rule growing and pruning iterations has been reached.
- Timeout (ms): Stops the rule discovery if it takes longer than the timeout value in milliseconds.
- Number of Binary Scans: Perform a binary search over the range of the numeric attribute up to a depth lower than the threshold when growing the rules.
- Maximum Number of Attribute Values: Consider only categorical attributes that have less attribute values than the threshold when growing the rules.
- Number of Folds: Defines how the data for the rule creation is split, with folds - 1 part of the data for the growing set and 1 part for the pruning set.
- Number of Optimization Passes: Defines the number of iterations for the rule optimization phase of the algorithm.
- Covered Fraction Threshold: Defines a minimum for the fraction of correctly classified positive instances by all rules.
- Description Length Redundancy: Defines an adjustment for possible redundancy in the attributes when computing the description length of rules.
- Click RUN.
Once the automated root cause analysis finishes, a confirmation message displays at the bottom of the screen. Click this message to go to your results. The analysis runs in the background, so you can continue to use Process Mining while it completes.
Results of the root cause analysisCopy link to clipboard
After automated root cause analysis runs successfully, the analysis results are displayed.
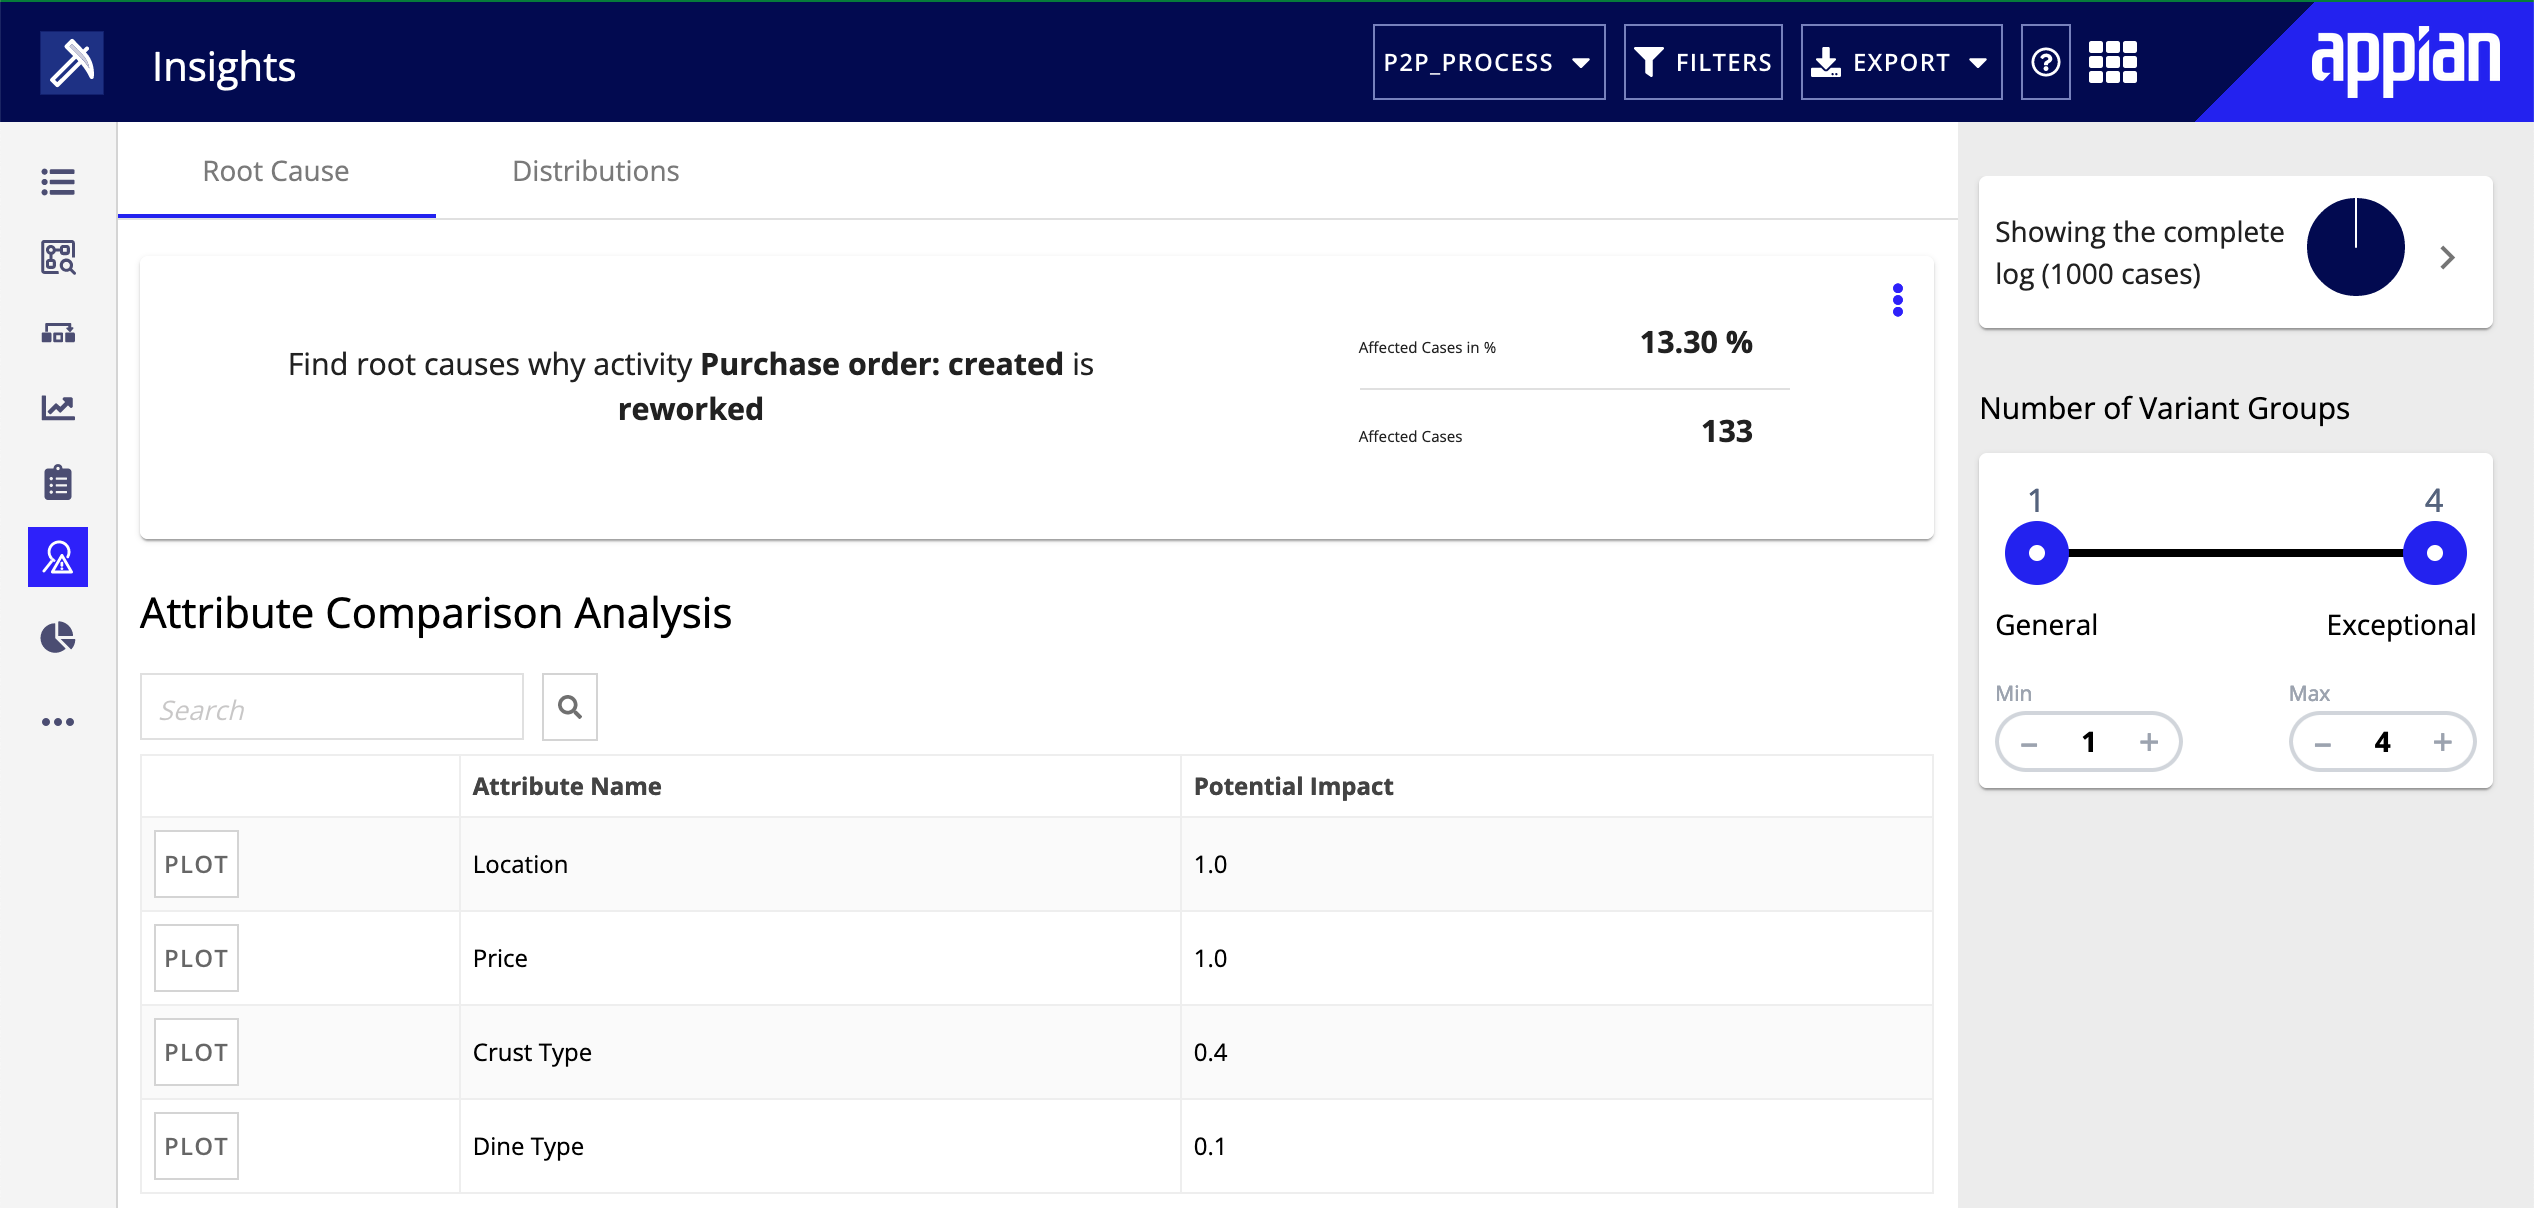
Root cause analysis results are divided into four sections:
- Overview
- Attribute Comparison Analysis
- Causal Rules for Affected Cases
- Most Important Categorical Attributes
OverviewCopy link to clipboard
The top of the results show you the parameters of your analysis request. For example, Find root causes for cases in which activity Vendor invoice: created is eventually followed by Vendor invoice: payment.

Click this statement to view the additional options you configured when starting the analysis. This creates a filter, and a corresponding filter card appears in the filter panel.
This section also displays the percentage of affected cases and the number of affected cases.
Click RE-RUN to run root cause analysis again.
Attribute Comparison AnalysisCopy link to clipboard
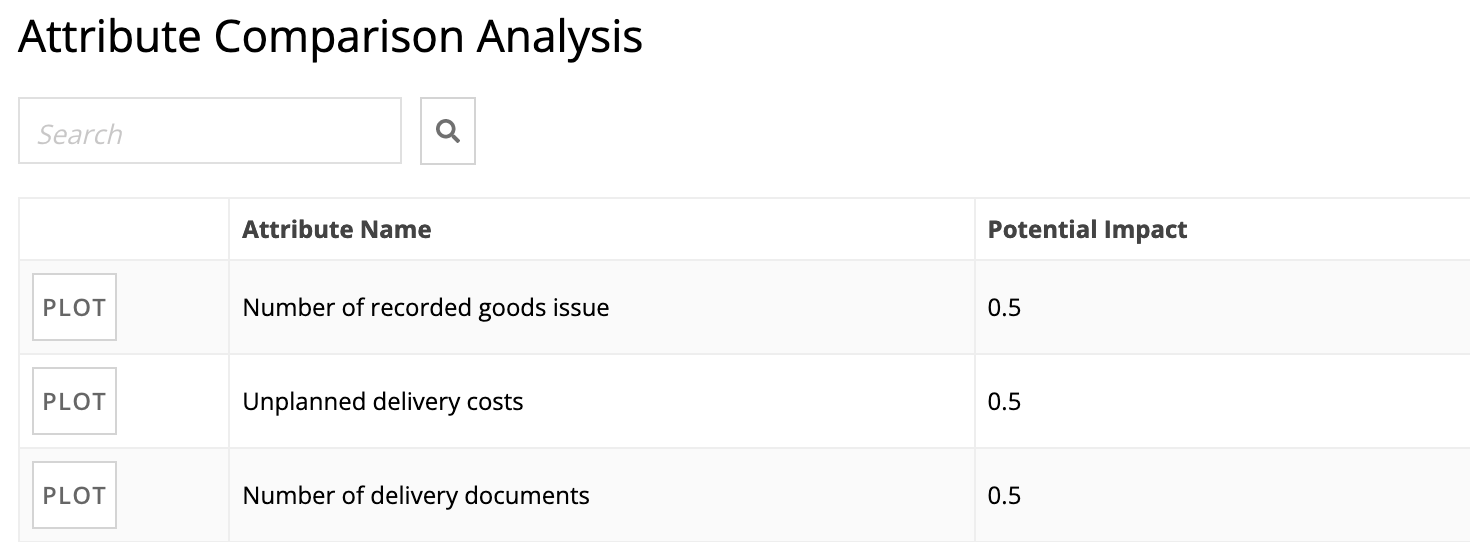
Attribute Comparison Analysis looks at the prevalence of attribute values in cases affected and unaffected by the issue you are analyzing. For example, when you perform root cause analysis on a deviation, this section finds how many times each value of a case or event attribute occurs in cases with and without the deviation.
The Potential Impact column displays a number between 0 and 1 for each attribute that indicates how likely the attribute correlates with the issue.
If an attribute has a high potential impact, you may want to plot the attribute to see which specific value is associated with the affected cases or use the attribute as a filter to focus your analysis further.
0indicates that the attribute is not the root cause because there is no difference between the attribute's prevalence in affected and non-affected cases.1indicates a strong indicator for a root cause because a value of the attribute only occurs in the affected cases.
For example, let's say you have a Country attribute that is either Country 1 or Country 2. If the Potential Impact value for Country is 1, all affected cases only happen for a single Country value. If the Potential Impact value for Country is 0, there is no difference in the distribution of values in affected and non-affected cases, and the issue occurs similarly for Country 1 and Country 2.
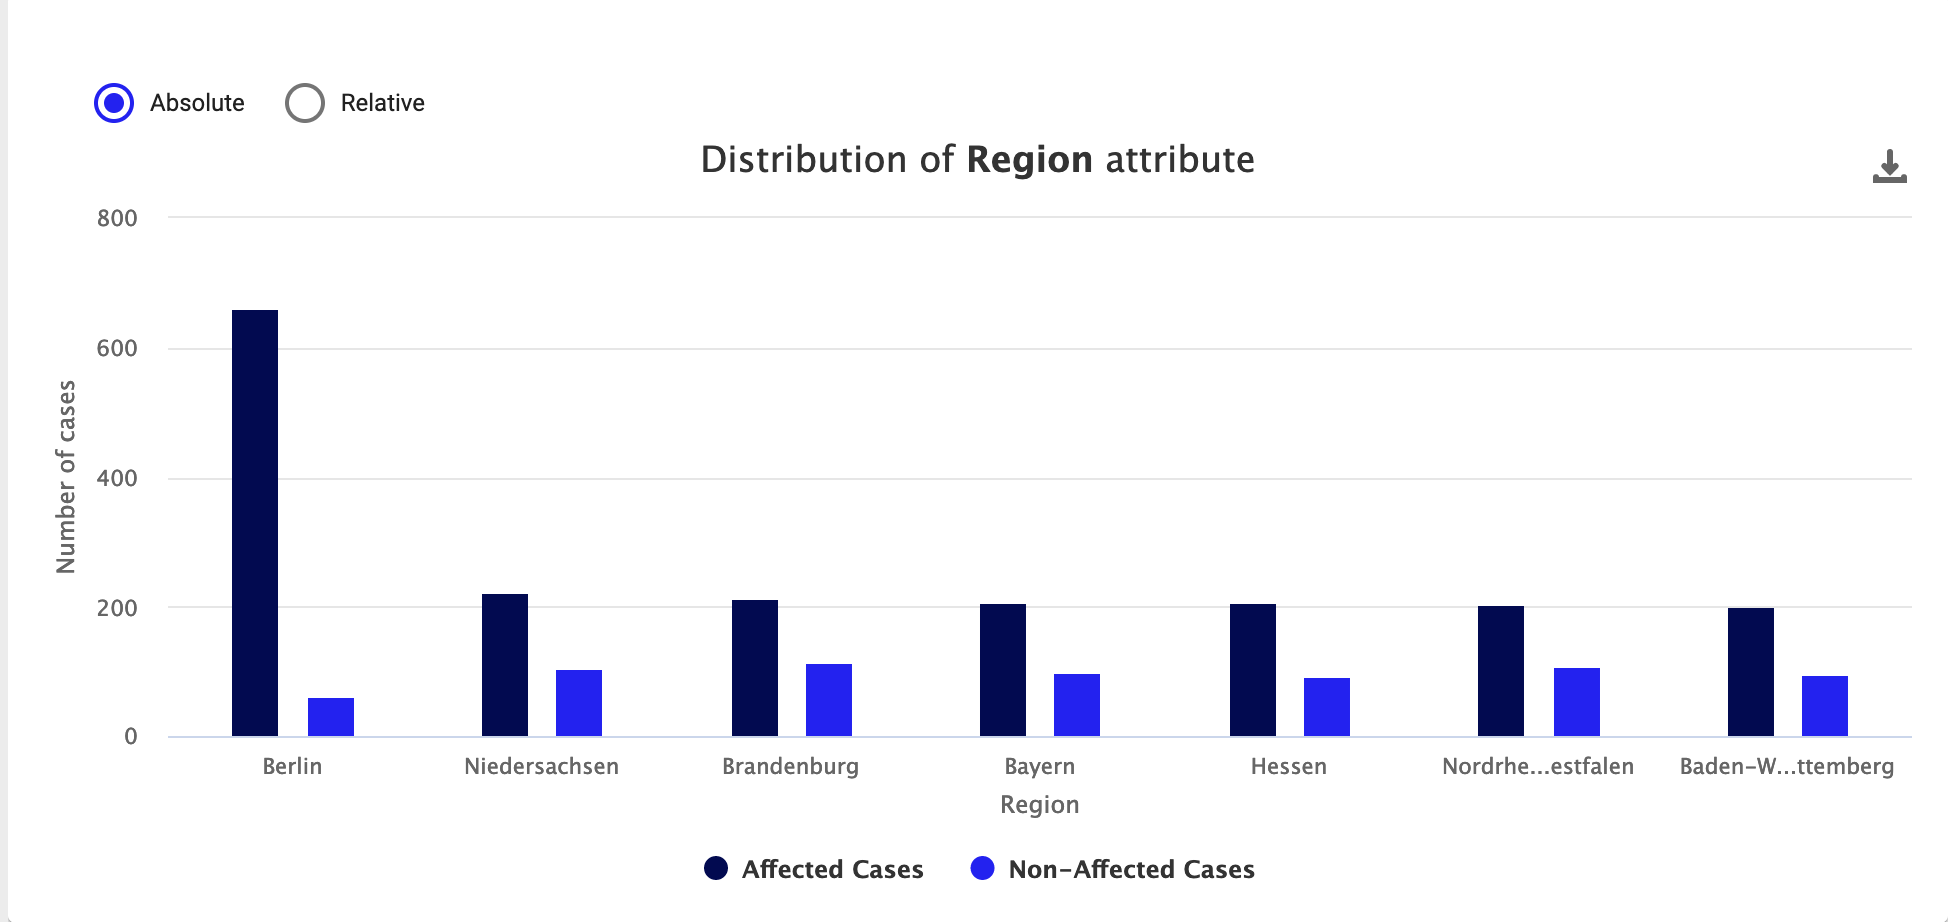
To dig deeper into this analysis, you can plot the distribution of values for affected and non-affected cases. To plot these values for a specific attribute, click PLOT beside the attribute you are curious about. In the previous example where the Potential Impact was 1 for the Country attribute, you could plot Country to see which of the values, Country 1 or Country 2, occurred in all affected cases.
On the graph, you can select between Absolute and Relative (default) numbers to display on the graph's y-axis and value that displays when you hover over a bar. Depending on your data, one option may indicate the root cause more clearly than another. For example, sometimes absolute numbers may appear very similar, but switching to relative numbers emphasizes the differences.
- Absolute: Displays actual number of cases. For example, an absolute number of 100 indicates that the 100 cases fell into a category.
- Relative: Displays the number of cases relative to the whole. For example, a relative number of .30 indicates that 30% of cases fell into a category.
Click Download to save the graph.
Causal Rules for Affected CasesCopy link to clipboard
Causal Rules for Affected Cases shows common patterns in your process that might have an impact on its performance and conformance. The root cause analysis automatically identifies possible causal rules that might affect the performance of the process. A causal rule is attribute correlation that occurs more frequently in the focus area.
In addition to the rule itself, this section displays a percentage and the number of cases in the focus area that this rule covers. The third column also displays the accuracy of the rule. Click SETTINGS to exclude certain attributes. Click RE-RUN to see how these rules change based on excluding attributes.
Example:
Let's say you have a data set with 2000 cases. In your root cause analysis, you focus on all cases where Resolution & Recovery is skipped, which is 365/2000.
Process Mining automatically derives a rule from this selection of cases such as costs > 6000. This rule applies to a certain percentage of cases, which is shown in the Coverage of affected cases column. However, the rule doesn't necessarily apply to all cases, which is shown in the Affected cases contained in rule column.
Therefore, the second column specifies the coverage and the third column specifies the accuracy of the rule. The coverage is how many cases are matched by the rules.
If the initial set of rules are not sufficient to answer analysis questions, click FIND MORE RULES to generate more causal rules. Note that the rules become less accurate or cover fewer of the cases considered, but they are still useful in some circumstances where you want to expand your analysis to include more possible explanations for the deviation.
Click Show settings  to see which data set attributes weren't considered. Here you can adjust which attributes to include or exclude and rerun the analysis with the new settings.
Most Important Categorical AttributesCopy link to clipboard
This section displays the most commonly occurring attributes, their values, frequency, and coverage in the focus area. The coverage is the percentage of cases that have this attribute and value combination.
To set one of the listed attributes as a filter, select the checkbox for an attribute and click FILTER.

Distribution analysisCopy link to clipboard
Distribution analysis compares the distribution of the selected activity's duration or direct follower duration with regard to the selected attributes. Based on the selected data, the distribution of durations for each combination of activity or direct follower relation and attribute value are calculated. Therefore, it is possible to identify if an activity or process sequence is significantly shifted for a certain attribute value.
With distribution analysis, you do not need to know the activity duration beforehand, unlike with root cause analysis. To perform distribution analysis, you need to select at least:
- One activity and one categorical attribute, or
- One follower relationship and one categorical attribute.
If your event log has start and end time stamps, you can select both activities and follower relationships; if not, you can select follower relationships to include in the analysis. In either instance, you also need to select at least one categorical attribute to include.
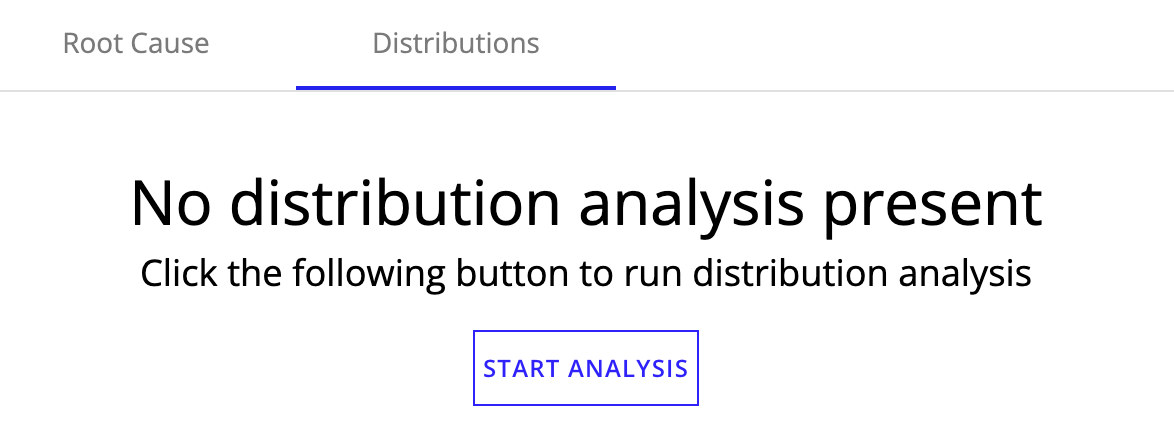
To start a distribution analysis:
- On the Insights page, go to the Distributions tab.
- Click START ANALYSIS.
- Click the headings in the wizard to configure the necessary steps.
- Select Activities: Select specific activities to include activity durations in the analysis. Activities need start and end time stamps to display in this list.
- Select Follower Relation: Select follower relationships between two activities to include waiting times in the analysis.
- Select Categorical Attributes: Select attributes to consider categorical attributes in the analysis.
- Click RUN.
Once the distribution analysis finishes, a confirmation message displays at the bottom of the screen. Click this message to go to your results. The analysis runs in the background, so you can continue to use Process Mining while it completes.
Tip: Analysis may take longer if you select many activities, direct follower relations, and attributes for the analysis.
Results of the distribution analysisCopy link to clipboard
The analysis results display in a table with the following information:
- Metric
- Attribute
- Attribute Value
- Median Difference: Difference of the medians in both samples. Absolute values in tooltip.
- Difference Ratio: Indicates at a high-level how different the distributions are.
- 1.0-0.8 is very high
- 0.8-0.6 is high
- 0.6-0.4 is medium
- 0.4-2.0 is low
- 0.2-0.0 is very low
- Width Ratio: Indicates how dispersed the distributions are against each other based on the quotient of the interquartile ranges (IQRs) of both samples. A value of
1indicates that the selected attribute value doesn't have a measurable IQR difference between the execution time of the process and the rest of the data set.
You can use difference and width ratios to help identify attribute values that produce distributions with different, undesired shapes compared to the rest of the data set. In other words, these metrics help you find attribute values that lead to outliers more than other attributes.
To see the distribution analysis results visually, click Plot.
At the top of the Analysis results, you can:
- Click SETTINGS to adjust the current distribution analysis settings.
- Click NEW ANALYSIS to start a new analysis from the beginning.
