
This pattern illustrates how to calculate year-over-year sales growth and display it in a KPI. This pattern also provides a sample scenario to show how you can take common business requirements and quickly turn them into a report.
You'll notice that this pattern provides more than just an expression, it shows you the fastest way to build reports in Design Mode. To get the most out of this pattern, follow the steps in Create this pattern to learn how to build advanced reports using the latest low-code features.
ScenarioCopy link to clipboard
Sales executives at the Appian Retail company want to know how their sales in 2021 compared to their sales in 2020 so they can see, overall, how business is doing. Specifically, they need to know if business has grown over the year before they decide to expand existing product lines. If business has not grown, this may indicate that they need to shift their existing product strategy before expanding to new ones.
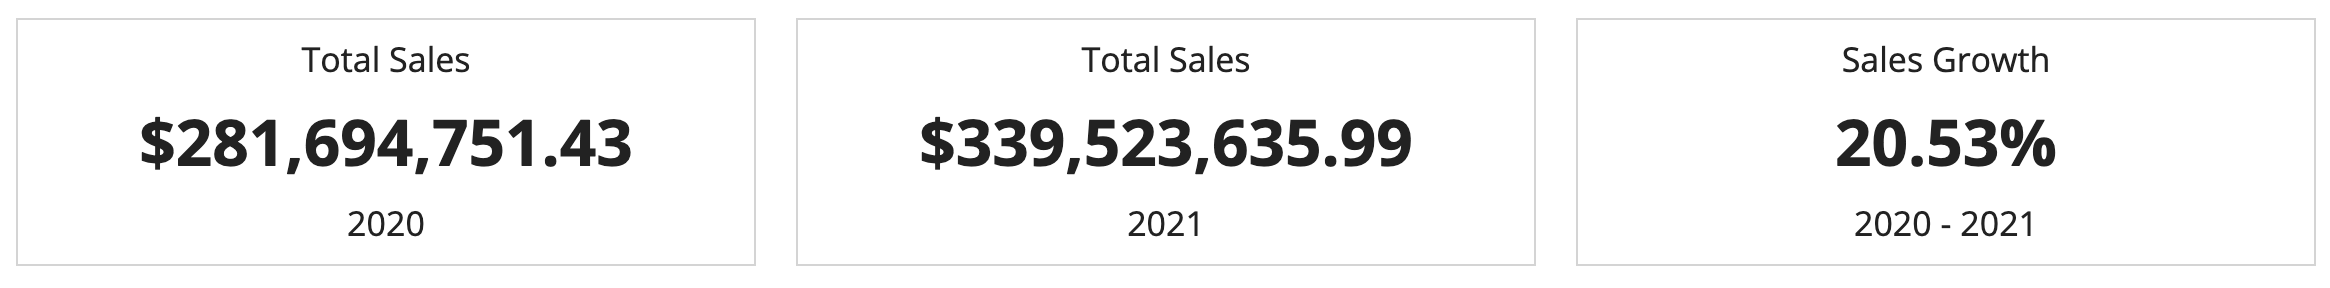
To show how 2021 sales compare to 2020 sales, you'll use the pattern on this page to calculate the company's year-over-year sales growth and display that value as a key performance indicator (KPI).
The report will look like this:

SetupCopy link to clipboard
This pattern uses data from the Appian Retail application, available for free in Appian Community Edition. To follow along with this pattern, log in to Appian Community to request the latest Appian Community Edition site.
If you do not see the Appian Retail application available in your existing Appian Community Edition, you can request a new Appian Community Edition to get the latest application contents available.
This pattern will use data from the following record types in the Appian Retail application:
- Order record type: Contains order information like the order number, date, status, and whether it was purchased online or in stores. For example, order number SO43659 was purchased in stores on 5/31/2019 and the order is closed.
- Order Detail record type: Contains specific order details like the number of order items, order totals, promo codes applied, and products. For example, the order above contained one product that cost $2,024.99.
Create this patternCopy link to clipboard
To create this pattern:
- Calculate sales growth.
- Show sales growth in a KPI.
- Show total sales in 2020 and total sales in 2021 as KPIs.
Step 1: Calculate year-over-year sales growthCopy link to clipboard
Sales growth is a common business metric that measures how quickly a company is growing its sales over a period of time. It's measured as a percentage using the following formula:
[(Sales for the current period - Sales for the previous period) / Sales for the previous period] x 100
For this example, you'll calculate the sum of sales in 2021 and 2020. You'll use the a!queryRecordType() function to calculate these values and store those values in two different local variables.
Once you have those variables, you can plug them into the sales growth formula and store the results in another local variable for easy reuse throughout the interface.
To calculate sales growth:
- In the Appian Retail application, go to the Build view.
- Click NEW > Interface.
- Configure the interface properties and click CREATE.
- Click EXPRESSION in the title bar.
-
Copy and paste the following expression:
Note: These record type references are specific to the Appian Retail application. If you're following along in the Appian Retail application, you can copy and paste this expression without updating the record type references.
1
2
3
4
5
6
7
8
9
10
11
12
13
14
15
16
17
18
19
20
21
22
23
24
25
26
27
28
29
30
31
32
33
34
35
36
37
38
39
40
41
42
43
44
45
46
47
48
49
50
51
52
53
54
55
56
57
58
59
60
61
62
63
64
65
66
67
68
69
70
71
72
 a!localVariables(
   /* Calculate the sum of sales for orders placed in 2021 */
   local!sales2021: a!queryRecordType(
     recordType: 'recordType!{ad898682-e651-4b2d-af67-47c1fcb1171f}Order',
     filters: a!queryFilter(
       field: 'recordType!{ad898682-e651-4b2d-af67-47c1fcb1171f}Order.fields.{fbcc99f6-1ddf-4923-903b-18122a1737c6}orderDate',
       operator: "BETWEEN",
       value: {
         /* 2021 year */
         todatetime("01/01/2021"),
         todatetime("12/31/2021")
       }
     ),
     fields: a!aggregationFields(
       /* Group by order date year */
       groupings: a!grouping(
         field: 'recordType!{ad898682-e651-4b2d-af67-47c1fcb1171f}Order.fields.{fbcc99f6-1ddf-4923-903b-18122a1737c6}orderDate',
         alias: "orderDate",
         interval: "YEAR"
       ),
       /* Get the sum of line total for all order items */
       measures: a!measure(
         field: 'recordType!{ad898682-e651-4b2d-af67-47c1fcb1171f}Order.relationships.{0bde4028-fd7a-411f-97ad-7ad5b84e0d18}orderDetail.fields.{db456082-5f77-4765-bc3e-f662651e0d52}lineTotal',
         function: "SUM",
         alias: "sumOfOrders"
       )
     ),
     pagingInfo: a!pagingInfo(startIndex: 1, batchSize: 500)
   ).data,
   /* Calculate the sum of sales for orders placed in 2020 */
   local!sales2020: a!queryRecordType(
     recordType: 'recordType!{ad898682-e651-4b2d-af67-47c1fcb1171f}Order',
     filters: a!queryFilter(
       field: 'recordType!{ad898682-e651-4b2d-af67-47c1fcb1171f}Order.fields.{fbcc99f6-1ddf-4923-903b-18122a1737c6}orderDate',
       operator: "BETWEEN",
       value: {
         /* 2020 year */
         todatetime("01/01/2020"),
         todatetime("12/31/2020")
       }
     ),
     fields: a!aggregationFields(
       /* Group by order date year */
       groupings: a!grouping(
         field: 'recordType!{ad898682-e651-4b2d-af67-47c1fcb1171f}Order.fields.{fbcc99f6-1ddf-4923-903b-18122a1737c6}orderDate',
         alias: "orderDate",
         interval: "YEAR"
       ),
       /* Get the sum of line total for all order items */
       measures: a!measure(
         field: 'recordType!{ad898682-e651-4b2d-af67-47c1fcb1171f}Order.relationships.{0bde4028-fd7a-411f-97ad-7ad5b84e0d18}orderDetail.fields.{db456082-5f77-4765-bc3e-f662651e0d52}lineTotal',
         function: "SUM",
         alias: "sumOfOrders"
       )
     ),
     pagingInfo: a!pagingInfo(startIndex: 1, batchSize: 500)
   ).data,
   /* Sales growth calculation */
   local!salesGrowth: (
     local!sales2021.sumOfOrders - local!sales2020.sumOfOrders
   ) / local!sales2020.sumOfOrders * 100,
   /* Column layout that we'll use for our KPIs */
   {
     a!columnsLayout(
       columns: {
         a!columnLayout(contents: {}),
         a!columnLayout(contents: {}),
         a!columnLayout(contents: {})
       }
     )
   }
 )
Copy
Step 2: Show sales growth in a KPICopy link to clipboard
Now that you have the sales growth percentage, you can display this value as a KPI in the interface. To create the KPI, you'll use a card layout to display the sales growth percentage and add two labels.
To display sales growth in a KPI:
- In your interface, click DESIGN in the title bar. A column layout with three columns appears.
- From the PALETTE, drag a CARD component into the right column.
- From the PALETTE, drag a RICH TEXT component into the Card Layout.
- In the Rich Text component configuration, under Display Value, select Configure items.
- Click ADD RICH TEXT.
- From the Add Rich Text dialog, select STYLED TEXT.
- In Display Value, click Styled Text.
- In Text, click Styled Text.
-
Replace the existing expression with the following expression. This will round the sales growth value to the second decimal place, and display a percentage sign.
1
{round(local!salesGrowth, 2) & "%"}
Copy - Click OK.
- For Size, select Large.
- For Style, select Strong.
- Return to the Rich Text configuration.
- For Alignment, select Center.
Now that the sales growth percentage is displayed, let's add some labels:
- From the PALETTE, drag another RICH TEXT component above the existing rich text component containing the sales growth. You'll use this second rich text component as a label.
- In the Rich Text component configuration, under Display Value, keep the default selection of Use editor.
- In the editor, enter
Sales Growth. - In the editor, highlight the text, then click Size
 and select Medium Text.
 - For Alignment, select Center.
- From the PALETTE, drag another RICH TEXT component below the existing rich text component containing the sales growth. You'll use this third rich text component to display the time frame.
- In the Rich Text component configuration, under Display Value, keep the default selection of Use editor.
- In the editor, enter
2020 - 2021. - In the editor, highlight the text, then click Size and select Medium Text.
- For Alignment, select Center.
The interface currently looks like this:

Step 3: Show 2020 and 2021 sales as KPIsCopy link to clipboard
In addition to the sales growth, let's add two more KPI: one that shows the sum of sales in 2020, and another that shows the sum of sales in 2021. Showing these two KPIs will help sales executives visualize the sales growth percentage.
Create a KPI for sum of sales in 2020Copy link to clipboard
To show the sum of sales in 2020 as a KPI:
- From the PALETTE, drag a CARD component into the left column.
- From the PALETTE, drag a RICH TEXT component into the Card Layout.
- In the Rich Text component configuration, under Display Value, select Configure items.
- Click ADD RICH TEXT.
- From the Add Rich Text dialog, select STYLED TEXT.
- In Display Value, click Styled Text.
- In Text, click Styled Text.
-
Replace the existing expression with the following expression. This will display the sum of sales from last year in a dollar amount.
1
2
3
4
 a!currency(
   isoCode: "USD",
   value: local!sales2020.sumOfOrders
   )
Copy - Click OK.
- For Size, select Large.
- For Style, select Strong.
- Return to the Rich Text configuration.
- For Alignment, select Center.
To add labels to your sales KPI:
- From the PALETTE, drag another RICH TEXT component above the existing rich text component containing 2020 sales. You'll use this second rich text component as a label.
- In the Rich Text component configuration, under Display Value, keep the default selection of Use editor.
- In the editor, enter
Total Sales. - In the editor, highlight the text, then click Size and select Medium Text.
- For Alignment, select Center.
- From the PALETTE, drag another RICH TEXT component below the existing rich text component containing 2020 sales. You'll use this third rich text component to display the time frame.
- In the Rich Text component configuration, under Display Value, keep the default selection of Use editor.
- In the editor, enter
2020. - In the editor, highlight the text, then click Size and select Medium Text.
- For Alignment, select Center.
Create a KPI for sum of sales in 2021Copy link to clipboard
To show the sum of sales in 2021 as a KPI:
- From the PALETTE, drag a CARD component into the middle column.
- From the PALETTE, drag a RICH TEXT component into the Card Layout.
- In the Rich Text component configuration, under Display Value, select Configure items.
- Click ADD RICH TEXT.
- From the Add Rich Text dialog, select STYLED TEXT.
- In Display Value, click Styled Text.
- In Text, click Styled Text.
-
Replace the existing expression with the following expression. This will display the sum of sales in 2021 in a dollar amount.
1
2
3
4
 a!currency(
   isoCode: "USD",
   value: local!sales2021.sumOfOrders
   )
Copy - Click OK.
- For Size, select Large.
- For Style, select Strong.
- Return to the Rich Text configuration.
- For Alignment, select Center.
To add labels to your sales KPI:
- From the PALETTE, drag another RICH TEXT component above the existing rich text component containing 2021 sales. You'll use this second rich text component as a label.
- In the Rich Text component configuration, under Display Value, keep the default selection of Use editor.
- In the editor, enter
Total Sales. - In the editor, highlight the text, then click Size and select Medium Text.
- For Alignment, select Center.
- From the PALETTE, drag another RICH TEXT component below the existing rich text component containing 2021 sales. You'll use this third rich text component to display the time frame.
- In the Rich Text component configuration, under Display Value, keep the default selection of Use editor.
- In the editor, enter
2021. - In the editor, highlight the text, then click Size and select Medium Text.
- For Alignment, select Center.
The final interface looks like this:
Full expressionCopy link to clipboard
The resulting expression will look like this:
Note: You can copy and paste this expression into an interface in the Appian Retail application to see the fully configured pattern.
If you're using a different environment, you will need to replace the record field references.
1
2
3
4
5
6
7
8
9
10
11
12
13
14
15
16
17
18
19
20
21
22
23
24
25
26
27
28
29
30
31
32
33
34
35
36
37
38
39
40
41
42
43
44
45
46
47
48
49
50
51
52
53
54
55
56
57
58
59
60
61
62
63
64
65
66
67
68
69
70
71
72
73
74
75
76
77
78
79
80
81
82
83
84
85
86
87
88
89
90
91
92
93
94
95
96
97
98
99
100
101
102
103
104
105
106
107
108
109
110
111
112
113
114
115
116
117
118
119
120
121
122
123
124
125
126
127
128
129
130
131
132
133
134
135
136
137
138
139
140
141
142
143
144
145
146
147
148
149
150
151
152
153
154
155
156
157
158
159
160
161
162
163
164
165
166
167
168
169
170
171
172
173
174
175
176
177
178
179
180
181
182
183
184
185
186
187
a!localVariables(
  /* Calculate the sum of sales for orders placed in 2021 */
  local!sales2021: a!queryRecordType(
    recordType: 'recordType!{ad898682-e651-4b2d-af67-47c1fcb1171f}Order',
    filters: a!queryFilter(
      field: 'recordType!{ad898682-e651-4b2d-af67-47c1fcb1171f}Order.fields.{fbcc99f6-1ddf-4923-903b-18122a1737c6}orderDate',
      operator: "BETWEEN",
      value: {
        /* 2021 year */
        todatetime("01/01/2021"),
        todatetime("12/31/2021")
      }
    ),
    fields: a!aggregationFields(
      /* Group by order date year */
      groupings: a!grouping(
        field: 'recordType!{ad898682-e651-4b2d-af67-47c1fcb1171f}Order.fields.{fbcc99f6-1ddf-4923-903b-18122a1737c6}orderDate',
        alias: "orderDate",
        interval: "YEAR"
      ),
      /* Get the sum of line total for all order items */
      measures: a!measure(
        field: 'recordType!{ad898682-e651-4b2d-af67-47c1fcb1171f}Order.relationships.{0bde4028-fd7a-411f-97ad-7ad5b84e0d18}orderDetail.fields.{db456082-5f77-4765-bc3e-f662651e0d52}lineTotal',
        function: "SUM",
        alias: "sumOfOrders"
      )
    ),
    pagingInfo: a!pagingInfo(startIndex: 1, batchSize: 500)
  ).data,
  /* Calculate the sum of sales for orders placed in 2020 */
  local!sales2020: a!queryRecordType(
    recordType: 'recordType!{ad898682-e651-4b2d-af67-47c1fcb1171f}Order',
    filters: a!queryFilter(
      field: 'recordType!{ad898682-e651-4b2d-af67-47c1fcb1171f}Order.fields.{fbcc99f6-1ddf-4923-903b-18122a1737c6}orderDate',
      operator: "BETWEEN",
      value: {
        /* 2020 year */
        todatetime("01/01/2020"),
        todatetime("12/31/2020")
      }
    ),
    fields: a!aggregationFields(
      /* Group by order date year */
      groupings: a!grouping(
        field: 'recordType!{ad898682-e651-4b2d-af67-47c1fcb1171f}Order.fields.{fbcc99f6-1ddf-4923-903b-18122a1737c6}orderDate',
        alias: "orderDate",
        interval: "YEAR"
      ),
      /* Get the sum of line total for all order items */
      measures: a!measure(
        field: 'recordType!{ad898682-e651-4b2d-af67-47c1fcb1171f}Order.relationships.{0bde4028-fd7a-411f-97ad-7ad5b84e0d18}orderDetail.fields.{db456082-5f77-4765-bc3e-f662651e0d52}lineTotal',
        function: "SUM",
        alias: "sumOfOrders"
      )
    ),
    pagingInfo: a!pagingInfo(startIndex: 1, batchSize: 500)
  ).data,
  /* Sales growth calculation */
  local!salesGrowth: (
    local!sales2021.sumOfOrders - local!sales2020.sumOfOrders
  ) / local!sales2020.sumOfOrders * 100,
  /* Column layout that we'll use for our KPIs */
  {
    a!columnsLayout(
      columns: {
        a!columnLayout(
          contents: {
            a!cardLayout(
              contents: {
                a!richTextDisplayField(
                  labelPosition: "COLLAPSED",
                  value: {
                    a!richTextItem(text: { "Total Sales" }, size: "MEDIUM")
                  },
                  align: "CENTER"
                ),
                a!richTextDisplayField(
                  labelPosition: "COLLAPSED",
                  value: {
                    a!richTextItem(
                      text: {
                        a!currency(
                          isoCode: "USD",
                          value: local!sales2020.sumOfOrders
                        )
                      },
                      size: "LARGE",
                      style: { "STRONG" }
                    )
                  },
                  align: "CENTER"
                ),
                a!richTextDisplayField(
                  labelPosition: "COLLAPSED",
                  value: {
                    a!richTextItem(text: { "2020" }, size: "MEDIUM")
                  },
                  align: "CENTER"
                )
              },
              height: "AUTO",
              style: "TRANSPARENT",
              marginBelow: "STANDARD"
            )
          }
        ),
        a!columnLayout(
          contents: {
            a!cardLayout(
              contents: {
                a!richTextDisplayField(
                  labelPosition: "COLLAPSED",
                  value: {
                    a!richTextItem(text: { "Total Sales" }, size: "MEDIUM")
                  },
                  align: "CENTER"
                ),
                a!richTextDisplayField(
                  labelPosition: "COLLAPSED",
                  value: {
                    a!richTextItem(
                      text: {
                        a!currency(
                          isoCode: "USD",
                          value: local!sales2021.sumOfOrders
                        )
                      },
                      size: "LARGE",
                      style: { "STRONG" }
                    )
                  },
                  align: "CENTER"
                ),
                a!richTextDisplayField(
                  labelPosition: "COLLAPSED",
                  value: {
                    a!richTextItem(text: { "2021" }, size: "MEDIUM")
                  },
                  align: "CENTER"
                )
              },
              height: "AUTO",
              style: "TRANSPARENT",
              marginBelow: "STANDARD"
            )
          }
        ),
        a!columnLayout(
          contents: {
            a!cardLayout(
              contents: {
                a!richTextDisplayField(
                  labelPosition: "COLLAPSED",
                  value: {
                    a!richTextItem(text: { "Sales Growth" }, size: "MEDIUM")
                  },
                  align: "CENTER"
                ),
                a!richTextDisplayField(
                  labelPosition: "COLLAPSED",
                  value: {
                    a!richTextItem(
                      text: { { round(local!salesGrowth, 2) & "%" } },
                      size: "LARGE",
                      style: { "STRONG" }
                    )
                  },
                  align: "CENTER"
                ),
                a!richTextDisplayField(
                  labelPosition: "COLLAPSED",
                  value: {
                    a!richTextItem(text: { "2020 - 2021" }, size: "MEDIUM")
                  },
                  align: "CENTER"
                )
              },
              height: "AUTO",
              style: "TRANSPARENT",
              marginBelow: "STANDARD"
            )
          }
        )
      }
    )
  }
)
Copy