
Tip: Interface patterns give you an opportunity to explore different interface designs. Be sure to check out How to Adapt a Pattern for Your Application.
GoalCopy link to clipboard
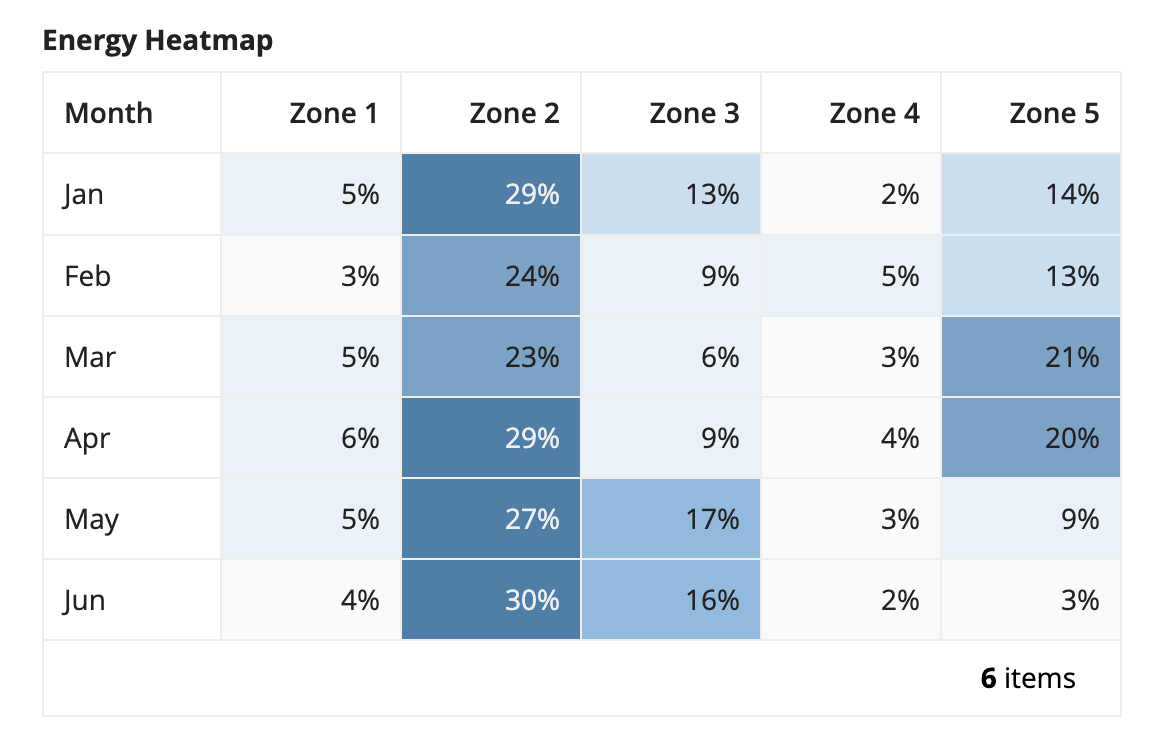
Displays a grid with conditional formatting of background colors at different thresholds. This page explains how you can use this pattern in your interface, and walks through the design structure in detail.
Design structureCopy link to clipboard
This page will break down this expression so you can better understand how to adapt this pattern to your own data so that it works to best suit your needs.
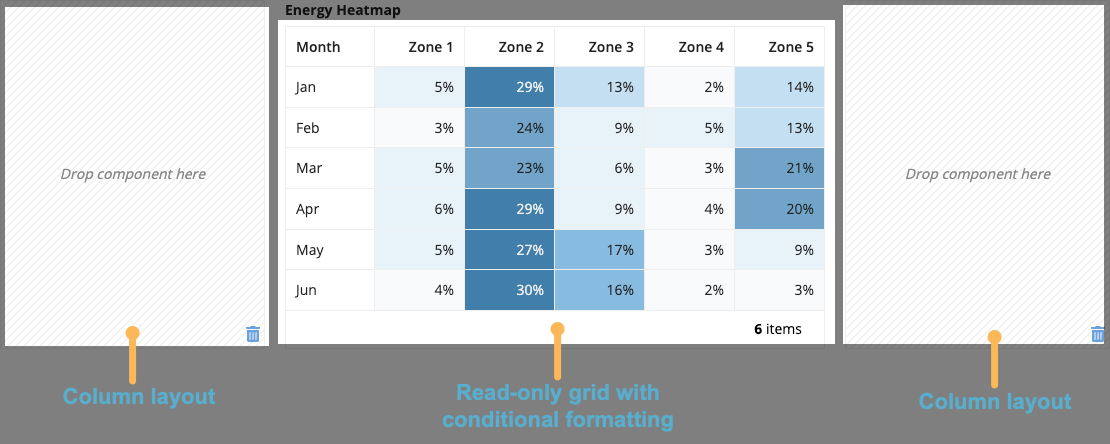
The main component in this pattern is the read-only grid. The image below displays how the pattern looks on a blank interface with callouts for the main components. You can examine the entire expression or jump down to the subsections below with referenced line numbers to see a detailed breakdown of the main components.

Pattern expressionCopy link to clipboard
When you drag and drop the Grid with Heatmap pattern onto your interface, 212 lines of expressions will be added to the section where you dragged it.
1
2
3
4
5
6
7
8
9
10
11
12
13
14
15
16
17
18
19
20
21
22
23
24
25
26
27
28
29
30
31
32
33
34
35
36
37
38
39
40
41
42
43
44
45
46
47
48
49
50
51
52
53
54
55
56
57
58
59
60
61
62
63
64
65
66
67
68
69
70
71
72
73
74
75
76
77
78
79
80
81
82
83
84
85
86
87
88
89
90
91
92
93
94
95
96
97
98
99
100
101
102
103
104
105
106
107
108
109
110
111
112
113
114
115
116
117
118
119
120
121
122
123
124
125
126
127
128
129
130
131
132
133
134
135
136
137
138
139
140
141
142
143
144
145
146
147
148
149
150
151
152
153
154
155
156
157
158
159
160
161
162
163
164
165
166
167
168
169
170
171
172
173
174
175
176
177
178
179
180
181
182
183
184
185
186
187
188
189
190
191
192
193
194
195
196
197
198
199
200
201
202
203
204
205
206
207
208
209
210
211
212
{
  a!columnsLayout(
    columns: {
      a!columnLayout(
        contents: {}
      ),
      a!columnLayout(
        contents: {
          a!localVariables(
            local!energyData: {
              a!map(id: 1, month: "Jan", zone1: 5, zone2: 29, zone3: 13, zone4: 2, zone5: 14),
              a!map(id: 2, month: "Feb", zone1: 3, zone2: 24, zone3: 9,  zone4: 5, zone5: 13),
              a!map(id: 3, month: "Mar", zone1: 5, zone2: 23, zone3: 6,  zone4: 3, zone5: 21),
              a!map(id: 4, month: "Apr", zone1: 6, zone2: 29, zone3: 9,  zone4: 4, zone5: 20),
              a!map(id: 5, month: "May", zone1: 5, zone2: 27, zone3: 17, zone4: 3, zone5: 9),
              a!map(id: 6, month: "Jun", zone1: 4, zone2: 30, zone3: 16, zone4: 2, zone5: 3),
            },
            local!extraHigh: "#417EAA",
            local!high: "#71A4C8",
            local!medium: "#87BBE0",
            local!low: "#C5DFF2",
            local!extraLow: "#E8F2F9",
            local!defaultColor: "#F8FAFC",
            a!gridField(
              label: "Energy Heatmap",
              /* Replace the example data with your own query, rule, or function.*/
              data: local!energyData,
              columns: {
                a!gridColumn(
                  label: "Month",
                  value: fv!row.month
                ),
                a!gridColumn(
                  label: "Zone 1",
                  value: fv!row.zone1 & "%",
                  /* Using a!match() lets you set different background colors based on the value of zone1 in the current row. The other grid columns use a!match() to set the colors for the remaining zones.*/
                  backgroundColor: a!match(
                    value: fv!row.zone1,
                    whenTrue: fv!row.zone1 >= 25,
                    then: local!extraHigh,
                    whenTrue: fv!row.zone1 >= 20,
                    then: local!high,
                    whenTrue: fv!row.zone1 >= 15,
                    then: local!medium,
                    whenTrue: fv!row.zone1 >= 10,
                    then: local!low,
                    whenTrue: fv!row.zone1 >= 5,
                    then: local!extraLow,
                    default: local!defaultColor
                  ),
                  align: "END",
                  /* For accessibility, use a similar a!match() to return the meaning of the color*/
                  accessibilityText: a!match(
                    value: fv!row.zone1,
                    whenTrue: fv!row.zone1 >= 25,
                    then: "Extra High",
                    whenTrue: fv!row.zone1 >= 20,
                    then: "High",
                    whenTrue: fv!row.zone1 >= 15,
                    then: "Medium",
                    whenTrue: fv!row.zone1 >= 10,
                    then: "Low",
                    whenTrue: fv!row.zone1 >= 5,
                    then: "Extra Low",
                    default: ""
                  )
                ),
                a!gridColumn(
                  label: "Zone 2",
                  value: fv!row.zone2 & "%",
                  backgroundColor: a!match(
                    value: fv!row.zone2,
                    whenTrue: fv!row.zone2 >= 25,
                    then: local!extraHigh,
                    whenTrue: fv!row.zone2 >= 20,
                    then: local!high,
                    whenTrue: fv!row.zone2 >= 15,
                    then: local!medium,
                    whenTrue: fv!row.zone2 >= 10,
                    then: local!low,
                    whenTrue: fv!row.zone2 >= 5,
                    then: local!extraLow,
                    default: local!defaultColor
                  ),
                  align: "END",
                  accessibilityText: a!match(
                    value: fv!row.zone2,
                    whenTrue: fv!row.zone2 >= 25,
                    then: "Extra High",
                    whenTrue: fv!row.zone2 >= 20,
                    then: "High",
                    whenTrue: fv!row.zone2 >= 15,
                    then: "Medium",
                    whenTrue: fv!row.zone2 >= 10,
                    then: "Low",
                    whenTrue: fv!row.zone2 >= 5,
                    then: "Extra Low",
                    default: ""
                  )
                ),
                a!gridColumn(
                  label: "Zone 3",
                  value: fv!row.zone3 & "%",
                  backgroundColor: a!match(
                    value: fv!row.zone3,
                    whenTrue: fv!row.zone3 >= 25,
                    then: local!extraHigh,
                    whenTrue: fv!row.zone3 >= 20,
                    then: local!high,
                    whenTrue: fv!row.zone3 >= 15,
                    then: local!medium,
                    whenTrue: fv!row.zone3 >= 10,
                    then: local!low,
                    whenTrue: fv!row.zone3 >= 5,
                    then: local!extraLow,
                    default: local!defaultColor
                  ),
                  align: "END",
                  accessibilityText: a!match(
                    value: fv!row.zone3,
                    whenTrue: fv!row.zone3 >= 25,
                    then: "Extra High",
                    whenTrue: fv!row.zone3 >= 20,
                    then: "High",
                    whenTrue: fv!row.zone3 >= 15,
                    then: "Medium",
                    whenTrue: fv!row.zone3 >= 10,
                    then: "Low",
                    whenTrue: fv!row.zone3 >= 5,
                    then: "Extra Low",
                    default: ""
                  )
                ),
                a!gridColumn(
                  label: "Zone 4",
                  value: fv!row.zone4 & "%",
                  backgroundColor: a!match(
                    value: fv!row.zone4,
                    whenTrue: fv!row.zone4 >= 25,
                    then: local!extraHigh,
                    whenTrue: fv!row.zone4 >= 20,
                    then: local!high,
                    whenTrue: fv!row.zone4 >= 15,
                    then: local!medium,
                    whenTrue: fv!row.zone4 >= 10,
                    then: local!low,
                    whenTrue: fv!row.zone4 >= 5,
                    then: local!extraLow,
                    default: local!defaultColor
                  ),
                  align: "END",
                  accessibilityText: a!match(
                    value: fv!row.zone4,
                    whenTrue: fv!row.zone4 >= 25,
                    then: "Extra High",
                    whenTrue: fv!row.zone4 >= 20,
                    then: "High",
                    whenTrue: fv!row.zone4 >= 15,
                    then: "Medium",
                    whenTrue: fv!row.zone4 >= 10,
                    then: "Low",
                    whenTrue: fv!row.zone4 >= 5,
                    then: "Extra Low",
                    default: ""
                  )
                ),
                a!gridColumn(
                  label: "Zone 5",
                  value: fv!row.zone5 & "%",
                  backgroundColor: a!match(
                    value: fv!row.zone5,
                    whenTrue: fv!row.zone5 >= 25,
                    then: local!extraHigh,
                    whenTrue: fv!row.zone5 >= 20,
                    then: local!high,
                    whenTrue: fv!row.zone5 >= 15,
                    then: local!medium,
                    whenTrue: fv!row.zone5 >= 10,
                    then: local!low,
                    whenTrue: fv!row.zone5 >= 5,
                    then: local!extraLow,
                    default: local!defaultColor
                  ),
                  align: "END",
                  accessibilityText: a!match(
                    value: fv!row.zone5,
                    whenTrue: fv!row.zone5 >= 25,
                    then: "Extra High",
                    whenTrue: fv!row.zone5 >= 20,
                    then: "High",
                    whenTrue: fv!row.zone5 >= 15,
                    then: "Medium",
                    whenTrue: fv!row.zone5 >= 10,
                    then: "Low",
                    whenTrue: fv!row.zone5 >= 5,
                    then: "Extra Low",
                    default: ""
                  )
                )
              },
              shadeAlternateRows: false
            )
          )
        },
        width: "MEDIUM_PLUS"
      ),
      a!columnLayout(
        contents: {}
      )
    }
  )
}
Copy
[Line 1-8] Column layoutCopy link to clipboard
The column layout centers the read-only grid in your interface.
1
2
3
4
5
6
7
8
{
  a!columnsLayout(
    columns: {
      a!columnLayout(
        contents: {}
      ),
      a!columnLayout(
        contents: {
Copy
[Line 9-23] Define the local variable for energy dataCopy link to clipboard
In lines 10-16, a local variable is used to define the data to display in the grid. In this pattern, there is a list of a!map that defines static data inside the interface. When adapting this pattern for your interface, use a!queryRecordType instead of a!map() to query to a record type to define the data for the grid.
In lines 18-23, local variables define the cell background colors for each threshold and a default color to use for cells that don't meet any of the thresholds. When adapting this pattern, adjust the local variables to define the colors you want for each threshold and the default background color for the grid.
9
10
11
12
13
14
15
16
17
18
19
20
21
22
23
          a!localVariables(
            local!energyData: {
              a!map(id: 1, month: "Jan", zone1: 5, zone2: 29, zone3: 13, zone4: 2, zone5: 14),
              a!map(id: 2, month: "Feb", zone1: 3, zone2: 24, zone3: 9,  zone4: 5, zone5: 13),
              a!map(id: 3, month: "Mar", zone1: 5, zone2: 23, zone3: 6,  zone4: 3, zone5: 21),
              a!map(id: 4, month: "Apr", zone1: 6, zone2: 29, zone3: 9,  zone4: 4, zone5: 20),
              a!map(id: 5, month: "May", zone1: 5, zone2: 27, zone3: 17, zone4: 3, zone5: 9),
              a!map(id: 6, month: "Jun", zone1: 4, zone2: 30, zone3: 16, zone4: 2, zone5: 3),
            },
            local!extraHigh: "#417EAA",
            local!high: "#71A4C8",
            local!medium: "#87BBE0",
            local!low: "#C5DFF2",
            local!extraLow: "#E8F2F9",
            local!defaultColor: "#F8FAFC",
Copy
[Line 24-32] Define grid dataCopy link to clipboard
After defining the data, the read-only grid is configured to use the local variable local!energyData in the data parameter. This allows you to display data from the local variable in different columns in the grid.
For example, lines 30-33 display the month as the first column in the grid.
24
25
26
27
28
29
30
31
32
            a!gridField(
              label: "Energy Heatmap",
              /* Replace the example data with your own query, rule, or function.*/
              data: local!energyData,
              columns: {
                a!gridColumn(
                  label: "Month",
                  value: fv!row.month
                ),
Copy
[Line 33-51] Define thresholds for the first column background colorsCopy link to clipboard
The second column in the grid displays Zone 1 data and the zone percentage. The backgroundColor parameter uses the a!match() function to set different cell background colors based on the value of zone1 in the current row.
When adapting this pattern, modify the a!match() function to meet your own thresholds and to reference the local variables you created to store cell background colors.
33
34
35
36
37
38
39
40
41
42
43
44
45
46
47
48
49
50
51
                a!gridColumn(
                  label: "Zone 1",
                  value: fv!row.zone1 & "%",
                  /* Using a!match() lets you set different background colors based on the value of zone1 in the current row. The other grid columns use a!match() to set the colors for the remaining zones.*/
                  backgroundColor: a!match(
                    value: fv!row.zone1,
                    whenTrue: fv!row.zone1 >= 25,
                    then: local!extraHigh,
                    whenTrue: fv!row.zone1 >= 20,
                    then: local!high,
                    whenTrue: fv!row.zone1 >= 15,
                    then: local!medium,
                    whenTrue: fv!row.zone1 >= 10,
                    then: local!low,
                    whenTrue: fv!row.zone1 >= 5,
                    then: local!extraLow,
                    default: local!defaultColor
                  ),
                  align: "END",
Copy
[Line 52-67] Configure accessibility text for the first columnCopy link to clipboard
The Zone 1 column also includes accessibility text to allow users using screen readers to easily understand the meaning behind the different cell colors. The accessibilityText parameter uses a!match() to provide labels explaining the meaning of each threshold you defined in lines 33-51. The accessibility text won't appear anywhere in the grid, but can be read by screen readers.
When adapting this pattern, modify the a!match() function to briefly describe the meaning of each threshold and to reference the local variables you created to store cell background colors.
52
53
54
55
56
57
58
59
60
61
62
63
64
65
66
67
                  /* For accessibility, use a similar a!match() to return the meaning of the color*/
                  accessibilityText: a!match(
                    value: fv!row.zone1,
                    whenTrue: fv!row.zone1 >= 25,
                    then: "Extra High",
                    whenTrue: fv!row.zone1 >= 20,
                    then: "High",
                    whenTrue: fv!row.zone1 >= 15,
                    then: "Medium",
                    whenTrue: fv!row.zone1 >= 10,
                    then: "Low",
                    whenTrue: fv!row.zone1 >= 5,
                    then: "Extra Low",
                    default: ""
                  )
                ),
Copy
[Line 68-212] Define thresholds and accessibility text for remaining columnsCopy link to clipboard
The rest of the pattern defines other columns in the grid. Similar to the Zone 1 column, the other columns use a!match() to set different background colors and accessibility text based on the value of the current row.
68
69
70
71
72
73
74
75
76
77
78
79
80
81
82
83
84
85
86
87
88
89
90
91
92
93
94
95
96
97
98
99
100
101
102
103
104
105
106
107
108
109
110
111
112
113
114
115
116
117
118
119
120
121
122
123
124
125
126
127
128
129
130
131
132
133
134
135
136
137
138
139
140
141
142
143
144
145
146
147
148
149
150
151
152
153
154
155
156
157
158
159
160
161
162
163
164
165
166
167
168
169
170
171
172
173
174
175
176
177
178
179
180
181
182
183
184
185
186
187
188
189
190
191
192
193
194
195
196
197
198
199
200
201
202
203
204
205
206
207
208
209
210
211
212
                a!gridColumn(
                  label: "Zone 2",
                  value: fv!row.zone2 & "%",
                  backgroundColor: a!match(
                    value: fv!row.zone2,
                    whenTrue: fv!row.zone2 >= 25,
                    then: local!extraHigh,
                    whenTrue: fv!row.zone2 >= 20,
                    then: local!high,
                    whenTrue: fv!row.zone2 >= 15,
                    then: local!medium,
                    whenTrue: fv!row.zone2 >= 10,
                    then: local!low,
                    whenTrue: fv!row.zone2 >= 5,
                    then: local!extraLow,
                    default: local!defaultColor
                  ),
                  align: "END",
                  accessibilityText: a!match(
                    value: fv!row.zone2,
                    whenTrue: fv!row.zone2 >= 25,
                    then: "Extra High",
                    whenTrue: fv!row.zone2 >= 20,
                    then: "High",
                    whenTrue: fv!row.zone2 >= 15,
                    then: "Medium",
                    whenTrue: fv!row.zone2 >= 10,
                    then: "Low",
                    whenTrue: fv!row.zone2 >= 5,
                    then: "Extra Low",
                    default: ""
                  )
                ),
                a!gridColumn(
                  label: "Zone 3",
                  value: fv!row.zone3 & "%",
                  backgroundColor: a!match(
                    value: fv!row.zone3,
                    whenTrue: fv!row.zone3 >= 25,
                    then: local!extraHigh,
                    whenTrue: fv!row.zone3 >= 20,
                    then: local!high,
                    whenTrue: fv!row.zone3 >= 15,
                    then: local!medium,
                    whenTrue: fv!row.zone3 >= 10,
                    then: local!low,
                    whenTrue: fv!row.zone3 >= 5,
                    then: local!extraLow,
                    default: local!defaultColor
                  ),
                  align: "END",
                  accessibilityText: a!match(
                    value: fv!row.zone3,
                    whenTrue: fv!row.zone3 >= 25,
                    then: "Extra High",
                    whenTrue: fv!row.zone3 >= 20,
                    then: "High",
                    whenTrue: fv!row.zone3 >= 15,
                    then: "Medium",
                    whenTrue: fv!row.zone3 >= 10,
                    then: "Low",
                    whenTrue: fv!row.zone3 >= 5,
                    then: "Extra Low",
                    default: ""
                  )
                ),
                a!gridColumn(
                  label: "Zone 4",
                  value: fv!row.zone4 & "%",
                  backgroundColor: a!match(
                    value: fv!row.zone4,
                    whenTrue: fv!row.zone4 >= 25,
                    then: local!extraHigh,
                    whenTrue: fv!row.zone4 >= 20,
                    then: local!high,
                    whenTrue: fv!row.zone4 >= 15,
                    then: local!medium,
                    whenTrue: fv!row.zone4 >= 10,
                    then: local!low,
                    whenTrue: fv!row.zone4 >= 5,
                    then: local!extraLow,
                    default: local!defaultColor
                  ),
                  align: "END",
                  accessibilityText: a!match(
                    value: fv!row.zone4,
                    whenTrue: fv!row.zone4 >= 25,
                    then: "Extra High",
                    whenTrue: fv!row.zone4 >= 20,
                    then: "High",
                    whenTrue: fv!row.zone4 >= 15,
                    then: "Medium",
                    whenTrue: fv!row.zone4 >= 10,
                    then: "Low",
                    whenTrue: fv!row.zone4 >= 5,
                    then: "Extra Low",
                    default: ""
                  )
                ),
                a!gridColumn(
                  label: "Zone 5",
                  value: fv!row.zone5 & "%",
                  backgroundColor: a!match(
                    value: fv!row.zone5,
                    whenTrue: fv!row.zone5 >= 25,
                    then: local!extraHigh,
                    whenTrue: fv!row.zone5 >= 20,
                    then: local!high,
                    whenTrue: fv!row.zone5 >= 15,
                    then: local!medium,
                    whenTrue: fv!row.zone5 >= 10,
                    then: local!low,
                    whenTrue: fv!row.zone5 >= 5,
                    then: local!extraLow,
                    default: local!defaultColor
                  ),
                  align: "END",
                  accessibilityText: a!match(
                    value: fv!row.zone5,
                    whenTrue: fv!row.zone5 >= 25,
                    then: "Extra High",
                    whenTrue: fv!row.zone5 >= 20,
                    then: "High",
                    whenTrue: fv!row.zone5 >= 15,
                    then: "Medium",
                    whenTrue: fv!row.zone5 >= 10,
                    then: "Low",
                    whenTrue: fv!row.zone5 >= 5,
                    then: "Extra Low",
                    default: ""
                  )
                )
              },
              shadeAlternateRows: false
            )
          )
        },
        width: "MEDIUM_PLUS"
      ),
      a!columnLayout(
        contents: {}
      )
    }
  )
}
Copy