
IntroductionCopy link to clipboard
Chart color schemes allow you to select colors from a set of modern and unified color schemes. These color schemes are defined through the colorScheme parameter within each chart.
There are eight color schemes to choose from. You can also create your own custom color scheme using a!colorSchemeCustom within the colorScheme parameter. To configure a custom color scheme, enter valid hex codes or select colors from the color picker. Use a consistent color scheme for all charts in an interface.
To learn more about best practices for using colors in charts, see UX Charts Best Practices.
Chart series colorCopy link to clipboard
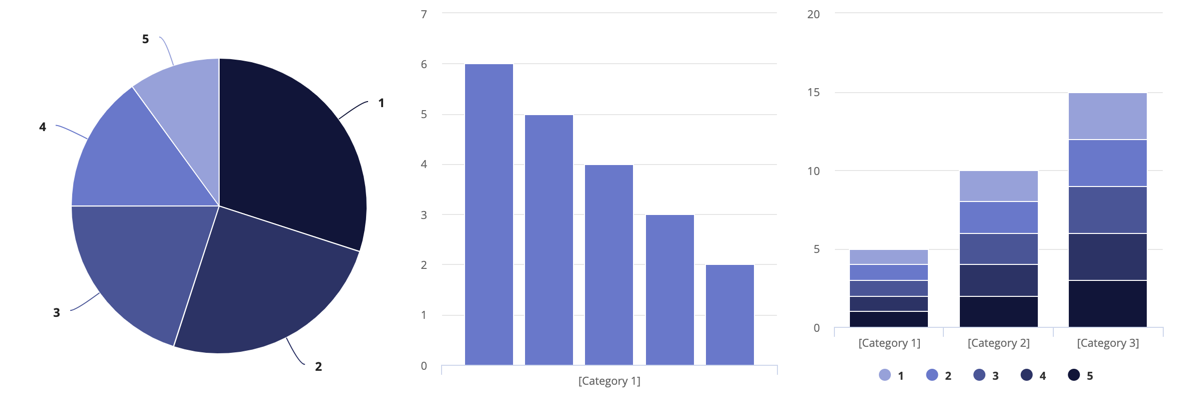
Aside from Classic, each color scheme has five colors. If there are more chart series than colors provided, the colors enumerate through the list again from the beginning.
You can still configure the colors of individual chart series when a color scheme is applied. Any series configurations will take precedence over the assigned color scheme colors.
See Also:
- Line Chart
- Column Chart
- Pie Chart
- Bar Chart
- Chart Series Component
- Chart Custom Color Scheme Component
ExamplesCopy link to clipboard
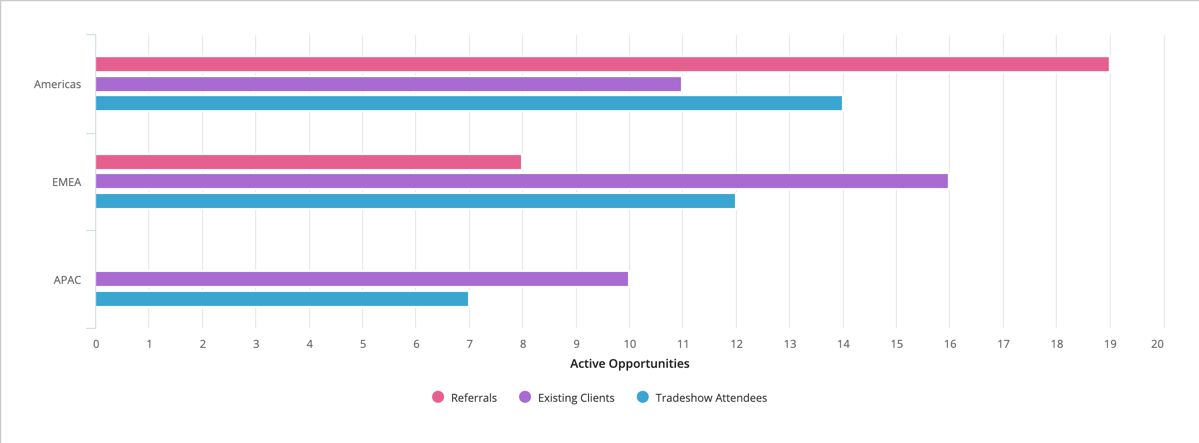
Bar chart using the parachute color schemeCopy link to clipboard
1
2
3
4
5
6
7
8
9
10
11
a!barChartField(
  categories: {"Americas", "EMEA", "APAC"},
  series: {
    a!chartSeries(label: "Referrals", data: {19, 8, null}),
    a!chartSeries(label: "Existing Clients", data: {11, 16, 10}),
    a!chartSeries(label: "Tradeshow Attendees", data: {14, 12, 7})
  },
  colorScheme: "PARACHUTE",
  yAxisTitle: "Active Opportunities",
  showLegend: true
)
Copy
Displays the following:
Line chart using a custom color schemeCopy link to clipboard
1
2
3
4
5
6
7
8
9
10
11
12
13
14
15
16
17
18
19
20
21
22
a!lineChartField(
  label: "Tempo Usage Trends",
  categories: {"Jan", "Feb", "Mar", "Apr", "May", "Jun", "Jul", "Aug", "Sep", "Oct", "Nov", "Dec"},
  series: {
    a!chartSeries(label: "IT", data: {92, 94, 93, 95, 96, 99, 98, 100, 99, 91, 98, 99}),
    a!chartSeries(label: "Human Services", data: {84, 83, 85, 86, 87, 89, 91, 90, 89, 83, 93, 95}),
    a!chartSeries(label: "Sales", data: {70, 63, 90, 72, 74, 74, 76, 89, 72, 65, 100, 85}),
    a!chartSeries(label: "Marketing", data: {80, 80, 80, 90, 90, 90, 90, 90, 90, 70, 90, 90})
  },
  colorScheme: a!colorSchemeCustom(
    colors: {
      "#c27ba0",
      "#93c47d",
      "#8e7cc3",
      "#ffd966",
    }
  ),
  xAxisTitle: "Month",
  yAxisTitle: "% Active",
  yAxisMax: 100,
  showLegend: true
)
Copy
Displays the following:
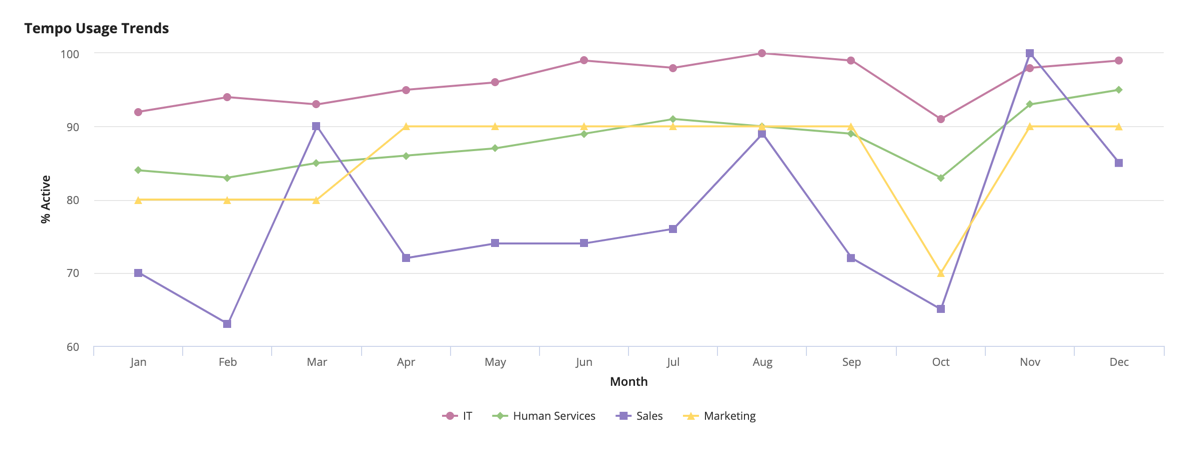
Chart color schemesCopy link to clipboard
MIDNIGHTCopy link to clipboard
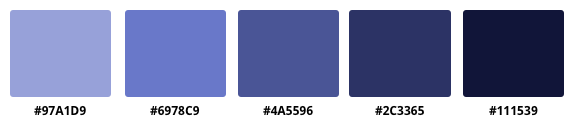
{"#97A1D9", "#6978C9", "#4A5596", "#2C3365", "#111539"}
OCEANCopy link to clipboard
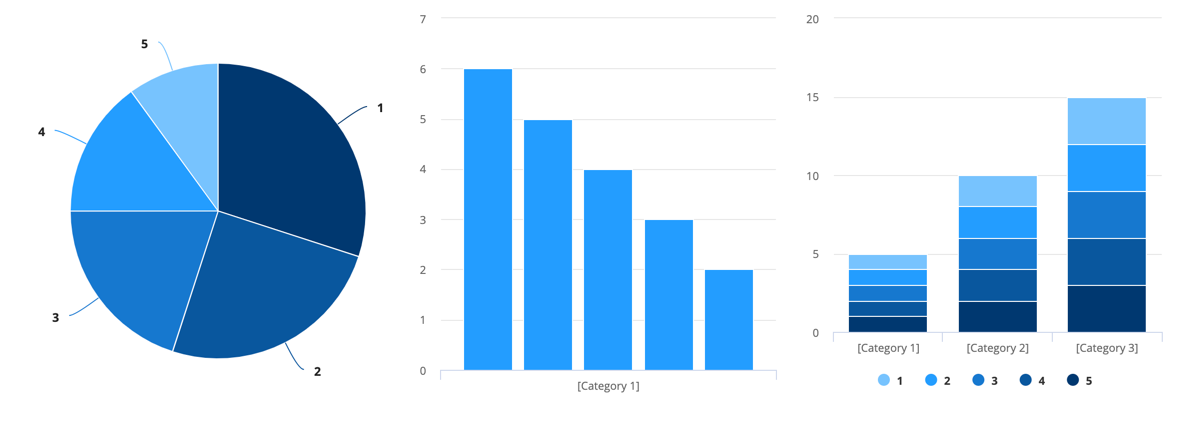
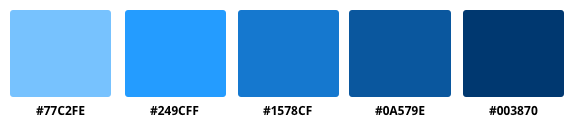
{"#77C2FE", "#249CFF", "#1578CF", "#0A579E", "#003870"}
MOSSCopy link to clipboard
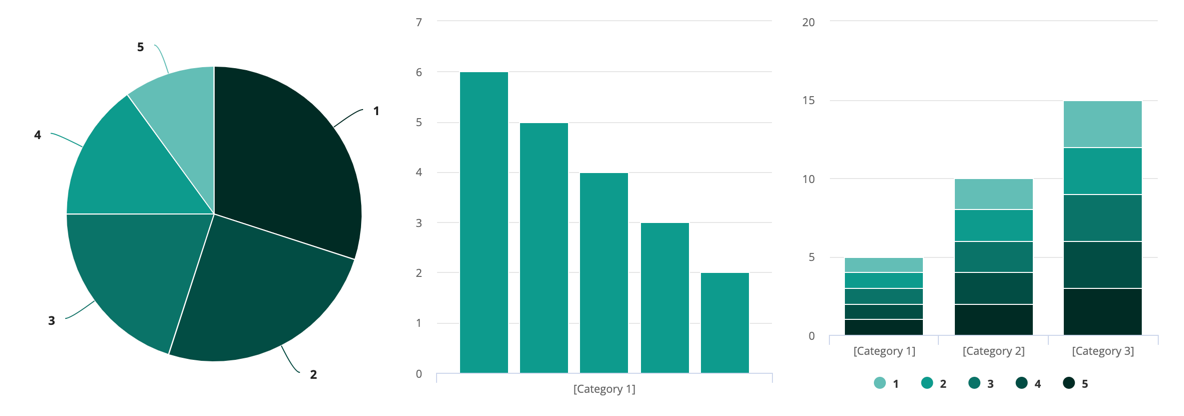
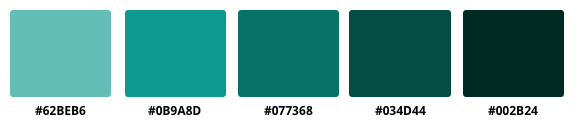
{"#62BEB6", "#0B9A8D", "#077368", "#034D44", "#002B24"}
BERRYCopy link to clipboard
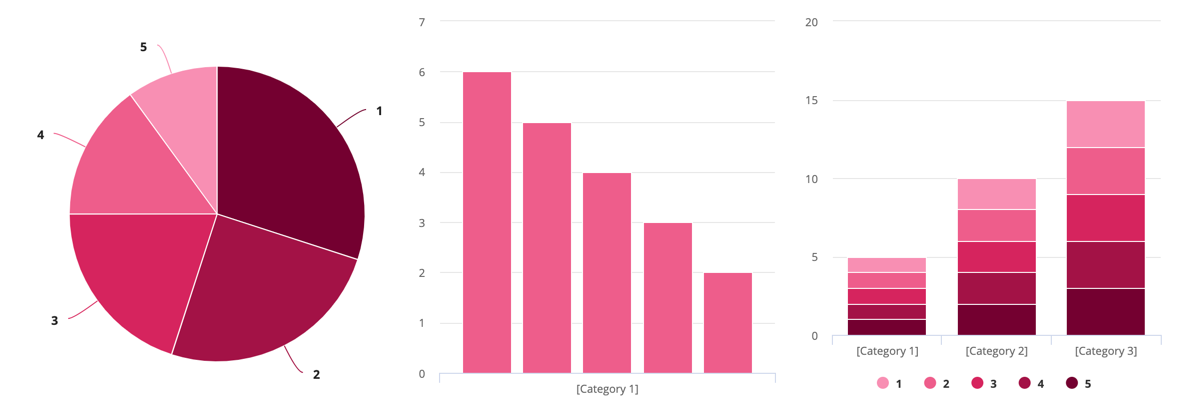
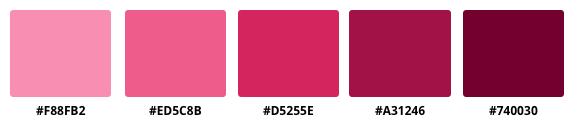
{"#F88FB2", "#ED5C8B", "#D5255E", "#A31246", "#740030"}
PARACHUTECopy link to clipboard
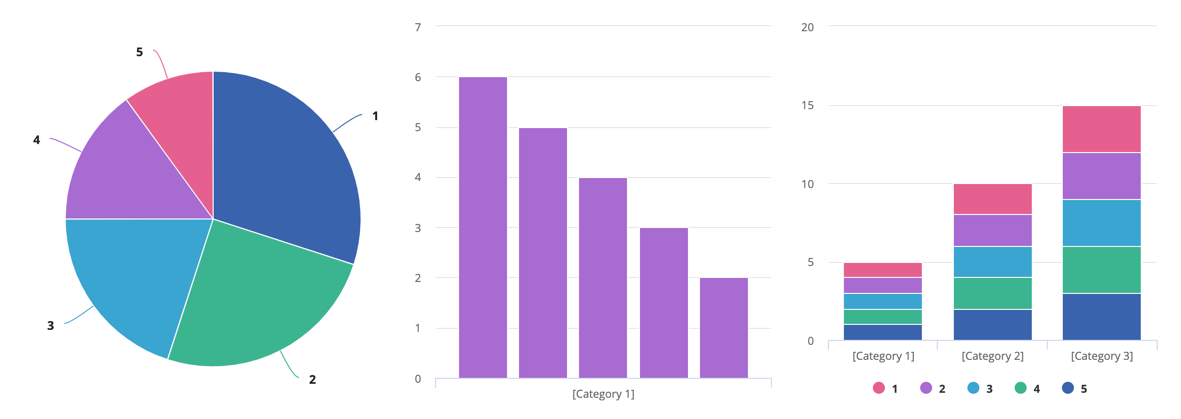
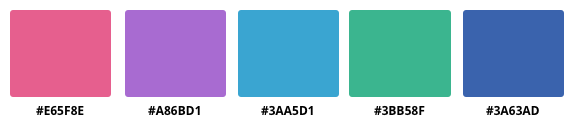
{"#E65F8E", "#A86BD1", "#3AA5D1", "#3BB58F", "#3A63AD"}
RAINFORESTCopy link to clipboard
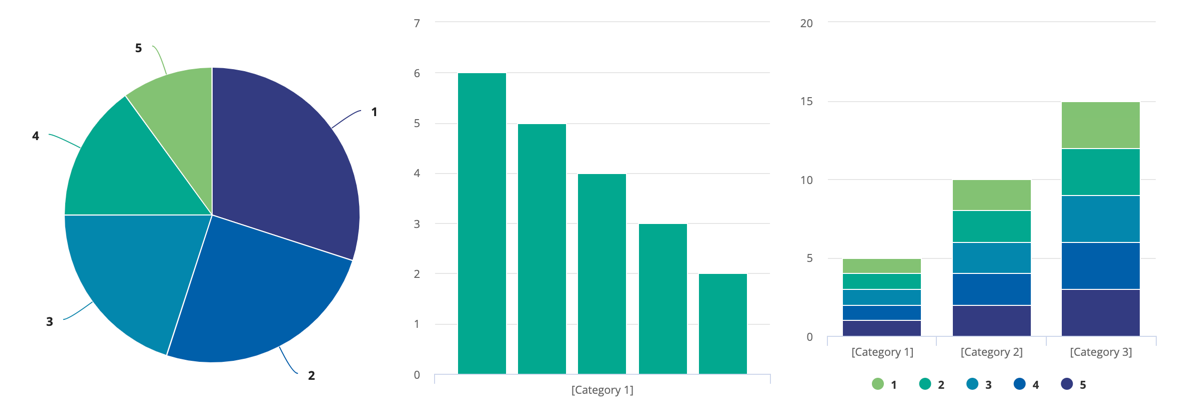
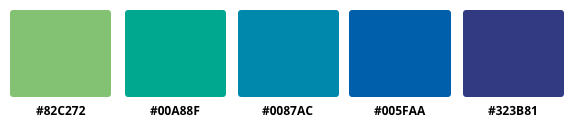
{"#82C272", "#00A88F", "#0087AC", "#005FAA", "#323B81"}
SUNSETCopy link to clipboard
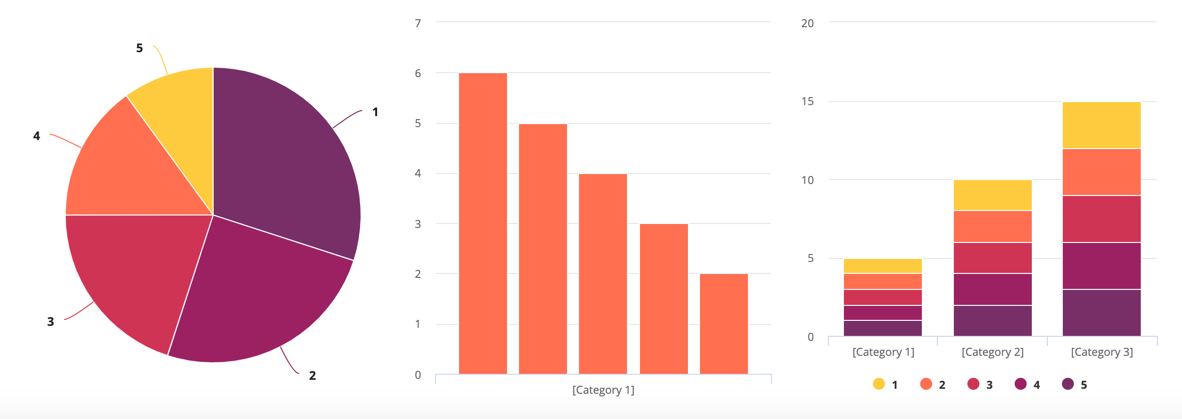
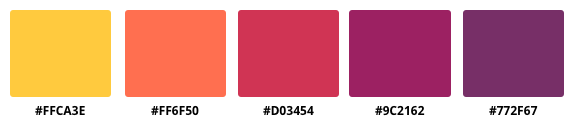
{"#FFCA3E", "#FF6F50", "#D03454", "#9C2162", "#772F67"}
CLASSIC (default)Copy link to clipboard
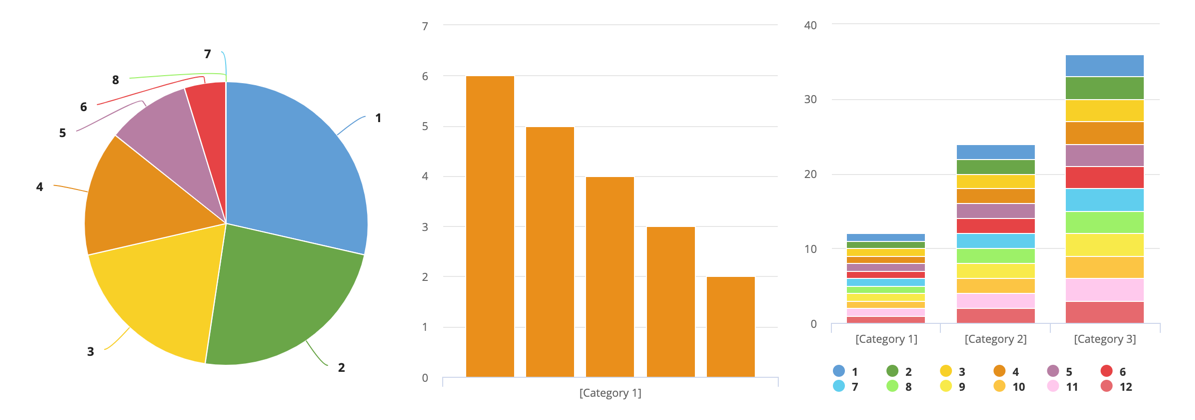
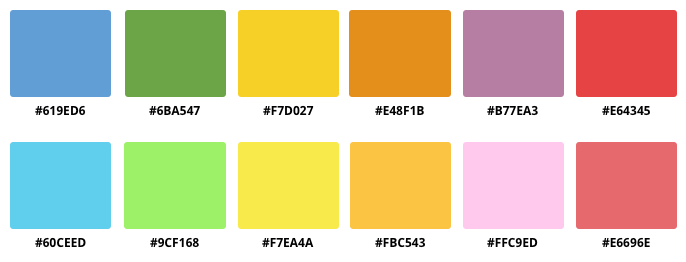
{"#619ED6", "#6BA547", "#F7D027", "#E48F1B", "#B77EA3", "#E64345", "#60CEED", "#9CF168", "#F7EA4A", "#FBC543", "#FFC9ED", "#E6696E"}