This pattern illustrates how to create an area chart that dynamically displays sales generated by product category compared to total sales over the last year. This pattern also provides a sample scenario to show how you can take common business requirements and quickly turn them into a report.
You'll notice that this pattern provides more than just an expression, it shows you the fastest way to build reports in Design Mode. To get the most out of this pattern, follow the steps in Create this pattern to learn how to build advanced reports using the latest low-code features.
Inventory managers at the Appian Retail company want to know how monthly sales were divided among the different product categories to see how their line of products impact overall sales. Since each inventory manager is responsible for a certain product category, they want this report to help them determine if they need to change their inventory strategy to follow sales trends.
To allow different inventory managers to view their own product category sales, you'll use the pattern on this page to create an area chart that can be filtered by product category. This way, users can see their monthly sales for the selected category compared to the total sales generated each month.
The report will look like this:

This pattern uses data from the Appian Retail application, available for free in Appian Community Edition. To follow along with this pattern, log in to Appian Community to request the latest Appian Community Edition site.
If you do not see the Appian Retail application available in your existing Appian Community Edition, you can request a new Appian Community Edition to get the latest application contents available.
This pattern will use data from the following record types in the Appian Retail application:
To create this pattern, you will:
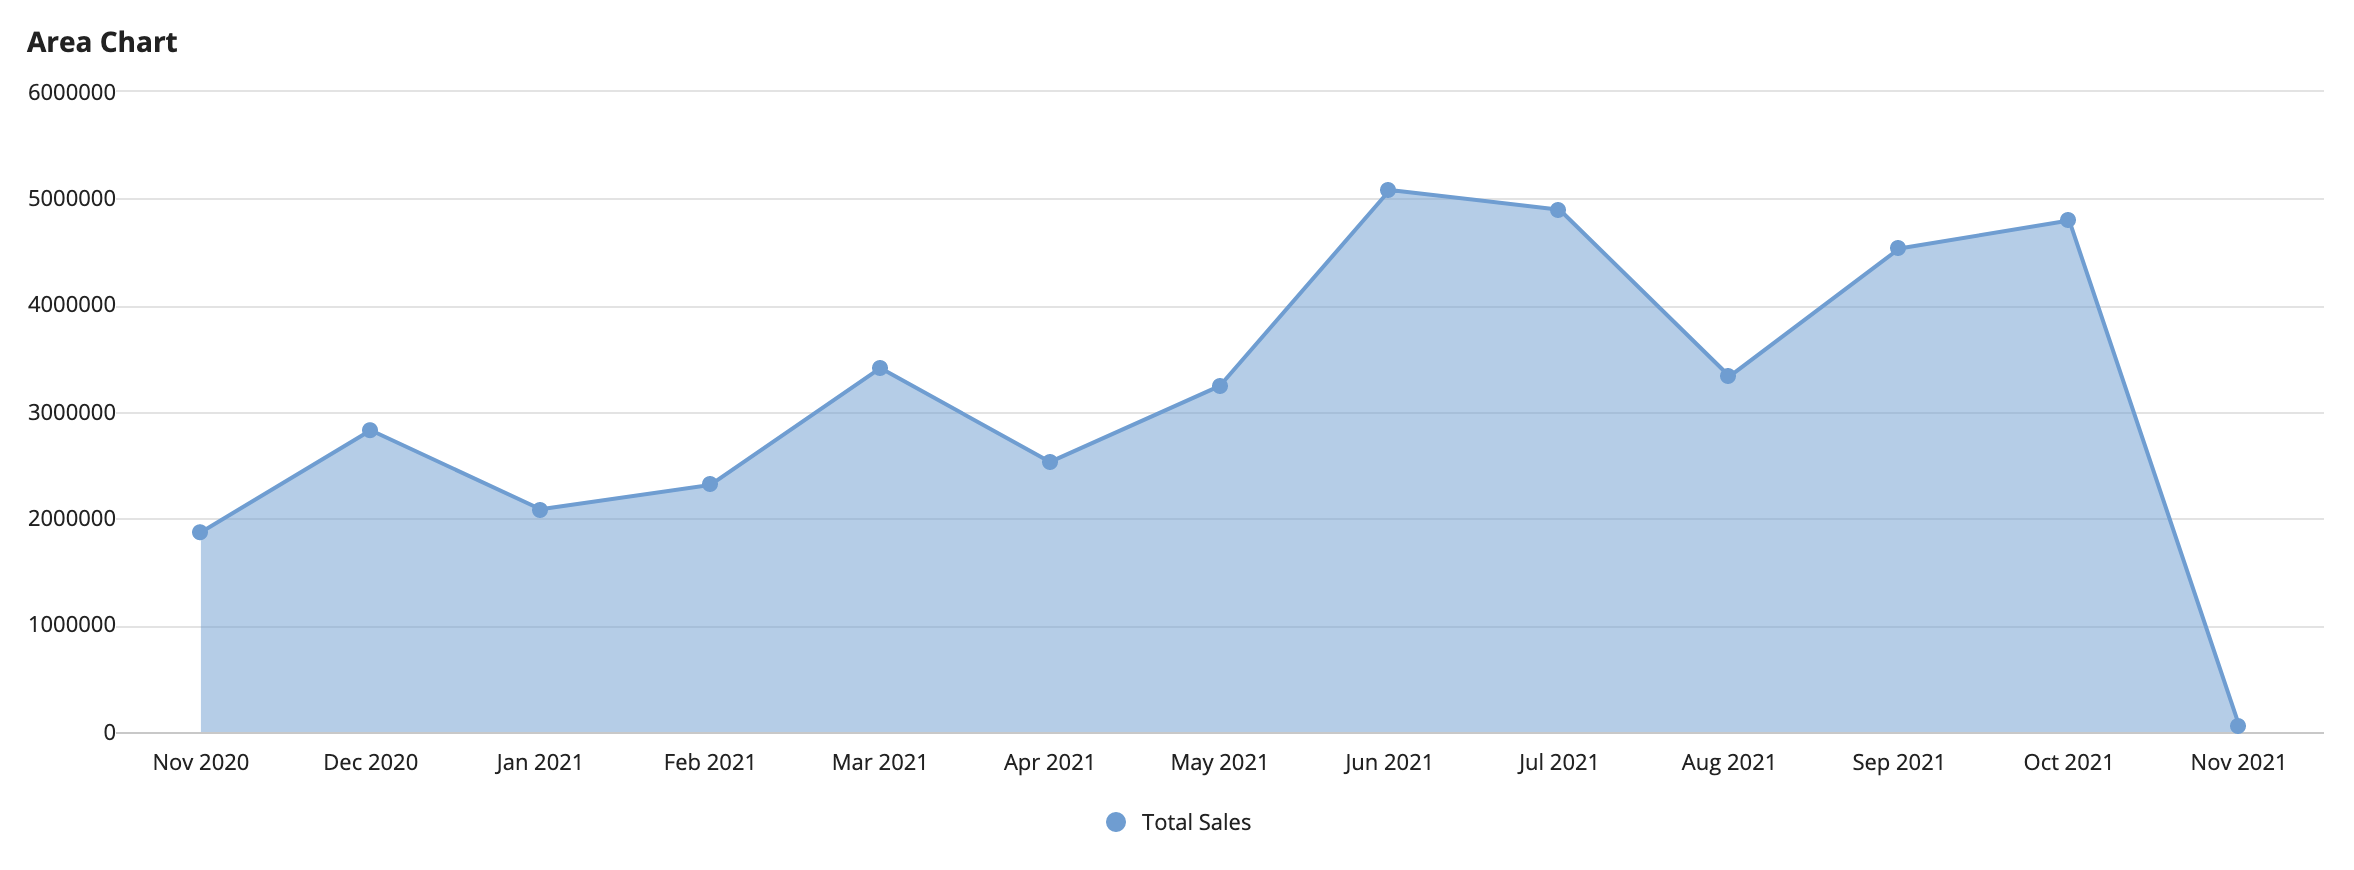
First, we'll create an area chart that shows the total sales generated each month for the last 12 months.
To create the area chart:
Total Sales.Click OK.
Note: Your chart may differ from the image below since the filter in the measure uses the Trailing 12 Months value, which will change the calculation each day.
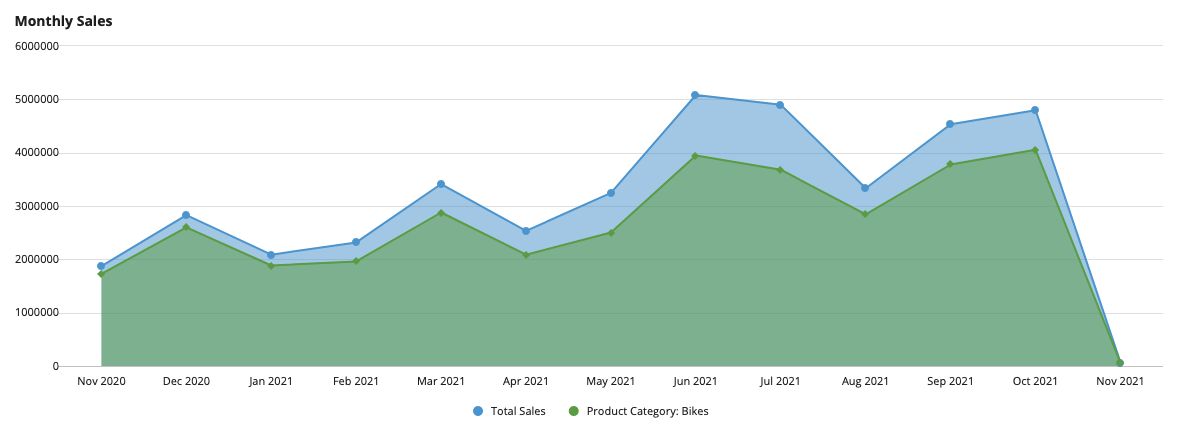
Now, we're going to add a second measure to the area chart. This measure will include a filter so it only displays the sum of sales from orders that have at least one item from the Bikes category.
Tip: Notice that the filter will return the sum of sales from orders with at least one item from the Bikes category. This at least one behavior occurs because there is a one-to-many relationship between where you are aggregating (Order Details) and where you are filtering (Product Category). Learn more about "at least one" filter behavior.
To add the second measure:
Product Category: Bikes.Bikes.Monthly Sales.For Stacking, select None.
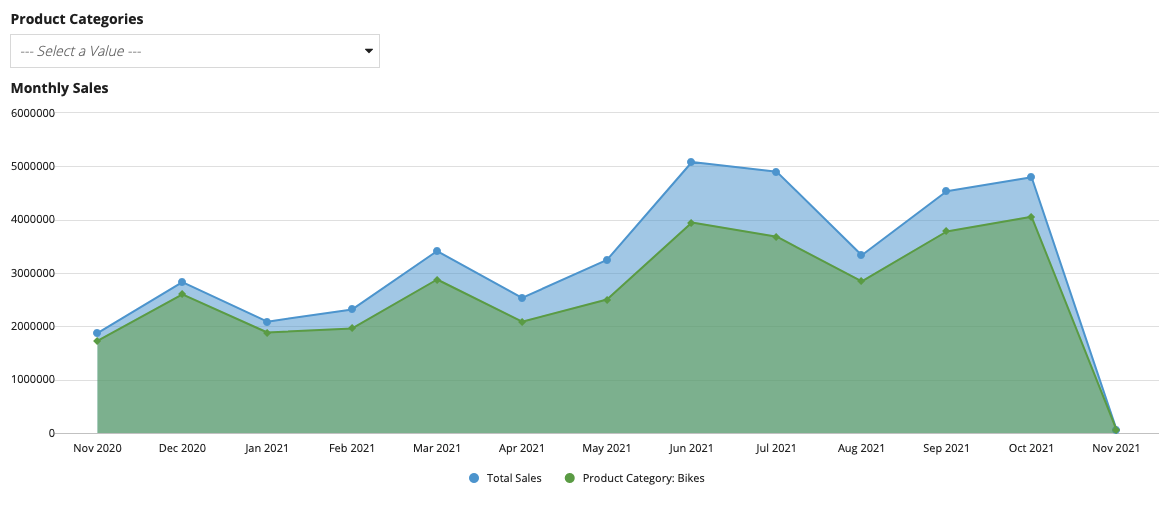
Since inventory managers want to see sales trends for each product category, not just bikes, you'll add a filter that lets users change which product category is displayed in the chart.
To dynamically filter the chart, you'll add a dropdown component and configure a local variable so the selected dropdown option will filter the chart. Let's start by adding the dropdown component.
To add the dropdown component:
Product Categories for the Label.AR_CATEGORIES.1
2
3
4
Bikes
Accessories
Clothing
Components
cons!AR_CATEGORIES appears in the Choice Labels dialog.Note: After you change the Choice Label to use the constant, an error will appear. This is expected since the Choice Label and Choice Values fields currently have different values. The error will resolve itself when you change the Choice Values field to use the same constant.
cons!AR_CATEGORIES.Click OK.
Now that you have a dropdown component, you need to configure a local variable to save the selected dropdown value, then configure a filter on the chart to only display sales by the selected value.
Since you want a category selection to appear on the chart when it first loads, you’ll also add a default value to your local variable.
To add the local variable:
Modify the Interface Definition by making the highlighted changes to the expression:
1
2
3
4
5
6
7
8
9
10
11
12
13
14
15
16
17
18
19
20
21
22
23
24
25
26
27
28
29
30
31
32
33
34
35
36
37
38
39
40
41
42
43
44
45
46
47
48
49
50
51
52
53
54
55
56
57
58
59
60
61
62
63
64
65
66
67
68
69
70
71
72
73
74
75
76
77
78
79
80
81
82
83
84
85
86
87
88
+   a!localVariables(
+   local!category: "Bikes",
       {
         a!columnsLayout(
           columns: {
             a!columnLayout(
               contents: {
                 a!dropdownField(
                   label: "Product Categories",
                   labelPosition: "ABOVE",
                   placeholder: "--- Select a Value ---",
                   choiceLabels: cons!AR_CATEGORIES,
                   choiceValues: cons!AR_CATEGORIES,
                   saveInto: {},
                   searchDisplay: "AUTO",
                   validations: {}
                 )
               }
             ),
             a!columnLayout(contents: {}),
             a!columnLayout(contents: {})
           }
         ),
         a!lineChartField(
           data: a!recordData(
             recordType: 'recordType!{ad898682-e651-4b2d-af67-47c1fcb1171f}Order',
             filters: a!queryLogicalExpression(
               operator: "AND",
               filters: {
                 a!queryFilter(
                   field: 'recordType!{ad898682-e651-4b2d-af67-47c1fcb1171f}Order.fields.{fbcc99f6-1ddf-4923-903b-18122a1737c6}orderDate',
                   operator: "between",
                   value: /* Trailing 12 Months */toDatetime(
                     {
                       eomonth(today(), - 13) + 1,
                       eomonth(today(), - 1) + 1
                     }
                   )
                 )
               },
               ignoreFiltersWithEmptyValues: true
             )
           ),
           config: a!lineChartConfig(
             primaryGrouping: a!grouping(
               field: 'recordType!{ad898682-e651-4b2d-af67-47c1fcb1171f}Order.fields.{fbcc99f6-1ddf-4923-903b-18122a1737c6}orderDate',
               alias: "orderDate_month_primaryGrouping",
               interval: "MONTH_SHORT_TEXT"
             ),
             measures: {
               a!measure(
                 label: "Total Sales",
                 function: "SUM",
                 field: 'recordType!{ad898682-e651-4b2d-af67-47c1fcb1171f}Order.relationships.{0bde4028-fd7a-411f-97ad-7ad5b84e0d18}orderDetail.fields.{db456082-5f77-4765-bc3e-f662651e0d52}lineTotal',
                 alias: "lineTotal_sum_measure1"
               ),
               a!measure(
                 label: "Product Category: Bikes",
                 function: "SUM",
                 field: 'recordType!{ad898682-e651-4b2d-af67-47c1fcb1171f}Order.relationships.{0bde4028-fd7a-411f-97ad-7ad5b84e0d18}orderDetail.fields.{db456082-5f77-4765-bc3e-f662651e0d52}lineTotal',
                 filters: a!queryLogicalExpression(
                   operator: "AND",
                   filters: {
                     a!queryFilter(
                       field: 'recordType!{bec4a875-9980-4bbf-a38c-c492ebed065a}Order Detail.relationships.{eee8c0a6-46b0-4cb7-9faf-be492400cc41}product.relationships.{d3a62d4a-3268-48dc-9563-3b99c33715d1}productSubcategory.relationships.{61e25c34-c4ba-4315-8da4-b2ed06d9b5ae}productCategory.fields.{963f051f-baea-4a23-8481-e365bf972a74}name',
                       operator: "=",
                       value: "Bikes"
                     )
                   },
                   ignoreFiltersWithEmptyValues: true
                 ),
                 alias: "lineTotal_sum_measure2"
               )
             },
             dataLimit: 100
           ),
           label: "Monthly Sales ",
           labelPosition: "ABOVE",
           showLegend: true,
           showTooltips: true,
           colorScheme: "CLASSIC",
           height: "MEDIUM",
           xAxisStyle: "STANDARD",
           yAxisStyle: "STANDARD",
           refreshAfter: "RECORD_ACTION"
         )
       }
+   )
Now that you have a local variable to store the selected category, we can update the dropdown component to use local!category as the saveInto value, and add a filter using local!category to filter the chart by category.
To use the local variable to filter the chart:
In the a!dropdownField() configuration (line 8), add the following parameter and values highlighted below:
1
2
3
4
5
6
7
8
9
10
11
 a!dropdownField(
     label: "Product Categories",
     labelPosition: "ABOVE",
     placeholder: `"--- Select a category ---"`,
     choiceLabels: cons!AR_CATEGORIES,
     choiceValues: cons!AR_CATEGORIES,
+    value: local!category,
     saveInto: `local!category`,
     searchDisplay: "AUTO",
     validations: {}
 )
a!areaChartConfig() configuration (line 44), update the following values highlighted below:
1
2
3
4
5
6
7
8
9
10
11
12
13
14
15
16
17
18
19
20
21
22
23
24
25
26
27
28
29
30
31
32
 ...
 config: a!areaChartConfig(
   primaryGrouping: a!grouping(
     field: 'recordType!{ad898682-e651-4b2d-af67-47c1fcb1171f}Order.fields.{fbcc99f6-1ddf-4923-903b-18122a1737c6}orderDate',
     alias: "orderDate_month_primaryGrouping",
     interval: "MONTH_TEXT"
   ),
   measures: {
     a!measure(
       label: "Total Sales",
       function: "SUM",
       field: 'recordType!{ad898682-e651-4b2d-af67-47c1fcb1171f}Order.relationships.{0bde4028-fd7a-411f-97ad-7ad5b84e0d18}orderDetail.fields.{db456082-5f77-4765-bc3e-f662651e0d52}lineTotal',
       alias: "lineTotal_sum_measure1"
     ),
     a!measure(
       label: `"Product Category: " & local!category`,
       function: "SUM",
       field: 'recordType!{ad898682-e651-4b2d-af67-47c1fcb1171f}Order.relationships.{0bde4028-fd7a-411f-97ad-7ad5b84e0d18}orderDetail.fields.{db456082-5f77-4765-bc3e-f662651e0d52}lineTotal',
         filters: a!queryLogicalExpression(
           operator: "AND",
           filters: {
             a!queryFilter(
               field: 'recordType!{bec4a875-9980-4bbf-a38c-c492ebed065a}Order Detail.relationships.{eee8c0a6-46b0-4cb7-9faf-be492400cc41}product.relationships.{d3a62d4a-3268-48dc-9563-3b99c33715d1}productSubcategory.relationships.{61e25c34-c4ba-4315-8da4-b2ed06d9b5ae}productCategory.fields.{963f051f-baea-4a23-8481-e365bf972a74}name',
               operator: "=",
               value: `local!category`
             )
           },
           ignoreFiltersWithEmptyValues: true
         ),
         alias: "lineTotal_sum_measure2"
     )
   ...
The dropdown now filters the product sales displayed on the chart.
The resulting expression will look like this:
Note: To copy and paste this expression into an interface in the Appian Retail application, you must complete step 3 to create the constant used in the dropdown component.
1
2
3
4
5
6
7
8
9
10
11
12
13
14
15
16
17
18
19
20
21
22
23
24
25
26
27
28
29
30
31
32
33
34
35
36
37
38
39
40
41
42
43
44
45
46
47
48
49
50
51
52
53
54
55
56
57
58
59
60
61
62
63
64
65
66
67
68
69
70
71
72
73
74
75
76
77
78
79
80
81
82
83
84
85
86
87
88
89
90
91
a!localVariables(
  local!category: "Bikes",
  {
    a!columnsLayout(
      columns: {
        a!columnLayout(
          contents: {
            a!dropdownField(
              label: "Product Categories",
              labelPosition: "ABOVE",
              placeholder: "--- Select a category ---",
              choiceLabels: cons!AR_CATEGORIES,
              choiceValues: cons!AR_CATEGORIES,
              value: local!category,
              saveInto: local!category,
              searchDisplay: "AUTO",
              validations: {}
            )
          }
        ),
        a!columnLayout(contents: {}),
        a!columnLayout(contents: {})
      }
    ),
    a!areaChartField(
      data: a!recordData(
        recordType: 'recordType!{ad898682-e651-4b2d-af67-47c1fcb1171f}Order',
        filters: a!queryLogicalExpression(
          operator: "AND",
          filters: {
            a!queryFilter(
              field: 'recordType!{ad898682-e651-4b2d-af67-47c1fcb1171f}Order.fields.{fbcc99f6-1ddf-4923-903b-18122a1737c6}orderDate',
              operator: "between",
              value: /* Trailing 12 Months */toDatetime(
                {
                  eomonth(today(), - 13) + 1,
                  eomonth(today(), - 1) + 1
                }
              )
            )
          },
          ignoreFiltersWithEmptyValues: true
        )
      ),
      config: a!areaChartConfig(
        primaryGrouping: a!grouping(
          field: 'recordType!{ad898682-e651-4b2d-af67-47c1fcb1171f}Order.fields.{fbcc99f6-1ddf-4923-903b-18122a1737c6}orderDate',
          alias: "orderDate_month_primaryGrouping",
          interval: "MONTH_SHORT_TEXT"
        ),
        measures: {
          a!measure(
            label: "Total Sales",
            function: "SUM",
            field: 'recordType!{ad898682-e651-4b2d-af67-47c1fcb1171f}Order.relationships.{0bde4028-fd7a-411f-97ad-7ad5b84e0d18}orderDetail.fields.{db456082-5f77-4765-bc3e-f662651e0d52}lineTotal',
            alias: "lineTotal_sum_measure1"
          ),
          a!measure(
            label: "Product Category: " & local!category,
            function: "SUM",
            field: 'recordType!{ad898682-e651-4b2d-af67-47c1fcb1171f}Order.relationships.{0bde4028-fd7a-411f-97ad-7ad5b84e0d18}orderDetail.fields.{db456082-5f77-4765-bc3e-f662651e0d52}lineTotal',
            filters: a!queryLogicalExpression(
              operator: "AND",
              filters: {
                a!queryFilter(
                  field: 'recordType!{bec4a875-9980-4bbf-a38c-c492ebed065a}Order Detail.relationships.{eee8c0a6-46b0-4cb7-9faf-be492400cc41}product.relationships.{d3a62d4a-3268-48dc-9563-3b99c33715d1}productSubcategory.relationships.{61e25c34-c4ba-4315-8da4-b2ed06d9b5ae}productCategory.fields.{963f051f-baea-4a23-8481-e365bf972a74}name',
                  operator: "=",
                  value: local!category
                )
              },
              ignoreFiltersWithEmptyValues: true
            ),
            alias: "lineTotal_sum_measure2"
          )
        },
        dataLimit: 100,
        showIntervalsWithNoData: true
      ),
      label: "Monthly Sales",
      labelPosition: "ABOVE",
      stacking: "NONE",
      showLegend: true,
      showTooltips: true,
      colorScheme: "CLASSIC",
      height: "MEDIUM",
      xAxisStyle: "STANDARD",
      yAxisStyle: "STANDARD",
      refreshAfter: "RECORD_ACTION"
    )
  }
)
Dynamically Show Sales by Product Category Compared to Total Sales
