This pattern illustrates how to create a bar chart that shows sales per sales region. This pattern also provides a sample scenario to show how you can take common business requirements and quickly turn them into a report.
You'll notice that this pattern provides more than just an expression, it shows you the fastest way to build reports in Design Mode. To get the most out of this pattern, follow the steps in Create this pattern to learn how to build advanced reports using the latest low-code features.
Sales executives at the Appian Retail company want to know which global sales regions have the highest sales numbers so they can hire more employees and dedicate more resources to high-performance areas.
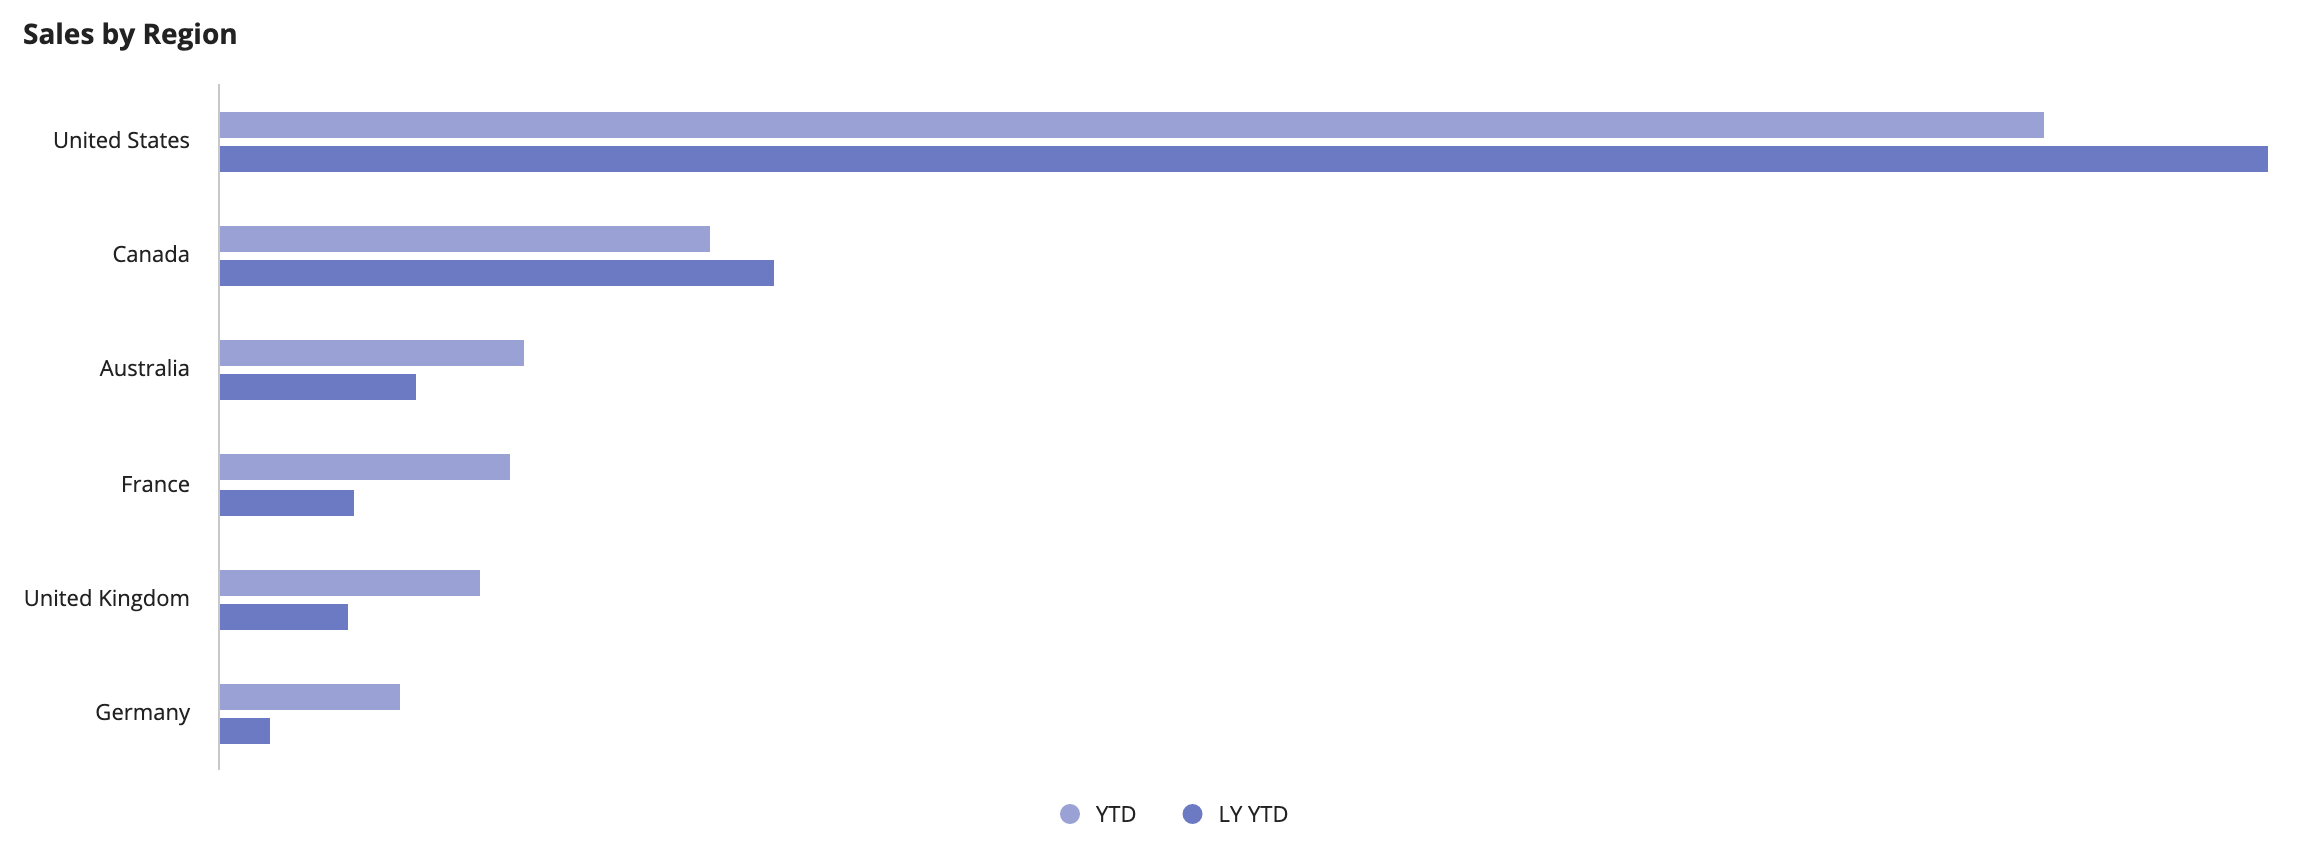
To show the sales regions with the highest sales, you'll use the pattern on this page to create a bar chart that displays the sum of sales generated by each sales region this year. To see if sales have improved for certain regions, you'll also show the sum of sales generated by each region last year.
The report will look like this:

This pattern uses data from the Appian Retail application, available for free in Appian Community Edition. To follow along with this pattern, log in to Appian Community to request the latest Appian Community Edition site.
If you do not see the Appian Retail application available in your existing Appian Community Edition, you can request a new Appian Community Edition to get the latest application contents available.
This pattern will use data from the following record types in the Appian Retail application:
To create this pattern:
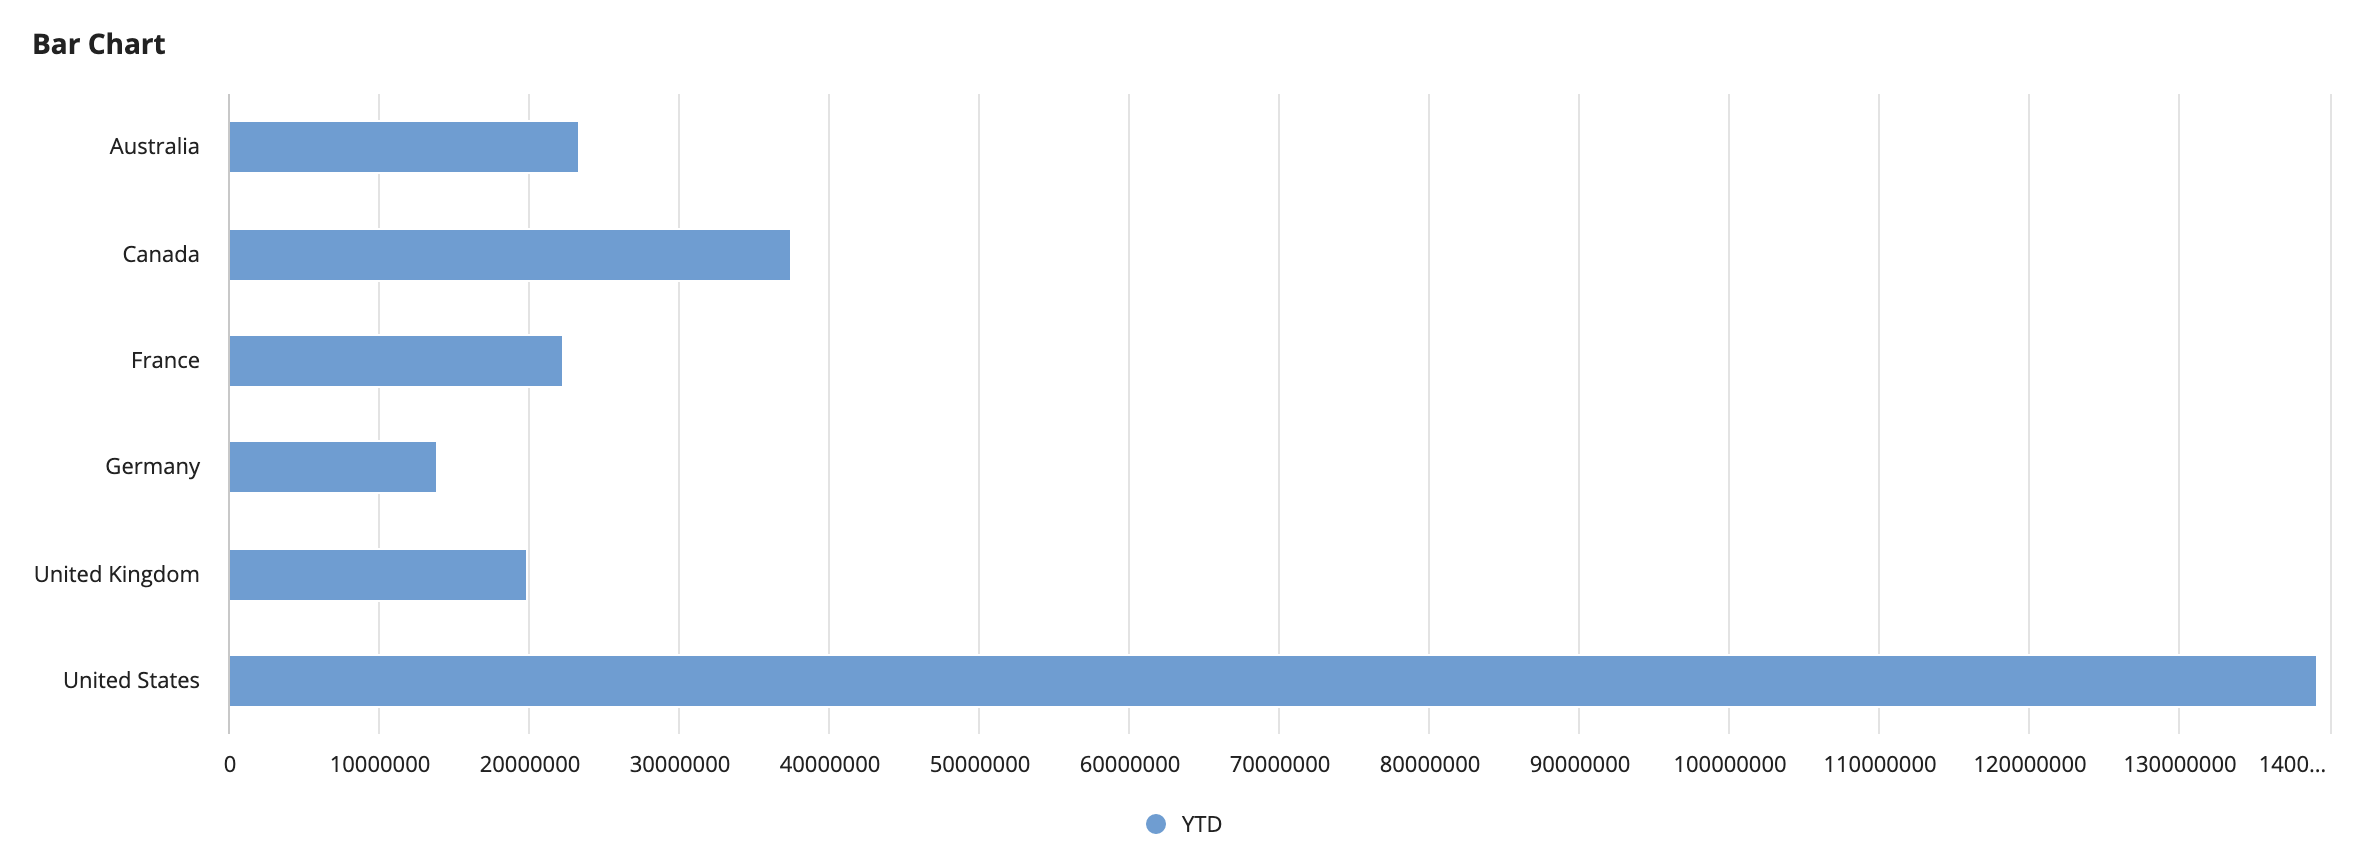
To create the bar chart for this pattern:
YTD. This will represent the year-to-date sales.ytd.Click OK.
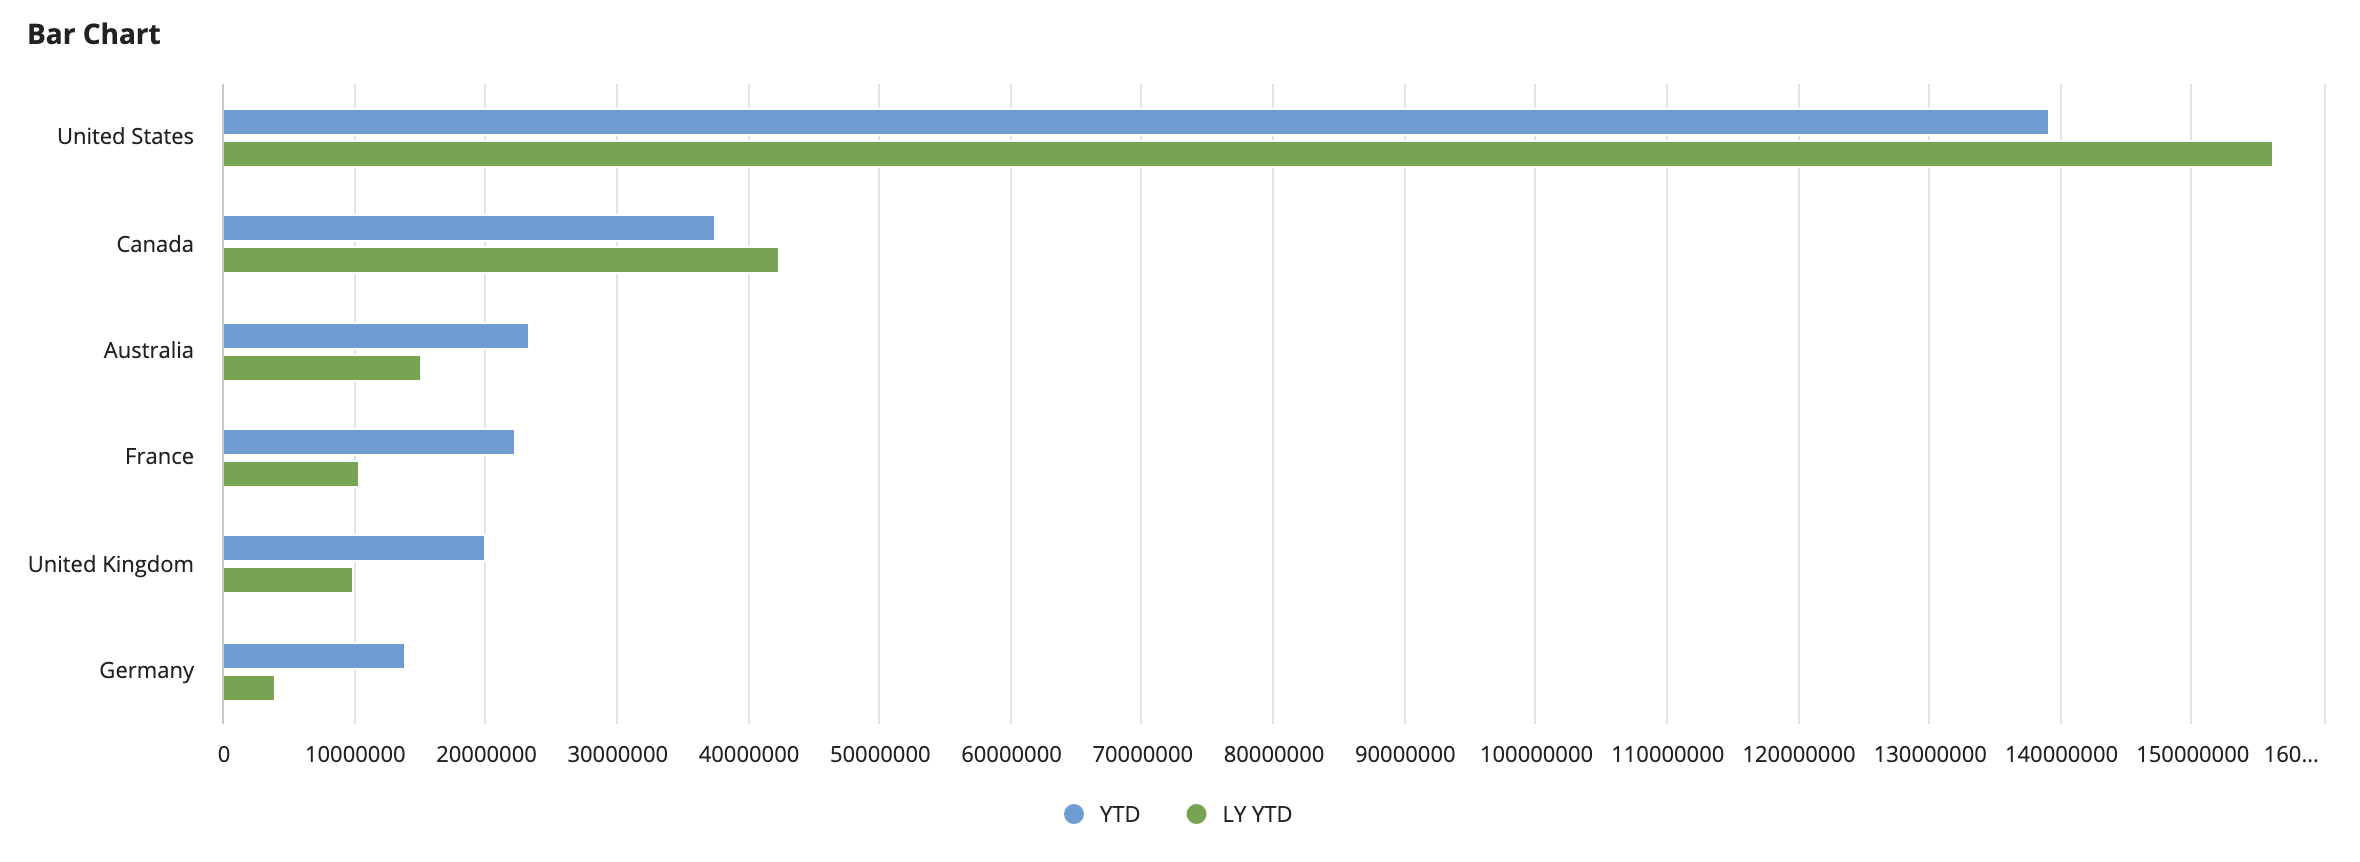
The chart currently displays the sum of sales from orders placed at the beginning of the year to today. Now, you're going to add a second measure with a different filter so it displays the sum of sales from orders placed at the beginning of last year to today's date last year.
To add last year's sales:
LY YTD. This will represent last year's year-to-date sales.lytd.Click OK.

To allow executives to quickly see the top performing sales regions, you'll sort the chart by the highest sales this year.
To sort the chart:
For Order, keep the default selection of Descending.
In this last step, you'll add a chart label, change the color scheme, and hide the Y-Axis labels since they are truncated.
To format the chart:
Sales by Region.For Y-Axis Style, choose None.
The resulting expression will look like this:
Note: You can copy and paste this expression into an interface in the Appian Retail application to see the fully configured pattern.
These record type references are specific to the Appian Retail application, so you will only need to replace the record field references if you're following along in a different environment.
1
2
3
4
5
6
7
8
9
10
11
12
13
14
15
16
17
18
19
20
21
22
23
24
25
26
27
28
29
30
31
32
33
34
35
36
37
38
39
40
41
42
43
44
45
46
47
48
49
50
51
52
53
54
55
56
57
58
59
60
61
62
{
  a!barChartField(
    data: 'recordType!{c25947c0-2230-41cb-86a6-bd86d14d0af9}Sales Region',
    config: a!barChartConfig(
      primaryGrouping: a!grouping(
        field: 'recordType!{c25947c0-2230-41cb-86a6-bd86d14d0af9}Sales Region.relationships.{0ea75675-bc93-491c-8cc2-3c74668c96d3}country.fields.{85846423-5eb5-46c0-ac1a-263e4f522be7}name',
        alias: "name_primaryGrouping"
      ),
      measures: {
        a!measure(
          label: "YTD",
          function: "SUM",
          field: 'recordType!{c25947c0-2230-41cb-86a6-bd86d14d0af9}Sales Region.relationships.{91b8d190-173e-407a-bf9b-e42e8e32a437}order.relationships.{0bde4028-fd7a-411f-97ad-7ad5b84e0d18}orderDetail.fields.{db456082-5f77-4765-bc3e-f662651e0d52}lineTotal',
          filters: a!queryLogicalExpression(
            operator: "AND",
            filters: {
              a!queryFilter(
                field: 'recordType!{bec4a875-9980-4bbf-a38c-c492ebed065a}Order Detail.relationships.{e6b1dbca-6c3c-4540-a093-3c581a73ad17}order.fields.{fbcc99f6-1ddf-4923-903b-18122a1737c6}orderDate',
                operator: "between",
                value: /* Year-to-Date */{ datetime(year(today()), 1, 1), now() }
              )
            },
            ignoreFiltersWithEmptyValues: true
          ),
          alias: "ytd"
        ),
        a!measure(
          label: "LY YTD",
          function: "SUM",
          field: 'recordType!{c25947c0-2230-41cb-86a6-bd86d14d0af9}Sales Region.relationships.{91b8d190-173e-407a-bf9b-e42e8e32a437}order.relationships.{0bde4028-fd7a-411f-97ad-7ad5b84e0d18}orderDetail.fields.{db456082-5f77-4765-bc3e-f662651e0d52}lineTotal',
          filters: a!queryLogicalExpression(
            operator: "AND",
            filters: {
              a!queryFilter(
                field: 'recordType!{bec4a875-9980-4bbf-a38c-c492ebed065a}Order Detail.relationships.{e6b1dbca-6c3c-4540-a093-3c581a73ad17}order.fields.{fbcc99f6-1ddf-4923-903b-18122a1737c6}orderDate',
                operator: "between",
                value: /* Previous Year-to-Date (From Beginning of Last Year to Today Last Year) */{
                  datetime(year(today()) - 1, 1, 1),
                  edate(today(), - 12) + (now() - today())
                }
              )
            },
            ignoreFiltersWithEmptyValues: true
          ),
          alias: "lytd"
        )
      },
      sort: { a!sortInfo(field: "ytd") },
      dataLimit: 100
    ),
    label: "Sales by Region",
    labelPosition: "ABOVE",
    stacking: "NONE",
    showLegend: true,
    showTooltips: true,
    colorScheme: "MIDNIGHT",
    height: "MEDIUM",
    xAxisStyle: "STANDARD",
    yAxisStyle: "NONE",
    refreshAfter: "RECORD_ACTION"
  )
}
Sales by Region
