This pattern illustrates how to calculate year-over-year sales growth and display it in a KPI. This pattern also provides a sample scenario to show how you can take common business requirements and quickly turn them into a report.
You'll notice that this pattern provides more than just an expression, it shows you the fastest way to build reports in Design Mode. To get the most out of this pattern, follow the steps in Create this pattern to learn how to build advanced reports using the latest low-code features.
Sales executives at the Appian Retail company want to know how their sales this year compared to last year so they can see, overall, how business is doing. Specifically, they need to know if business has grown over the last before they decide to expand existing product lines. If business has not grown, this may indicate that they need to shift their existing product strategy before expanding to new ones.
To show how sales compare to last year's sales, you'll use the pattern on this page to calculate the company's year-over-year sales growth and display that value as a key performance indicator (KPI).
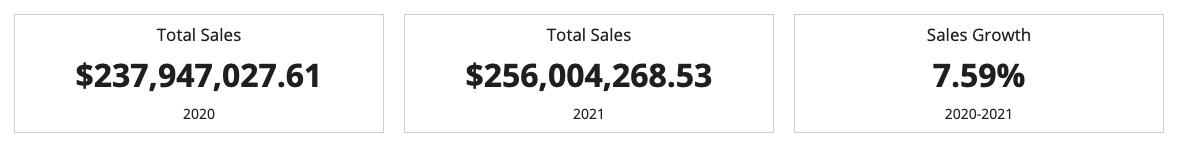
The report will look like this:

This pattern uses data from the Appian Retail application, available for free in Appian Community Edition. To follow along with this pattern, log in to Appian Community to request the latest Appian Community Edition site.
If you do not see the Appian Retail application available in your existing Appian Community Edition, you can request a new Appian Community Edition to get the latest application contents available.
This pattern will use data from the following record types in the Appian Retail application:
To create this pattern:
Sales growth is a common business metric that measures how quickly a company is growing its sales over a period of time. It's measured as a percentage using the following formula:
[(Sales for the current period - Sales for the previous period) / Sales for the previous period] x 100
To create this formula, you first need to calculate the sum of sales for this year and last year. You'll use the a!queryRecordType() function to calculate these values and store those values in two different local variables.
Once you have those variables, you can plug them into the sales growth formula and store the results in another local variable for easy reuse throughout the interface.
To calculate sales growth:
Copy and paste the following expression:
Note: These record type references are specific to the Appian Retail application. If you're following along in the Appian Retail application, you can copy and paste this expression without updating the record type references.
1
2
3
4
5
6
7
8
9
10
11
12
13
14
15
16
17
18
19
20
21
22
23
24
25
26
27
28
29
30
31
32
33
34
35
36
37
38
39
40
41
42
43
44
45
46
47
48
49
50
51
52
53
54
55
56
57
58
59
60
61
62
63
64
65
66
67
68
69
70
71
72
73
74
75
76
77
78
79
80
81
 a!localVariables(
   /* Calculate the sum of sales for orders placed this year */
   local!salesThisYear: a!queryRecordType(
     recordType: 'recordType!{ad898682-e651-4b2d-af67-47c1fcb1171f}Order',
     filters: a!queryFilter(
       field: 'recordType!{ad898682-e651-4b2d-af67-47c1fcb1171f}Order.fields.{fbcc99f6-1ddf-4923-903b-18122a1737c6}orderDate',
       operator: "BETWEEN",
       value: {
         /* Beginning of the year */
         eomonth(today(), - month(today())) + 1,
         now()
       }
     ),
     fields: a!aggregationFields(
       /* Group by order date year */
       groupings: a!grouping(
         field: 'recordType!{ad898682-e651-4b2d-af67-47c1fcb1171f}Order.fields.{fbcc99f6-1ddf-4923-903b-18122a1737c6}orderDate',
         alias: "orderDate",
         interval: "YEAR"
       ),
       /* Get the sum of line total for all order items */
       measures: a!measure(
         field: 'recordType!{ad898682-e651-4b2d-af67-47c1fcb1171f}Order.relationships.{0bde4028-fd7a-411f-97ad-7ad5b84e0d18}orderDetail.fields.{db456082-5f77-4765-bc3e-f662651e0d52}lineTotal',
         function: "SUM",
         alias: "sumOfOrders"
       )
     ),
     pagingInfo: a!pagingInfo(startIndex: 1, batchSize: 500)
   ).data,
   /* Calculate the sum of sales for orders placed last year */
   local!salesLastYear: a!queryRecordType(
     recordType: 'recordType!{ad898682-e651-4b2d-af67-47c1fcb1171f}Order',
     filters: a!queryFilter(
       field: 'recordType!{ad898682-e651-4b2d-af67-47c1fcb1171f}Order.fields.{fbcc99f6-1ddf-4923-903b-18122a1737c6}orderDate',
       operator: "BETWEEN",
       value: {
         /*Beginning of the year - Last year*/
         datetime(
           year(eomonth(today(), - month(today())) + 1) - 1,
           1,
           1
         ),
         /*Today - Last year */
         datetime(
           year(today()) - 1,
           month(today()),
           day(today())
         )
       }
     ),
     fields: a!aggregationFields(
       /* Group by order date year */
       groupings: a!grouping(
         field: 'recordType!{ad898682-e651-4b2d-af67-47c1fcb1171f}Order.fields.{fbcc99f6-1ddf-4923-903b-18122a1737c6}orderDate',
         alias: "orderDate",
         interval: "YEAR"
       ),
       /* Get the sum of line total for all order items */
       measures: a!measure(
         field: 'recordType!{ad898682-e651-4b2d-af67-47c1fcb1171f}Order.relationships.{0bde4028-fd7a-411f-97ad-7ad5b84e0d18}orderDetail.fields.{db456082-5f77-4765-bc3e-f662651e0d52}lineTotal',
         function: "SUM",
         alias: "sumOfOrders"
       )
     ),
     pagingInfo: a!pagingInfo(startIndex: 1, batchSize: 500)
   ).data,
   /* Sales growth calculation */
   local!salesGrowth: (
     local!salesThisYear.sumOfOrders - local!salesLastYear.sumOfOrders
   ) / local!salesLastYear.sumOfOrders * 100,
   /* Column layout that we'll use for our KPIs */
   {
     a!columnsLayout(
       columns: {
         a!columnLayout(contents: {}),
         a!columnLayout(contents: {}),
         a!columnLayout(contents: {})
       }
     )
   }
 )
Now that you have the sales growth percentage, you can display this value as a KPI in the interface. To create the KPI, you'll use a card layout to display the sales growth percentage and add two labels.
To display sales growth in a KPI:
Replace the existing expression with the following expression. This will round the sales growth value to the second decimal place, and display a percentage sign.
1
{round(local!salesGrowth, 2) & "%"}
Now that the sales growth percentage is displayed, let's add some labels:
Sales Growth. and select Medium Text.
Replace the existing expression with the following expression. This will display the orderDate from the queries containing the sum of sales. For example, 2020-2021.
1
local!salesLastYear.orderDate & "-" & local!salesThisYear.orderDate
The KPI will look like something like this:
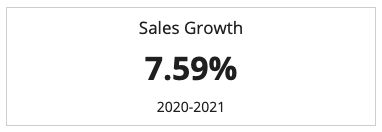
Note: Your sales growth percentage may differ from the image above since the queries that calculate the sum of sales for this year and last year use the today() function, which will change the calculation each day.
In addition to the sales growth, let's add two more KPI: one that shows the sum of sales for last year, and another that shows the sum of sales for this year. Showing these two KPIs will help sales executives visualize the sales growth percentage.
To show the sum of sales for last year as a KPI:
Replace the existing expression with the following expression. This will display the sum of sales from last year in a dollar amount.
1
 dollar(local!salesLastYear.sumOfOrders)
Like the Sales Growth KPI, you'll also add labels to your sales KPI:
Total Sales. and select Medium Text.Replace the existing expression with the following expression. This will display the orderDate from the expression rule containing the sum of sales from last year. For example, 2020.
1
local!salesLastYear.orderDate
To show the sum of sales for this year as a KPI:
Replace the existing expression with the following expression. This will display the sum of sales from this year in a dollar amount.
1
 dollar(local!salesThisYear.sumOfOrders)
To add labels to your sales KPI:
Total Sales. and select Medium Text.Replace the existing expression with the following expression. This will display the orderDate from the expression rule containing the sum of sales from this year. For example, 2021.
1
local!salesThisYear.orderDate
The final interface will look something like this:
The resulting expression will look like this:
Note: You can copy and paste this expression into an interface in the Appian Retail application to see the fully configured pattern.
These record type references are specific to the Appian Retail application, so you will only need to replace the record field references if you're following along in a different environment.
1
2
3
4
5
6
7
8
9
10
11
12
13
14
15
16
17
18
19
20
21
22
23
24
25
26
27
28
29
30
31
32
33
34
35
36
37
38
39
40
41
42
43
44
45
46
47
48
49
50
51
52
53
54
55
56
57
58
59
60
61
62
63
64
65
66
67
68
69
70
71
72
73
74
75
76
77
78
79
80
81
82
83
84
85
86
87
88
89
90
91
92
93
94
95
96
97
98
99
100
101
102
103
104
105
106
107
108
109
110
111
112
113
114
115
116
117
118
119
120
121
122
123
124
125
126
127
128
129
130
131
132
133
134
135
136
137
138
139
140
141
142
143
144
145
146
147
148
149
150
151
152
153
154
155
156
157
158
159
160
161
162
163
164
165
166
167
168
169
170
171
172
173
174
175
176
177
178
179
180
181
182
183
184
185
186
187
188
189
190
191
192
193
194
195
196
197
198
a!localVariables(
  /* Calculate the sum of sales for orders placed this year */
  local!salesThisYear: a!queryRecordType(
    recordType: 'recordType!{ad898682-e651-4b2d-af67-47c1fcb1171f}Order',
    filters: a!queryFilter(
      field: 'recordType!{ad898682-e651-4b2d-af67-47c1fcb1171f}Order.fields.{fbcc99f6-1ddf-4923-903b-18122a1737c6}orderDate',
      operator: "BETWEEN",
      value: {
        /* Beginning of the year */
        eomonth(today(), - month(today())) + 1,
        now()
      }
    ),
    fields: a!aggregationFields(
      /* Group by order date year */
      groupings: a!grouping(
        field: 'recordType!{ad898682-e651-4b2d-af67-47c1fcb1171f}Order.fields.{fbcc99f6-1ddf-4923-903b-18122a1737c6}orderDate',
        alias: "orderDate",
        interval: "YEAR"
      ),
      /* Get the sum of line total for all order items */
      measures: a!measure(
        field: 'recordType!{ad898682-e651-4b2d-af67-47c1fcb1171f}Order.relationships.{0bde4028-fd7a-411f-97ad-7ad5b84e0d18}orderDetail.fields.{db456082-5f77-4765-bc3e-f662651e0d52}lineTotal',
        function: "SUM",
        alias: "sumOfOrders"
      )
    ),
    pagingInfo: a!pagingInfo(startIndex: 1, batchSize: 500)
  ).data,
  /* Calculate the sum of sales for orders placed last year */
  local!salesLastYear: a!queryRecordType(
    recordType: 'recordType!{ad898682-e651-4b2d-af67-47c1fcb1171f}Order',
    filters: a!queryFilter(
      field: 'recordType!{ad898682-e651-4b2d-af67-47c1fcb1171f}Order.fields.{fbcc99f6-1ddf-4923-903b-18122a1737c6}orderDate',
      operator: "BETWEEN",
      value: {
        /*Beginning of the year - Last year*/
        datetime(
          year(eomonth(today(), - month(today())) + 1) - 1,
          1,
          1
        ),
        /*Today - Last year */
        datetime(
          year(today()) - 1,
          month(today()),
          day(today())
        )
      }
    ),
    fields: a!aggregationFields(
      /* Group by order date year */
      groupings: a!grouping(
        field: 'recordType!{ad898682-e651-4b2d-af67-47c1fcb1171f}Order.fields.{fbcc99f6-1ddf-4923-903b-18122a1737c6}orderDate',
        alias: "orderDate",
        interval: "YEAR"
      ),
      /* Get the sum of line total for all order items */
      measures: a!measure(
        field: 'recordType!{ad898682-e651-4b2d-af67-47c1fcb1171f}Order.relationships.{0bde4028-fd7a-411f-97ad-7ad5b84e0d18}orderDetail.fields.{db456082-5f77-4765-bc3e-f662651e0d52}lineTotal',
        function: "SUM",
        alias: "sumOfOrders"
      )
    ),
    pagingInfo: a!pagingInfo(startIndex: 1, batchSize: 500)
  ).data,
  /* Sales growth calculation */
  local!salesGrowth: (
    local!salesThisYear.sumOfOrders - local!salesLastYear.sumOfOrders
  ) / local!salesLastYear.sumOfOrders * 100,
  /* Column layout that we'll use for our KPIs */
  {
    a!columnsLayout(
      columns: {
        a!columnLayout(
          contents: {
            a!cardLayout(
              contents: {
                a!richTextDisplayField(
                  labelPosition: "COLLAPSED",
                  value: {
                    a!richTextItem(text: { "Total Sales" }, size: "MEDIUM")
                  },
                  align: "CENTER"
                ),
                a!richTextDisplayField(
                  labelPosition: "COLLAPSED",
                  value: {
                    a!richTextItem(
                      text: {
                        dollar(local!salesLastYear.sumOfOrders)
                      },
                      size: "LARGE",
                      style: { "STRONG" }
                    )
                  },
                  align: "CENTER"
                ),
                a!richTextDisplayField(
                  labelPosition: "COLLAPSED",
                  value: {
                    a!richTextItem(text: { local!salesLastYear.orderDate })
                  },
                  align: "CENTER"
                )
              },
              height: "AUTO",
              style: "NONE",
              marginBelow: "STANDARD"
            )
          }
        ),
        a!columnLayout(
          contents: {
            a!cardLayout(
              contents: {
                a!richTextDisplayField(
                  labelPosition: "COLLAPSED",
                  value: {
                    a!richTextItem(text: { "Total Sales" }, size: "MEDIUM")
                  },
                  align: "CENTER"
                ),
                a!richTextDisplayField(
                  labelPosition: "COLLAPSED",
                  value: {
                    a!richTextItem(
                      text: {
                        a!richTextItem(
                          text: {
                            dollar(local!salesThisYear.sumOfOrders)
                          }
                        )
                      },
                      size: "LARGE",
                      style: { "STRONG" }
                    )
                  },
                  align: "CENTER"
                ),
                a!richTextDisplayField(
                  labelPosition: "COLLAPSED",
                  value: {
                    a!richTextItem(text: { local!salesThisYear.orderDate })
                  },
                  align: "CENTER"
                )
              },
              height: "AUTO",
              style: "NONE",
              marginBelow: "STANDARD"
            )
          }
        ),
        a!columnLayout(
          contents: {
            a!cardLayout(
              contents: {
                a!richTextDisplayField(
                  labelPosition: "COLLAPSED",
                  value: {
                    a!richTextItem(text: { "Sales Growth" }, size: "MEDIUM")
                  },
                  align: "CENTER"
                ),
                a!richTextDisplayField(
                  labelPosition: "COLLAPSED",
                  value: {
                    a!richTextItem(
                      text: { round(local!salesGrowth, 2) & "%" },
                      size: "LARGE",
                      style: { "STRONG" }
                    )
                  },
                  align: "CENTER"
                ),
                a!richTextDisplayField(
                  labelPosition: "COLLAPSED",
                  value: {
                    a!richTextItem(
                      text: {
                        local!salesLastYear.orderDate & "-" & local!salesThisYear.orderDate
                      }
                    )
                  },
                  align: "CENTER"
                )
              },
              height: "AUTO",
              style: "NONE",
              marginBelow: "STANDARD"
            )
          }
        )
      }
    )
  }
)
Year-Over-Year Sales Growth
