Tip: Interface patterns give you an opportunity to explore different interface designs. Be sure to check out How to Adapt a Pattern for Your Application.
GoalCopy link to clipboard
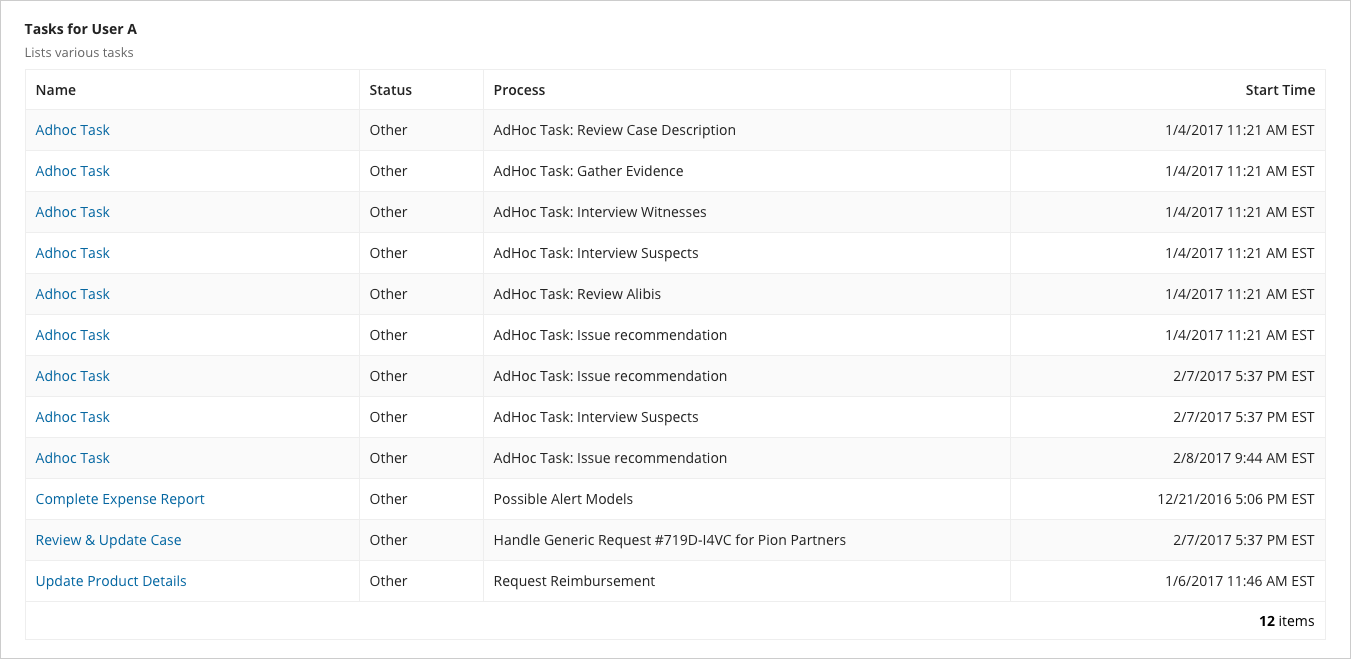
Display the tasks for a user in a Read-Only Grid and allow them to click on a task to navigate to the task itself.
This design pattern is not recommended for offline interfaces because reflecting immediate changes in an interface based on user interaction requires a connection to the server.

This scenario demonstrates:
- How to use
a!queryProcessAnalytics()to query task data - How to display a grid based on a process report's configuration
- How to use the process report's configured formatting in SAIL
- How to convert the process report's configured drilldown to interface links
SetupCopy link to clipboard
For this recipe, you'll need a constant pointing to a task report. Follow these steps to create a task report with the default columns and associate it with a constant:
- In the Build view of your application, click NEW > Process Report.
- Select Create from scratch.
- Name the report Tasks for User A, and provide a description that will be displayed as the label and instructions of the grid.
- Under Report Type, select Task.
- Under Context Type, select Tasks by owner.
- Specify a folder to contain the report, and then click Create & Edit.
The process report opens in a new tab. - In the toolbar, click Edit.
- In the Report Options dialog, click the Data tab.
- Click the Name link.
- Check the Link to more information checkbox and from the Link to dropdown list, select Task Details.
- Click Save.
- Save the report by clicking Save in the toolbar.
The main expression uses a supporting constant constant, so let's create them first.
UC_TASKS_FOR_USER_REPORT: Constant of type Document whose value isTasks for User A
Now that we've created the supporting rules, let's move on to the main expression.
ExpressionCopy link to clipboard
1
2
3
4
5
6
7
8
9
10
11
12
13
14
15
16
17
18
19
20
21
22
23
24
25
26
27
28
29
30
31
32
33
34
35
36
37
38
39
40
41
42
43
44
45
46
47
48
49
50
51
52
53
54
55
56
57
58
59
a!localVariables(
  local!pagingInfo: a!pagingInfo(
    startIndex: 1,
    batchSize: -1
  ),
  local!report: a!queryProcessAnalytics(
    report: cons!UC_TASKS_FOR_USER_REPORT,
    query: a!query(pagingInfo: local!pagingInfo)
  ),
  a!gridField(
    label: local!report.name,
    instructions: local!report.description,
    data: local!report.data,
    columns:
    a!forEach(
      items: local!report.columnConfigs,
      expression: a!gridColumn(
        label: fv!item.label,
        sortField: fv!item.field,
        align: if(fv!item.configuredFormatting = "DATE_TIME", "END", "START"),
        value: if(
          fv!item.configuredFormatting = "TASK_STATUS",
          index(
            {
              "Assigned",
              "Accepted",
              "Completed",
              "Not Started",
              "Cancelled",
              "Paused",
              "Unattended",
              "Aborted",
              "Cancelled By Exception",
              "Submitted",
              "Running",
              "Error"
            },
            /* Task status ids start with 0, so add one to reach the first index */
            tointeger(index(fv!row, tointeger(fv!item.field) + 1, -1 )),
            "Other"
          ),
          if(
            fv!item.configuredDrilldown = "TASK_DETAILS",
            a!linkField(
              links: a!processTaskLink(
                label: index(fv!row, fv!item.field, {}),
                task: index(fv!row, fv!item.drilldownField, {})
              )
            ),
            index(fv!row, fv!item.field, {})
          )

        )
      )
    ),
    rowHeader: 1,
    pageSize: 20
  )
)
Copy
Test It OutCopy link to clipboard
- Sort and (if you have enough tasks) page your grid.
- Click on a task's name to view the task form.
Notable Implementation DetailsCopy link to clipboard
- This example shows how to specially handle one kind of formatting and one kind of drill down, but the same pattern can be applied to provide an interface interpretation of other process report configurations.
