| This Appian Cloud capability is separately licensed and is only available for Appian's advanced and premium capability tiers. Usage limits may apply. |
OverviewCopy link to clipboard
As your autoscaled processes move through the different stages of work, you will want to keep an eye on them to ensure they are performing as expected. Being proactive in monitoring your autoscaled processes is important to catch spikes in errors and remediate long process wait times. On this page, you'll learn to use monitoring features to identify and investigate these issues so you can take corrective action.
View autoscaled process activityCopy link to clipboard
The Autoscaled Process Activity tab, accessed from the Monitor view, is the central place to view information about the autoscaled processes that ran in a selected time period. High-level KPIs offer a view of how your process models are performing collectively. This data can be explored in more detail with the Process Models grid which breaks down these KPIs for each process model.
Understand the available metricsCopy link to clipboard
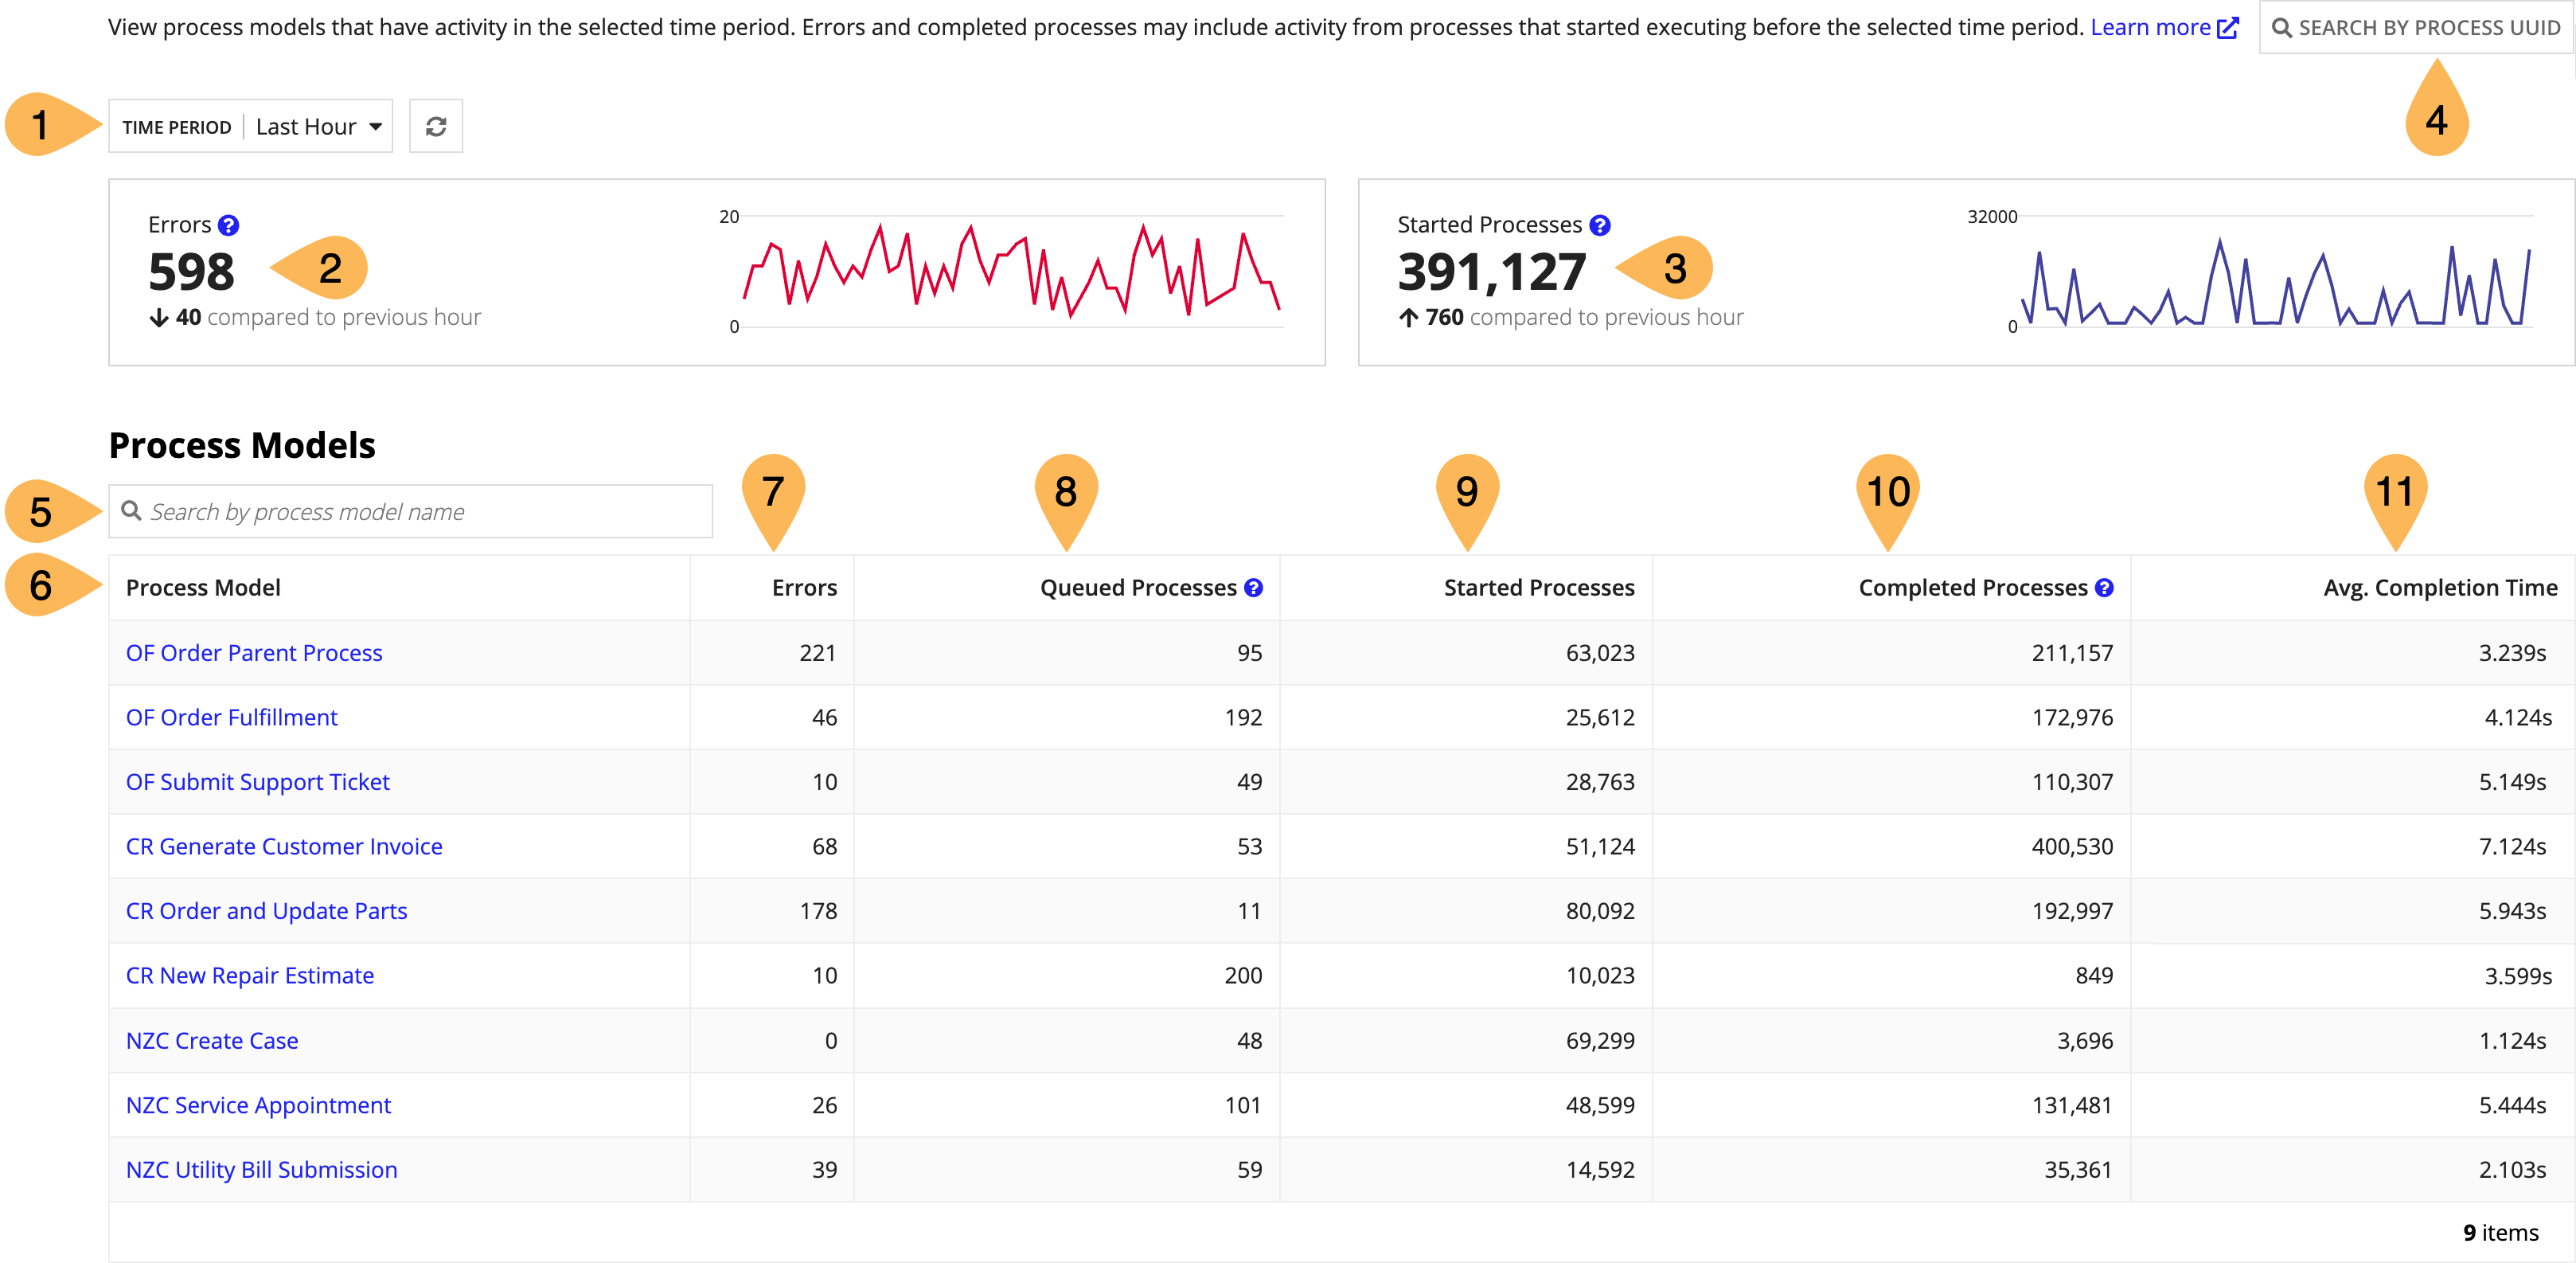
This annotated screenshot and the following descriptions define the buttons and grid columns appearing on this tab.
- Time period: The time period you want to explore with the KPIs and grid data. You can select from preset date ranges or choose a custom range of up to seven days. The custom range can be used to find process models with errors (up to 14 days old). See Process data retention for more information about data storage.
Only process models with activity in this period are shown in the grid. Learn more about how the time period impacts the metrics on this tab. - Errors KPI: The number of errors that have occurred in processes during the selected time period. This number is not restricted to processes that started running in that period; it includes all errors that occurred even if the process started before the selected period.
- Started Processes KPI: The number of processes that were taken from the queue and started running during the selected time period. Processes that were only queued are not included.
- Search by process UUID: Opens a dialog that lets you search for a process by its unique identifier, view information about when the process ran, and cancel or delete the process.
- Process model search: Allows you to search for a process model by name.
- Process Model: Lists the process models that ran during the selected time period. Click the link to see a list of processes run from this process model.
- Errors: The number of errors that occurred in all processes during the selected time period. This number does not change if processes are deleted.
- Queued Processes: The total number of processes added to the queue during the selected time period. This number does not change when processes start or complete.
- Started Processes: The number of processes that started running during the selected time period. This number does not change when processes end.
- Completed Processes: The number of processes that ended during the selected time period. This includes processes that completed or completed with errors. This count will not change if you delete a process.
- Avg. Completion Time: The average amount of time it took for individual processes to run during the selected period. Only completed processes are included in this calculation.
Understand the time periods for process monitoringCopy link to clipboard
Because autoscale is built to run large volumes of processes, the metrics on this page aggregate your environment's process data as a snapshot in time. The data is static, so deleting or canceling processes will not have an effect on the KPIs or values shown in the grid.
By default, the data shown on the tab is the last hour of process activity. In the following image, this hour-long snapshot is the clear area between the gray ends of the timeline.
Events occurring outside the snapshot's period—like the five queued events that happened before the last hour—are not included in the metrics.
View metrics for processesCopy link to clipboard
When you click a process model name in the Process Models grid, you will see a list of recent processes for that process model.
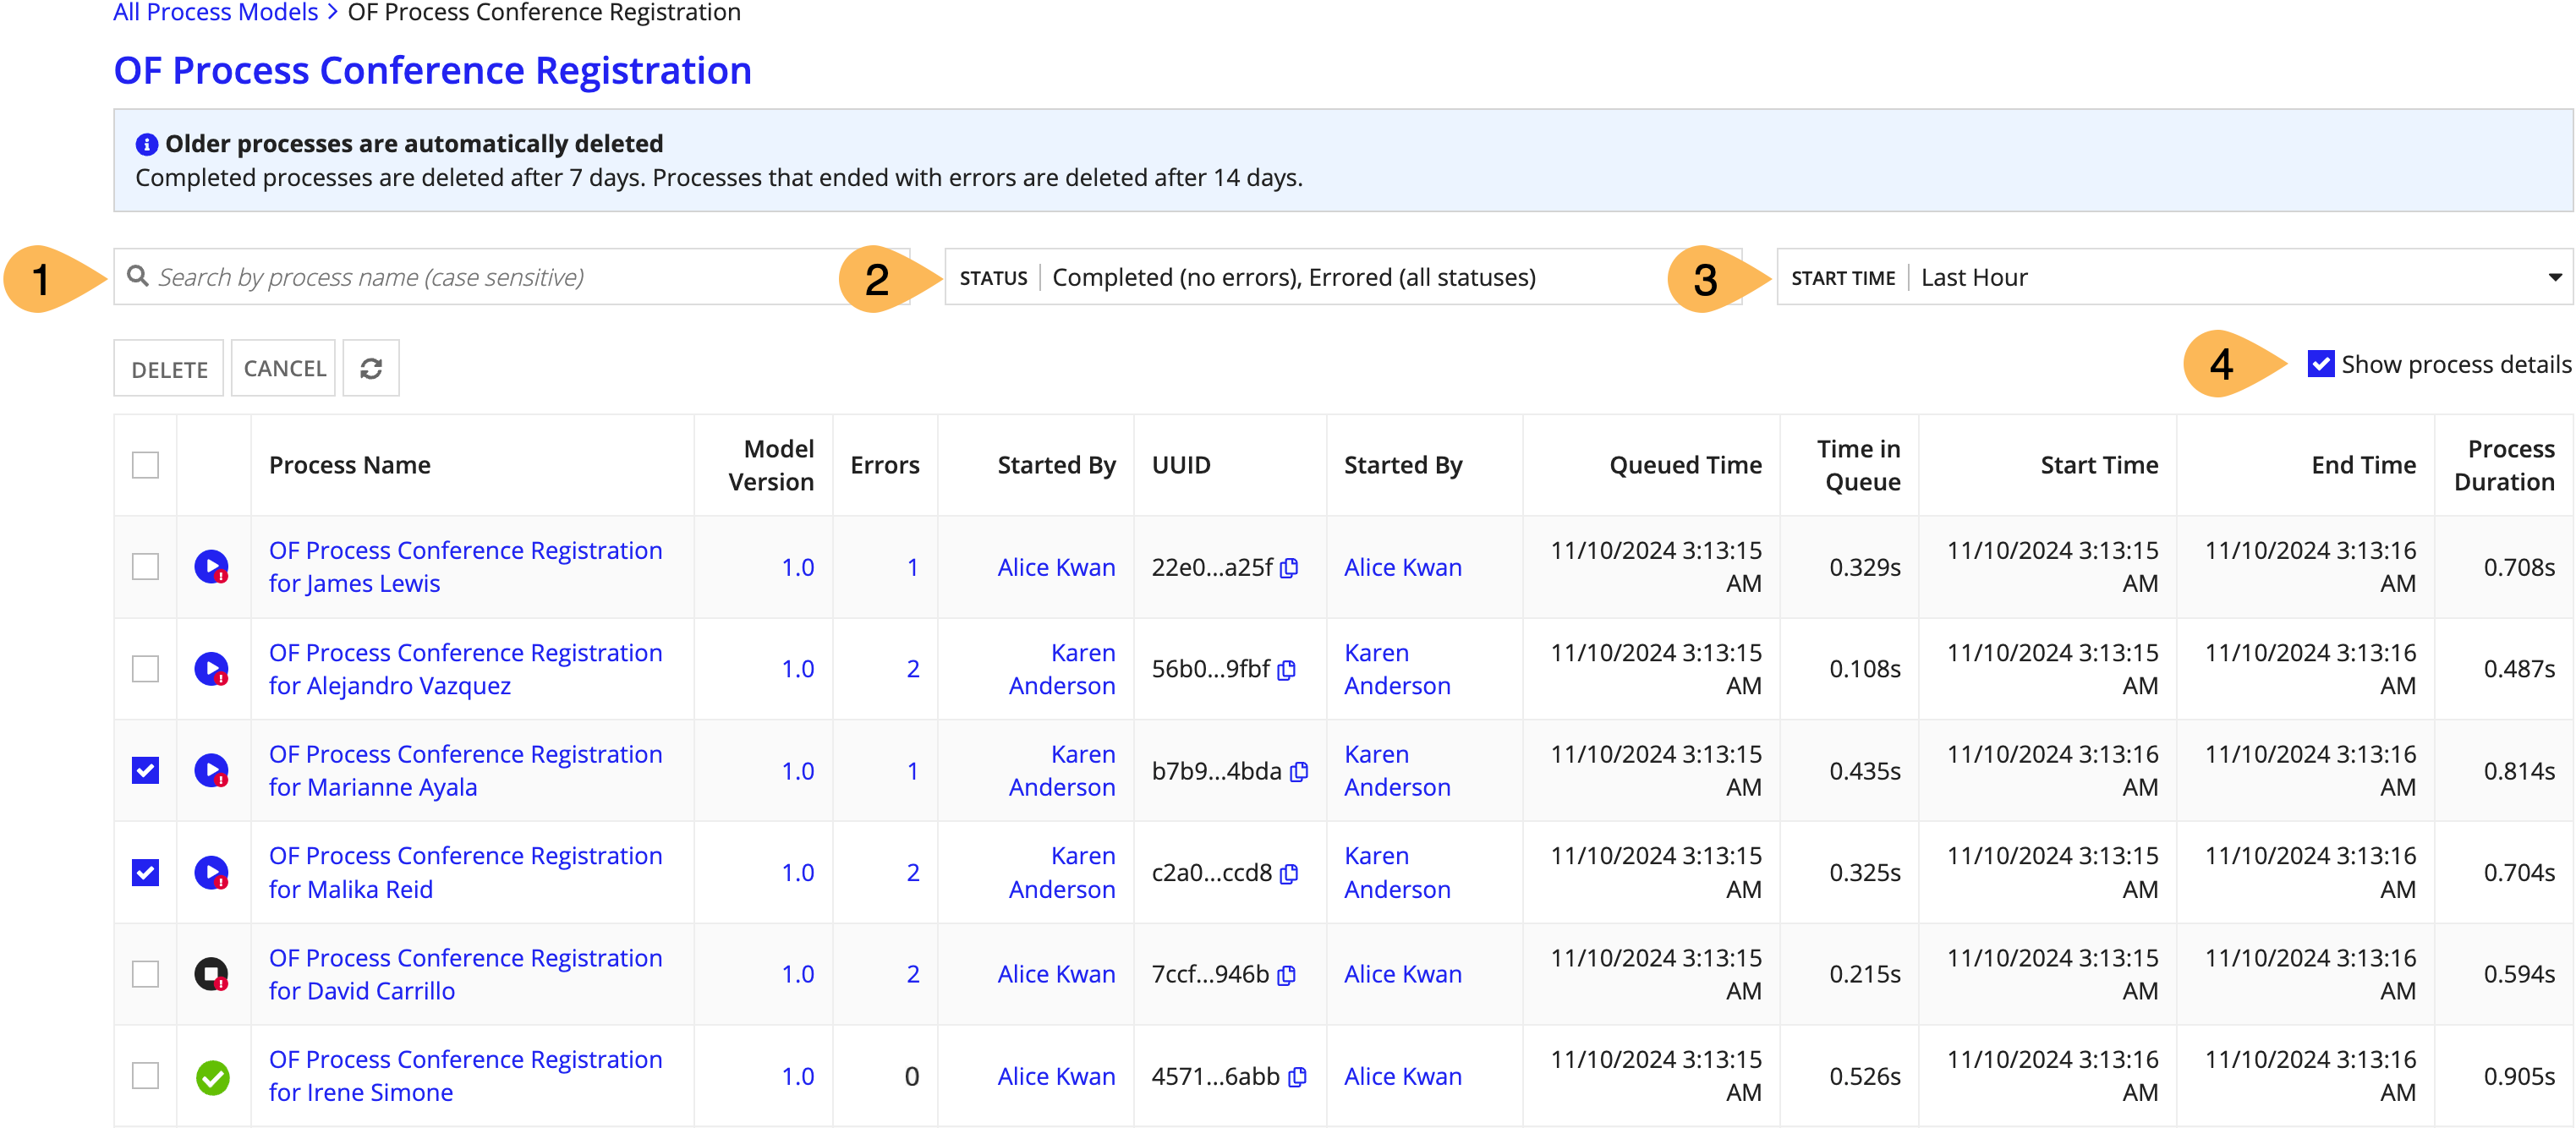
This annotated screenshot and the following descriptions define the buttons and grid columns appearing on this tab.
- Search: Allows you to search to find a specific process by name. The search is case sensitive.
- Status: The status of the processes you want to see in the grid. You can select errored, active, completed, or canceled processes.
- Start Time: The start time of processes you want to see in the grid.
- Show process details: Toggles the Process UUID and Queued Time for each process.
The grid has a number of columns with details about your processes.
| Column | Description |
|---|---|
| Select (checkbox) | Selects the process to cancel or delete. |
| State (icon) | The current state of the process. |
| Process Name | The name of the process. Click the name to open a process in the process modeler's monitoring mode. |
| Model Version | The version of the process model. |
| Errors | The number of errors that the process encountered. |
| Process UUID | The unique identifier of the process. Only shown when Show process details is selected. This value is accessible using the pp!instanceUuid process property. |
| Started By | The user or other actor that started the process. |
| Queued Time | The date and time the process was added to the queue. Only shown when Show process details is selected. |
| Time in Queue | The amount of time the process waited in the queue. |
| Start Time | The date and time the process's work was started. You can sort the grid by earliest or most recent start time by clicking the header cell. This value is also accessible using the pp!startTime process property. |
| End Time | The date and time the process reached all end nodes or a terminate event. If the process is Active with Errors or otherwise incomplete, no data is shown. |
| Process Duration | The amount of time between the process start time and end time. |
Search for processesCopy link to clipboard
Running processes at high scale results in a large amount of monitoring data, so Appian gives you different ways to search and filter this critical information resource. Depending on what you need to know or view, you can use one of these approaches: searching by name or searching by UUID.
Search by nameCopy link to clipboard
When viewing the grid of recent processes for a process model, you can use the search and filters to narrow down the list of processes by their names.
There are a few important strategies to keep in mind for the most efficient searches across this large dataset. When searching, keep these tips in mind:
-
Constrain the data to be searched.
Start by selecting a status and narrowing the time range as much as possible. This will shrink the group of processes that Appian needs to search once you enter the search term.
-
Multi-word search terms are always treated as the whole phrase and must match exactly.
For example, if you search for
silver sedan, only processes with that string would be returned. If the name includes onlysilverorsedan, the process would not appear in the results. -
Search is case sensitive.
Let's say the process names include the customer's first and last name (such as
Clark Simon). If you searched for eitherclarkorsimon, Appian would not find matching processes for that customer.
Search by UUIDCopy link to clipboard
You can also search for a process using its unique identifier (UUID). This search method is most helpful when you're trying to troubleshoot a problem in a specific process.
Appian does not automatically send alerts or notifications for autoscaled process errors. Instead, we recommend using the process's UUID—available as the process property pp!instanceUuid—to design a recordkeeping or alerting solution that works best for your application.
For example, you may want to include the UUID in the process name so it's highly visible. You could also write the value to a data source or set up an error flow in the process model to send an email with the UUID.
However you make the UUID available, finding the process is straightforward.
To search for a process by its UUID:
- On the Autoscaled Process Activity tab, click SEARCH BY PROCESS UUID.
- In the Search by Process UUID field, enter a UUID.
On the Search for Process dialog, you can see basic information about the process.
Monitor a processCopy link to clipboard
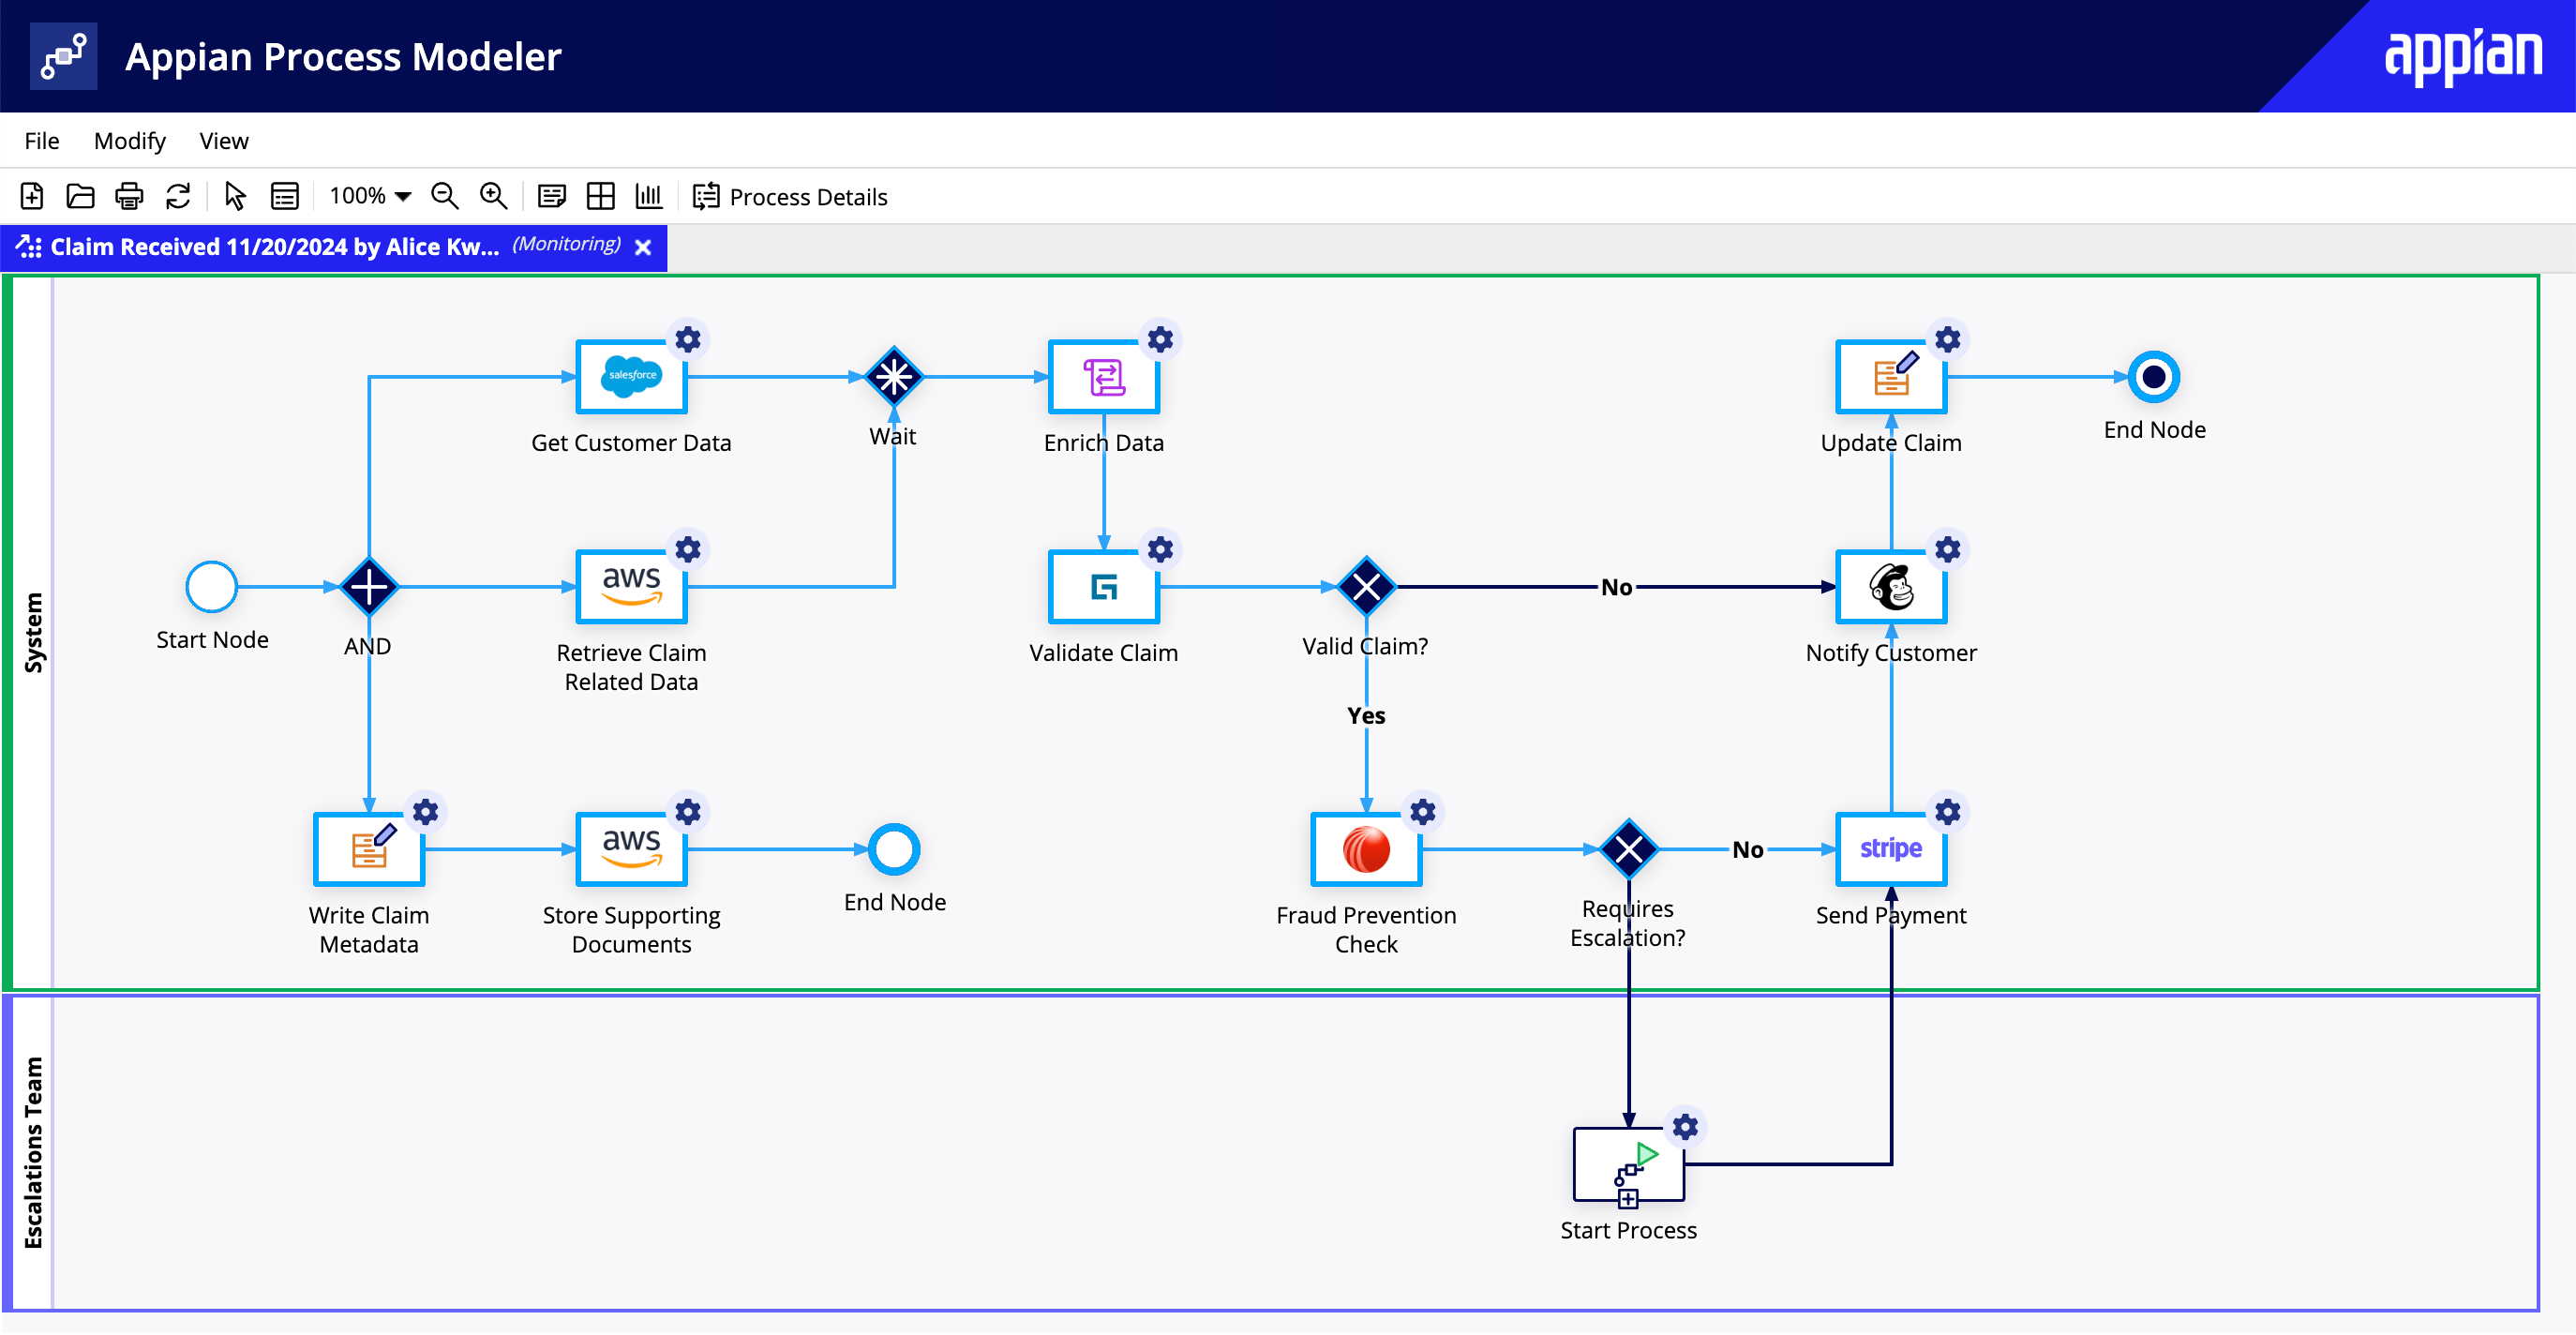
You can explore and debug a specific process using the data available in the process modeler's Monitor mode. This mode lets you examine the flow of the process, view the process's variables, and check any errors that occurred.
The process's nodes and flow arrows are shown with different colored borders depending on their status.
| Format | Status |
|---|---|
| Blue | Completed |
| Green | Active |
| Red with a slash (Ø) through the object | The node was canceled or one or more errors occurred. If the process spawns multiple instances of a node, each instance must encounter an error for the red slash to appear. |
| No color | Not yet activated |
View process detailsCopy link to clipboard
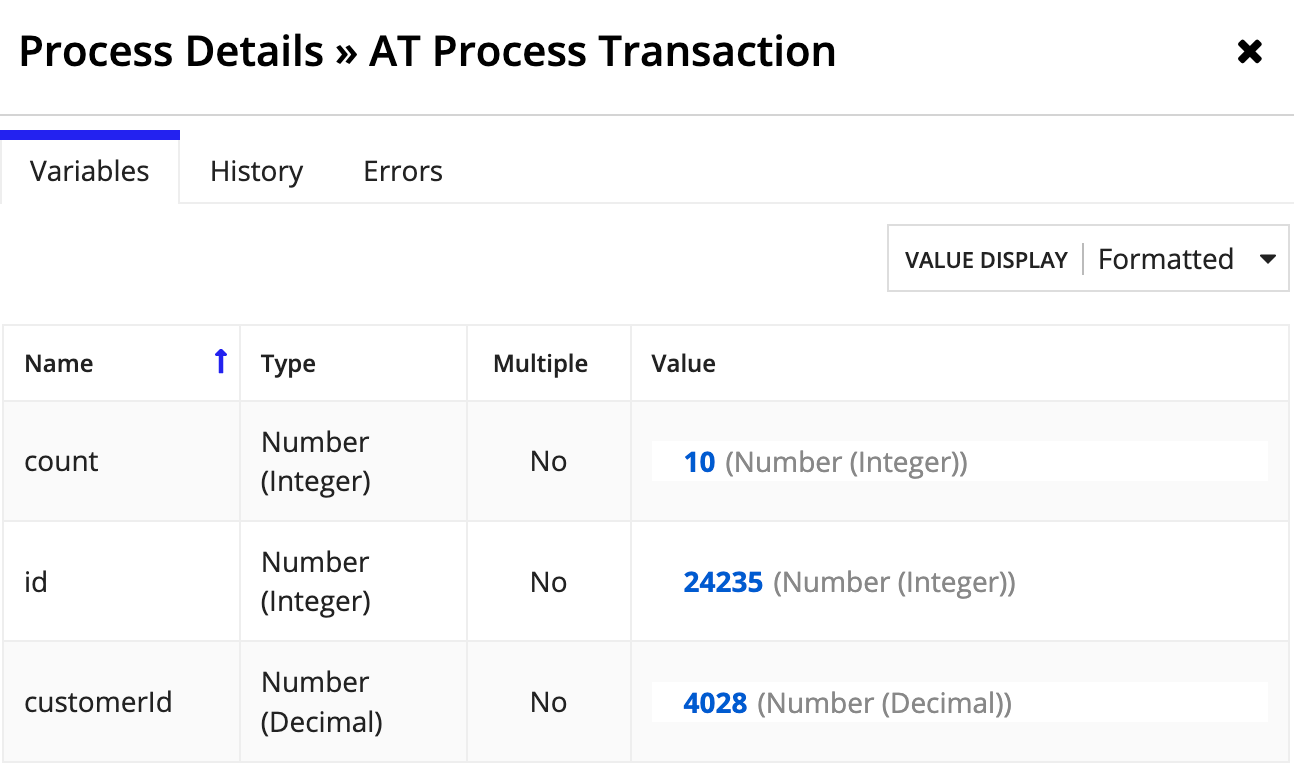
To see more information about the variables and any errors, click Process Details on the process modeler toolbar.
The Variables tab shows the final value of each process variable. You can change the Format Value from the default of Formatted to Raw or Expression.
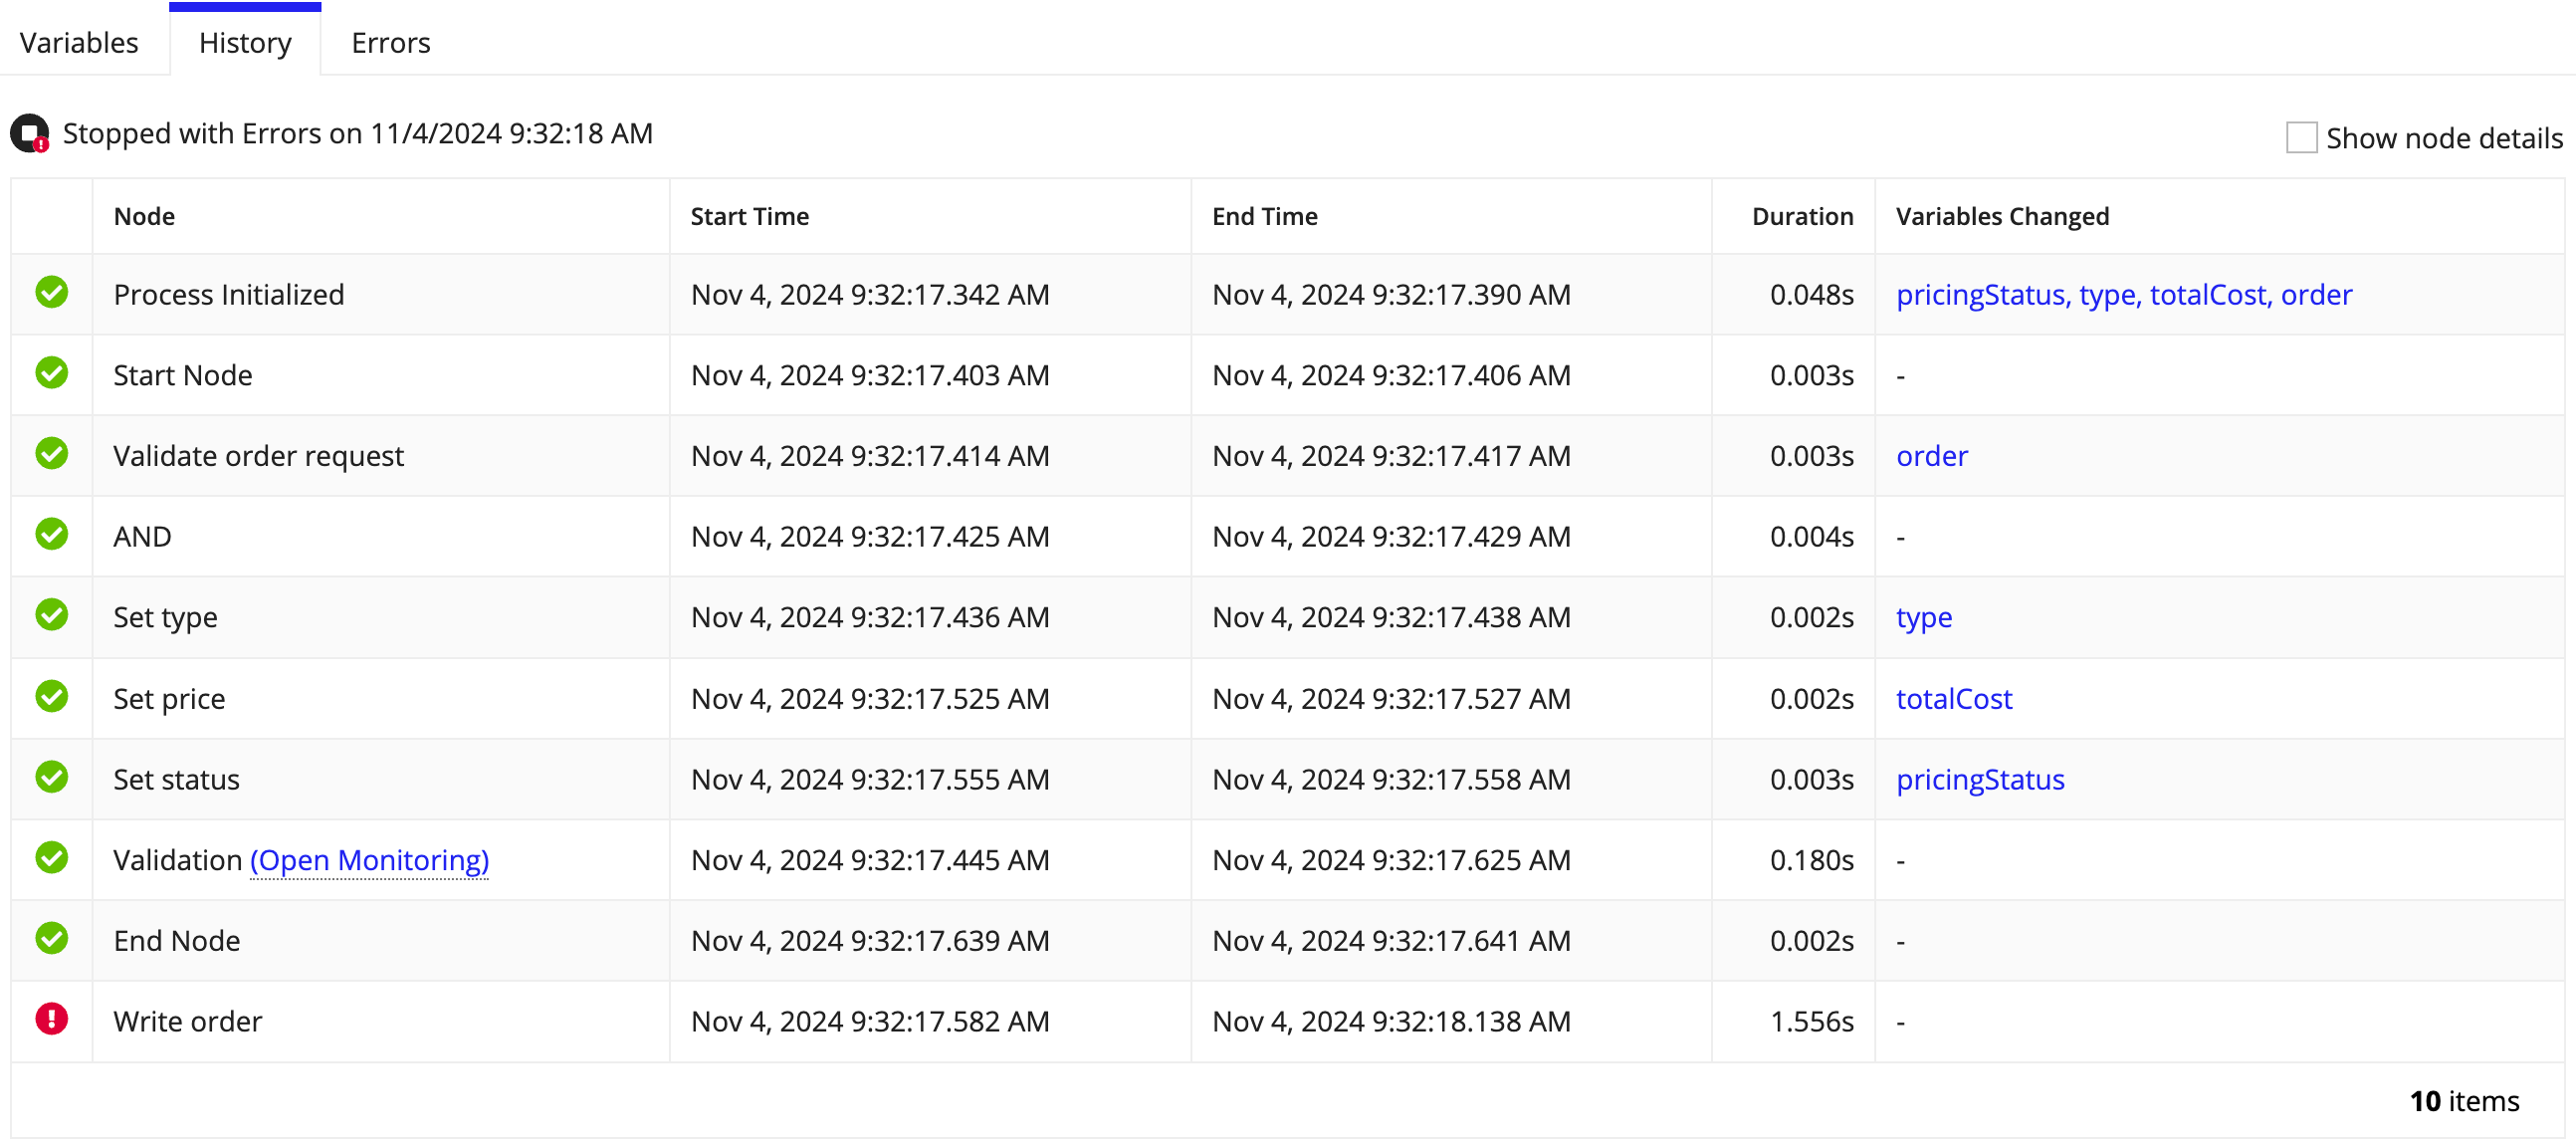
The History tab shows the status of the whole process above the grid and the status of each node in its own row. The Node column shows the display name and the type of each node.
If one of the nodes starts a separate autoscaled process, click Open Monitoring to open the other process in monitoring mode.
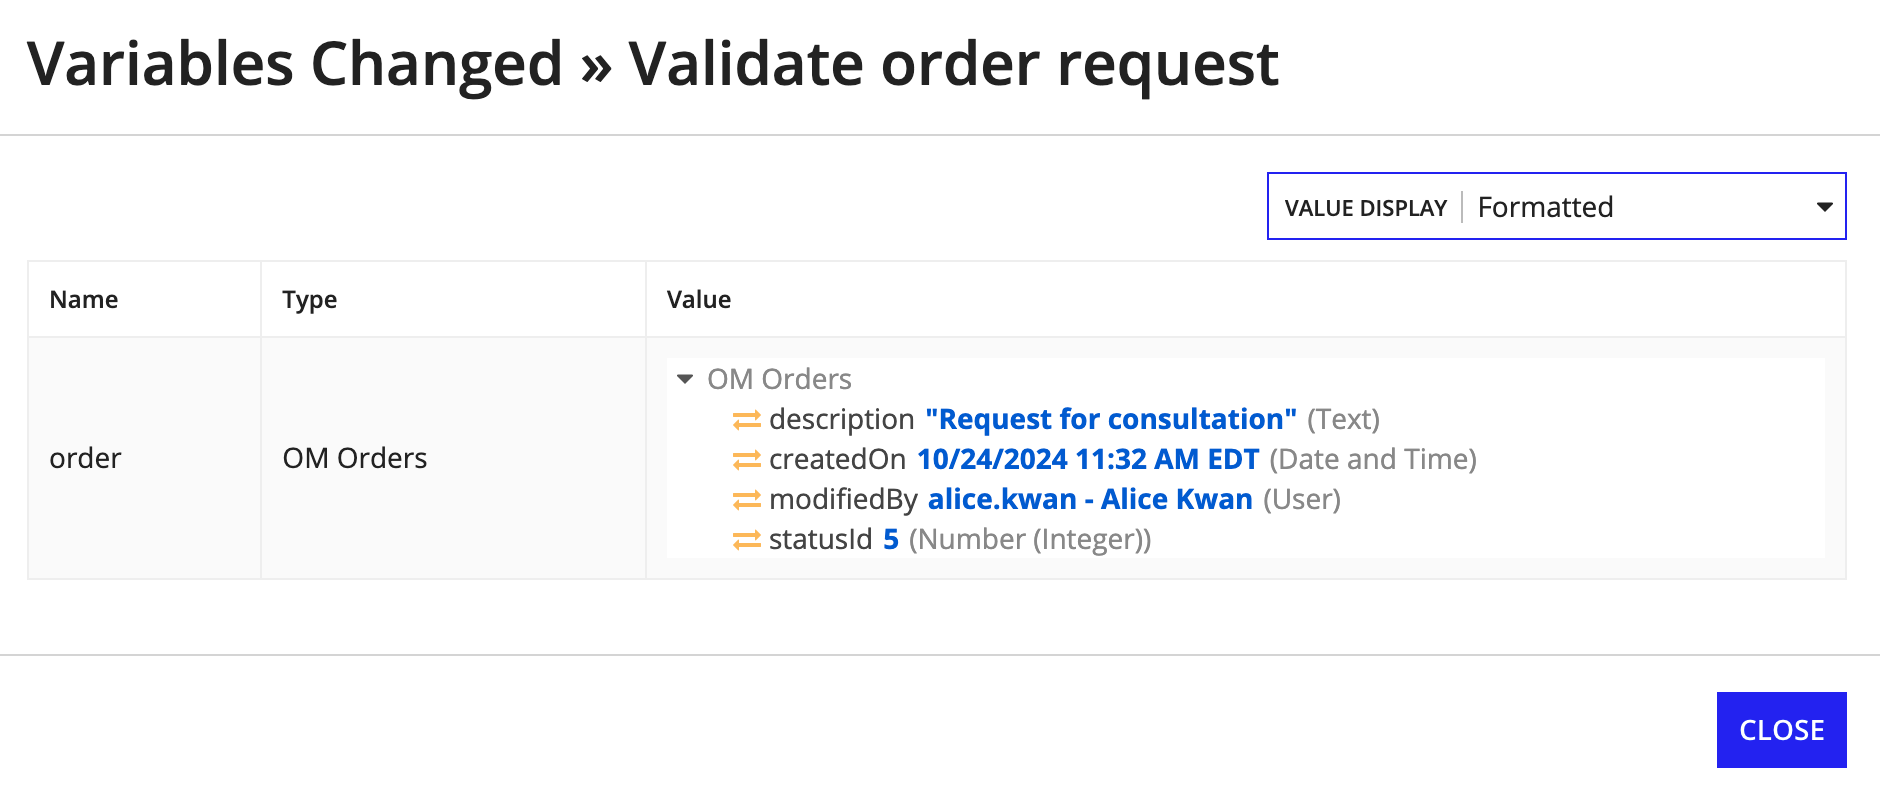
Changes to process variables are recorded at each node where a change is made. Click the name of a variable to see its value as it was at the end of that node.
The Errors tab lists any nodes that encountered an error and the details of the problem.
Process statesCopy link to clipboard
When you click on a specific process model, you will see a grid of all processes included in the selected time period. In this grid, each process can have one of the following states:
| Icon | State | Description |
|---|---|---|
 |
Active | The process is currently running |
 |
Active with Errors | The process is currently running but one or more errors have occurred |
 |
Canceled | The process was manually canceled |
 |
Canceled with Errors | The process was manually canceled and one or more errors occurred |
 |
Completed | The process ran and reached one end event with a terminate trigger or reached all end events defined in the process model |
 |
Completed with Errors | An error occurred, but the process ran and reached one end event with a terminate trigger or reached all end events defined in the process model |
 |
Stopped with Errors | Appian encountered an error and cannot make further progress in the flow |
Process data retentionCopy link to clipboard
Autoscaled processes create large volumes of data to power your troubleshooting with the process activity and process history. Appian automatically removes older data at regular intervals to ensure your site remains performant.
The following data retention rules are in place for autoscaled processes:
- Data for processes that ended without errors is automatically deleted after seven days.
- Data for processes that ended with errors is automatically deleted after 14 days.
- Data for active processes is automatically deleted after 90 days.
- Aggregated data for the Autoscaled Process Activity tab is automatically deleted after 30 days.
When viewing process model activity, you can use a custom range to select any seven-day time period. This lets you view metrics for older processes with errors.

