| This content applies solely to Connected Underwriting Life, which must be purchased separately from the Appian base platform. This content was written for Appian 24.3 and may not reflect the interfaces or functionality of other Appian versions. |
IntroductionCopy link to clipboard
Appian offers pre-built integrations that allow you to extend your CU Life Workbench capabilities by incorporating feature-rich add-on modules. The End-User Reporting (SEUR) add-on module is a standalone, customizable application built on the Appian low-code platform that allows underwriting managers to create, set up, and aggregate custom reports using different data sources.

End-User ReportingCopy link to clipboard
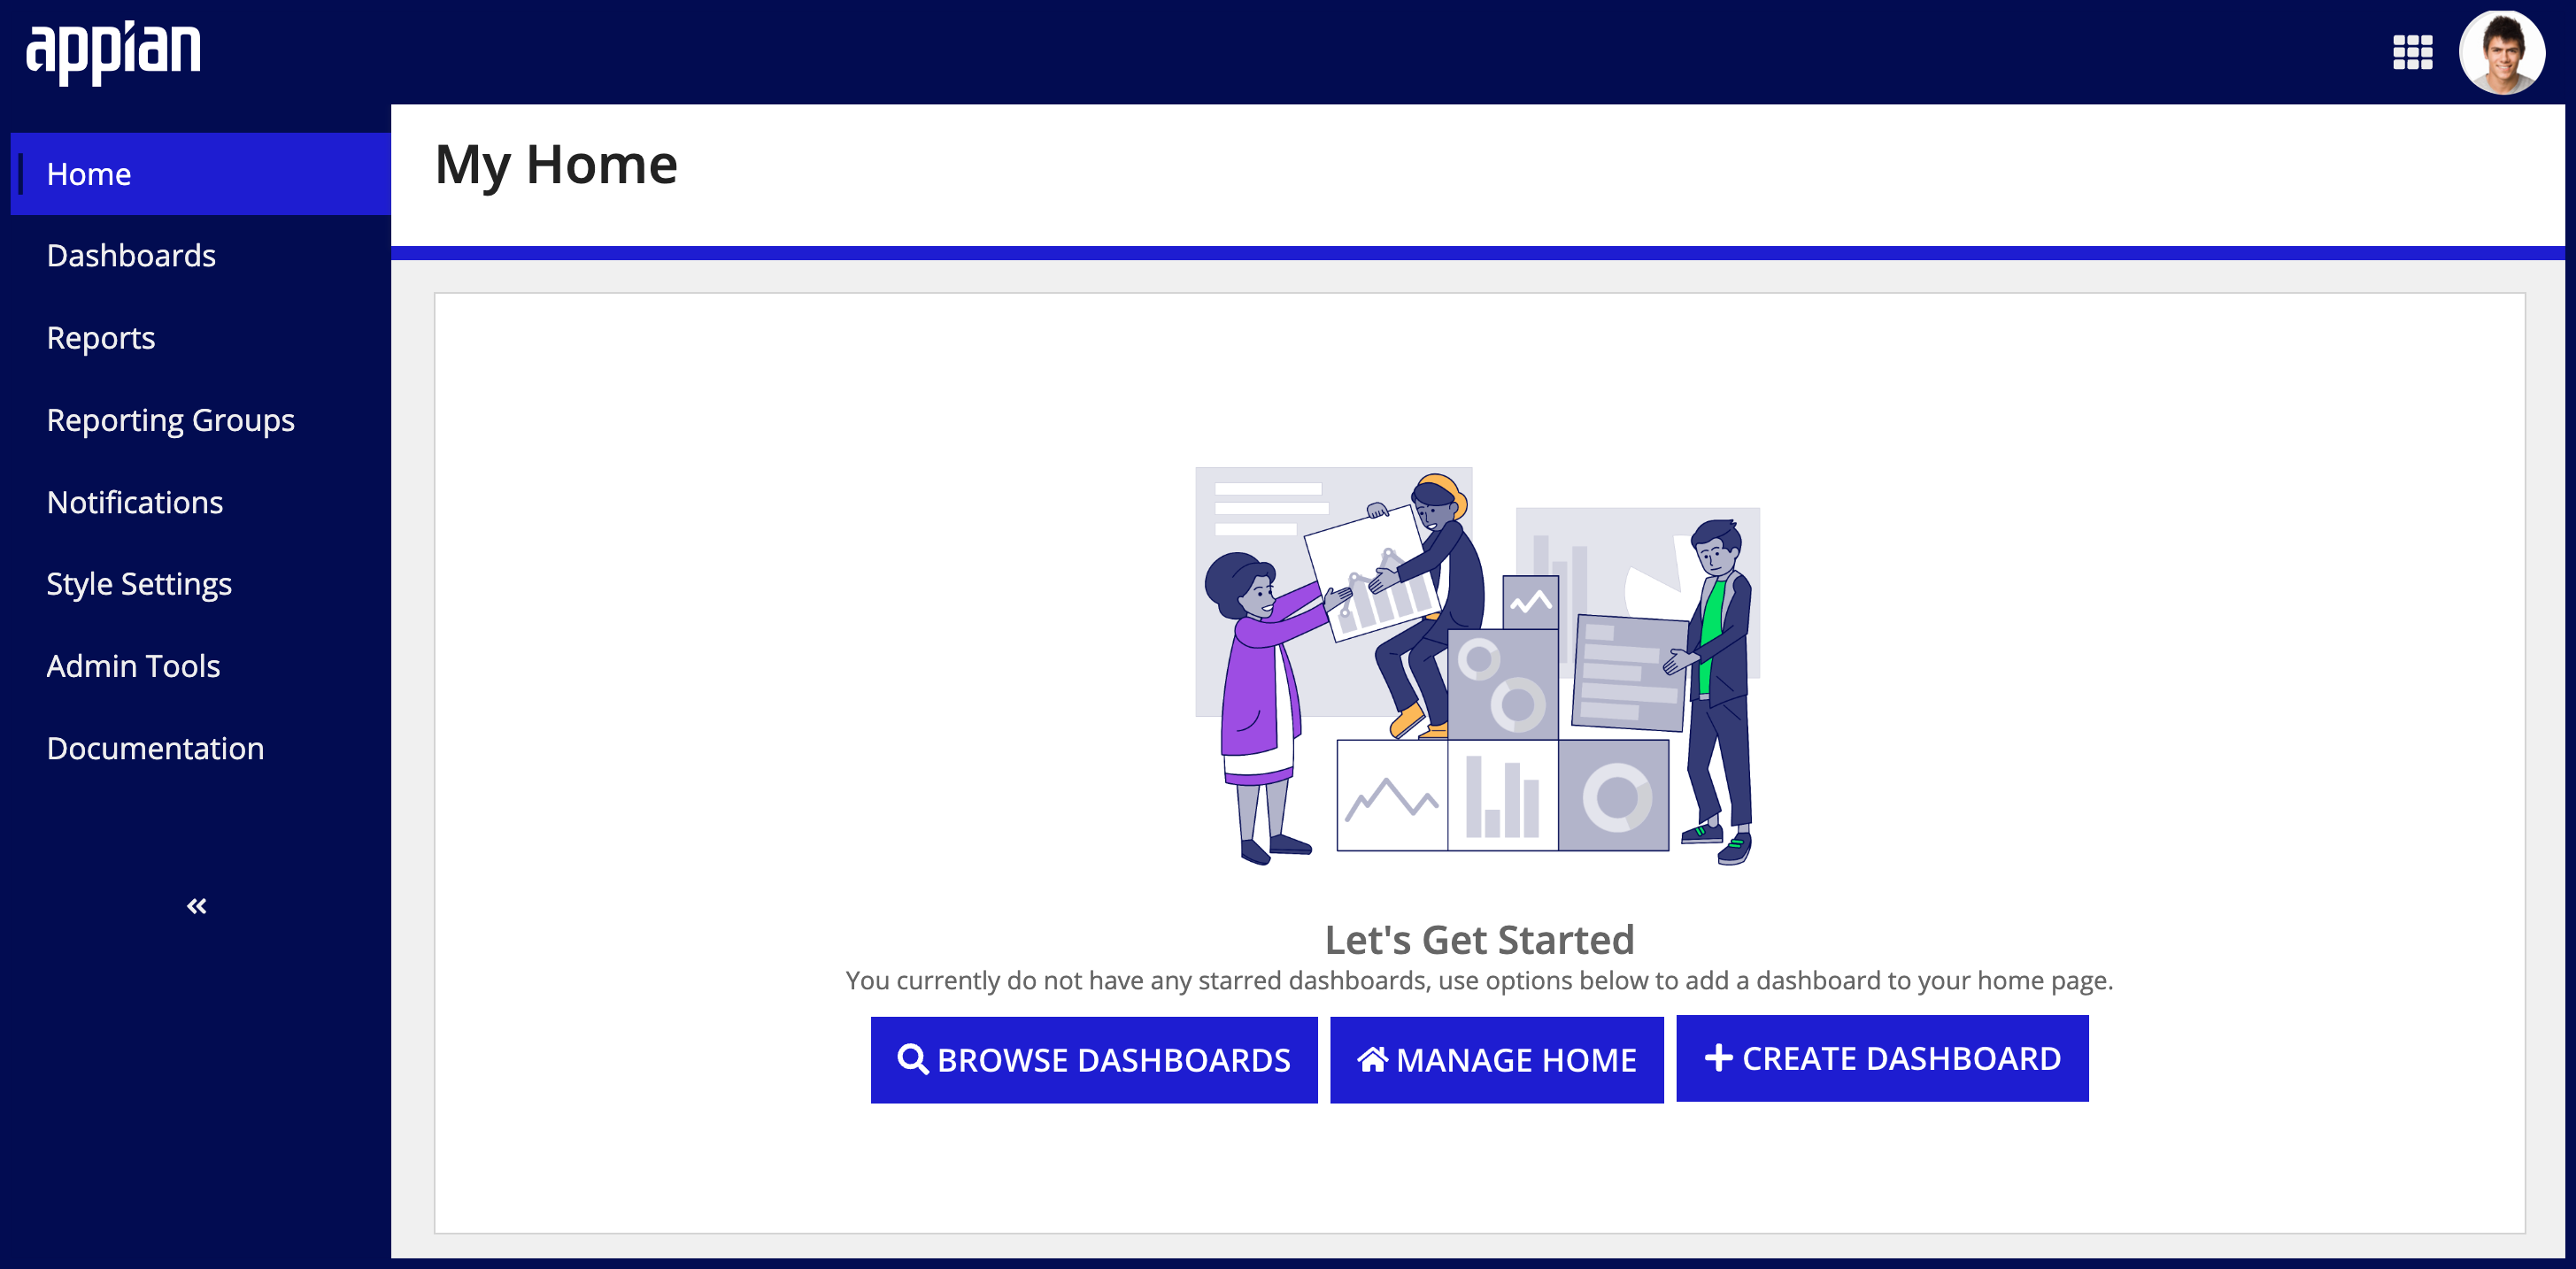
Once the SEUR application is installed and incorporated with your CU Life Workbench, your underwriting managers can create a number of custom and on-demand reports leveraging the data from your data management systems and view them on customizable dashboards that you can stylize to fit your brand and business needs.
Self-Service reporting capabilitiesCopy link to clipboard
The SEUR application gives your underwriting team greater control over the types of reports they want to see and reduces their reliance on your internal development team to create custom reports. With SEUR, users can create and configure tailored reports from data within the CU Life Workbench. This gives them quicker access to critical insights that can lead to faster decision-making, a more flexible and responsive workflow, and a more efficient underwriting process. In addition, since the custom reports live in the SEUR application, users can save them to a dashboard for frequent use or store them to generate on demand.
The site includes a guided workflow that provides users with a number of self-service capabilities, like selecting the data source and data limit, which determines the number of rows the report returns. The application also provides a range of report types, allowing users to choose how they want to visualize the data in grid format or various chart types.
Additionally, reports can be created with flexible filters, allowing for real-time, historical reporting and sharing with other users.
Customized dashboard viewsCopy link to clipboard
Users can also create and customize multiple report dashboards to display reports in a specific order and layout. Easily add names, actions, and filters to your dashboards so users can take action on a report and filter the reports to show only the data they want to see. Dashboard visibility allows users to control who has access to view it.
Selectable layout styles and color schemesCopy link to clipboard
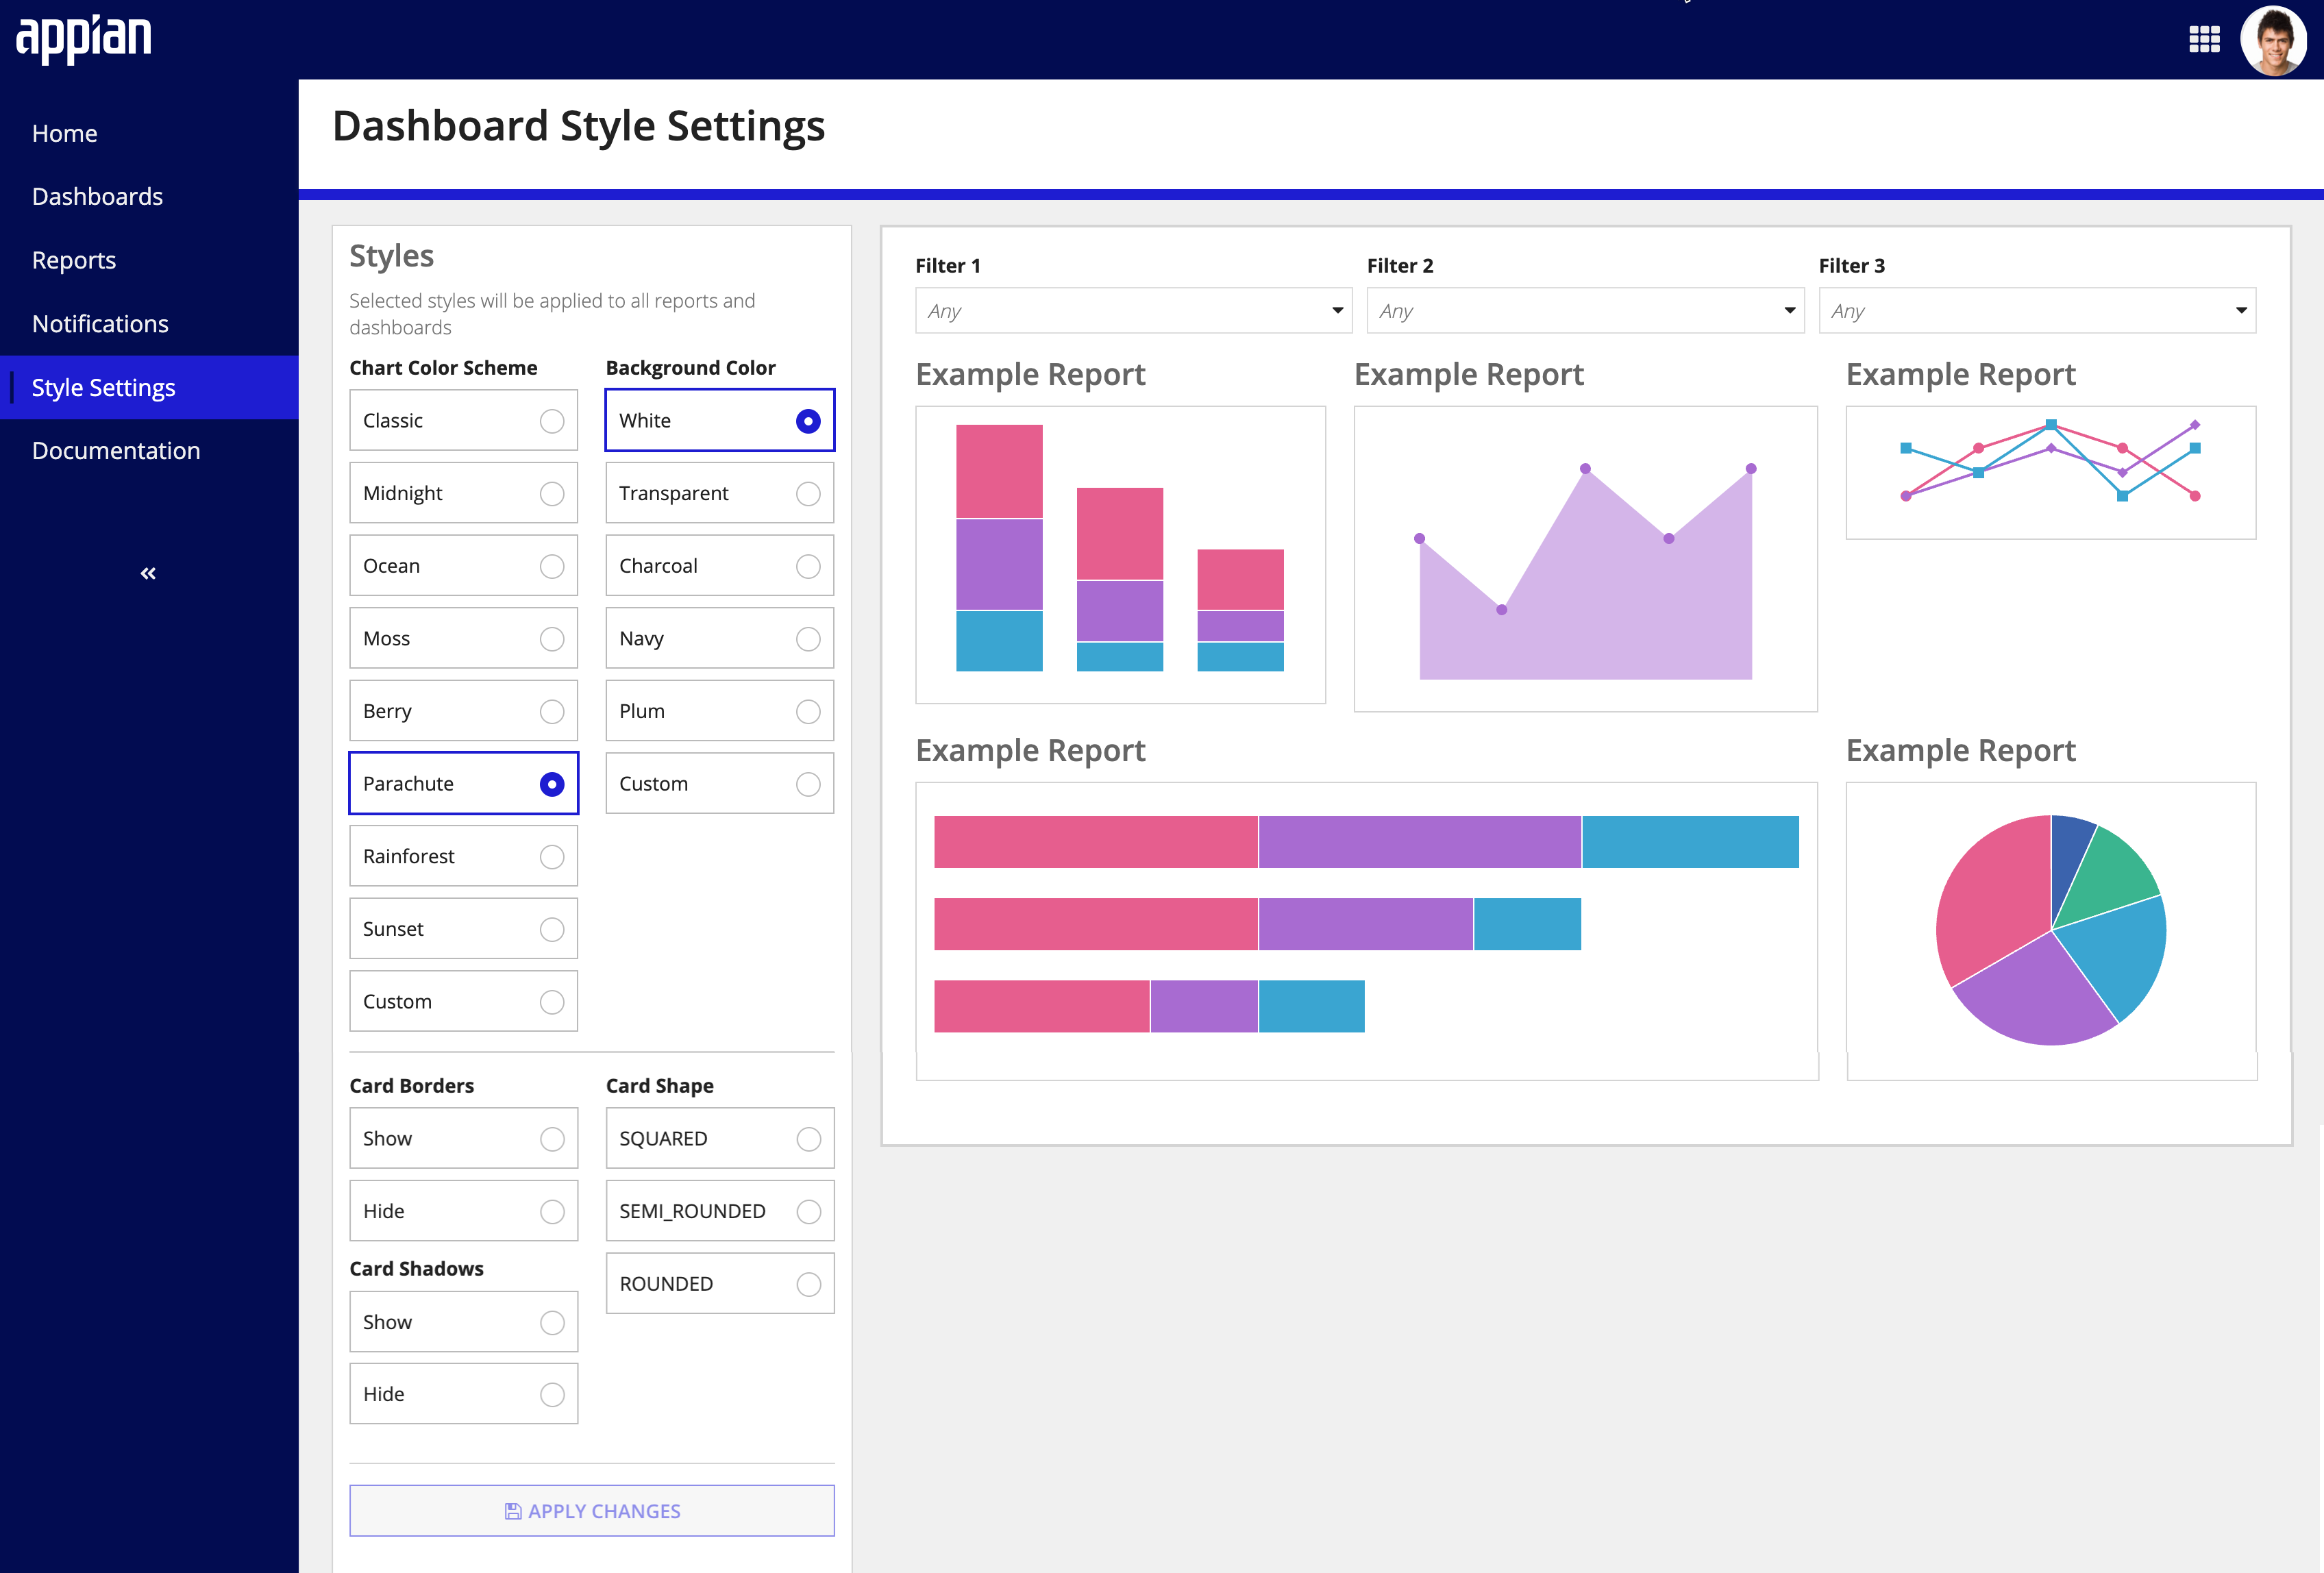
The End-User Reporting module includes custom color schemes, giving users more control over the style and visual display of their reports and dashboard. Users can select from a set of modern and unified color scheme options and background colors to apply to all their reports and dashboard views.

In addition, users can select the style and shape of the report cards displayed on the dashboard.
Schedule report notificationsCopy link to clipboard
Easily configure the schedule and frequency you want specific user groups or recipients to receive an email notification about a specific report or dashboard.
Ready to get started?Copy link to clipboard
Ready to enable your underwriting managers access to create, set up, and aggregate custom reports using different data sources? Download and install the SEUR add-on module with your CU Life Workbench to unlock its power and reporting capabilities.
After installing, be sure to follow the setup steps to incorporate SEUR add-on module with the CU Life Workbench.
