| Process Mining is deprecated with Appian 24.2 and will no longer be available in an upcoming release. Instead, we encourage customers to use Process HQ to explore and analyze business processes and data. |
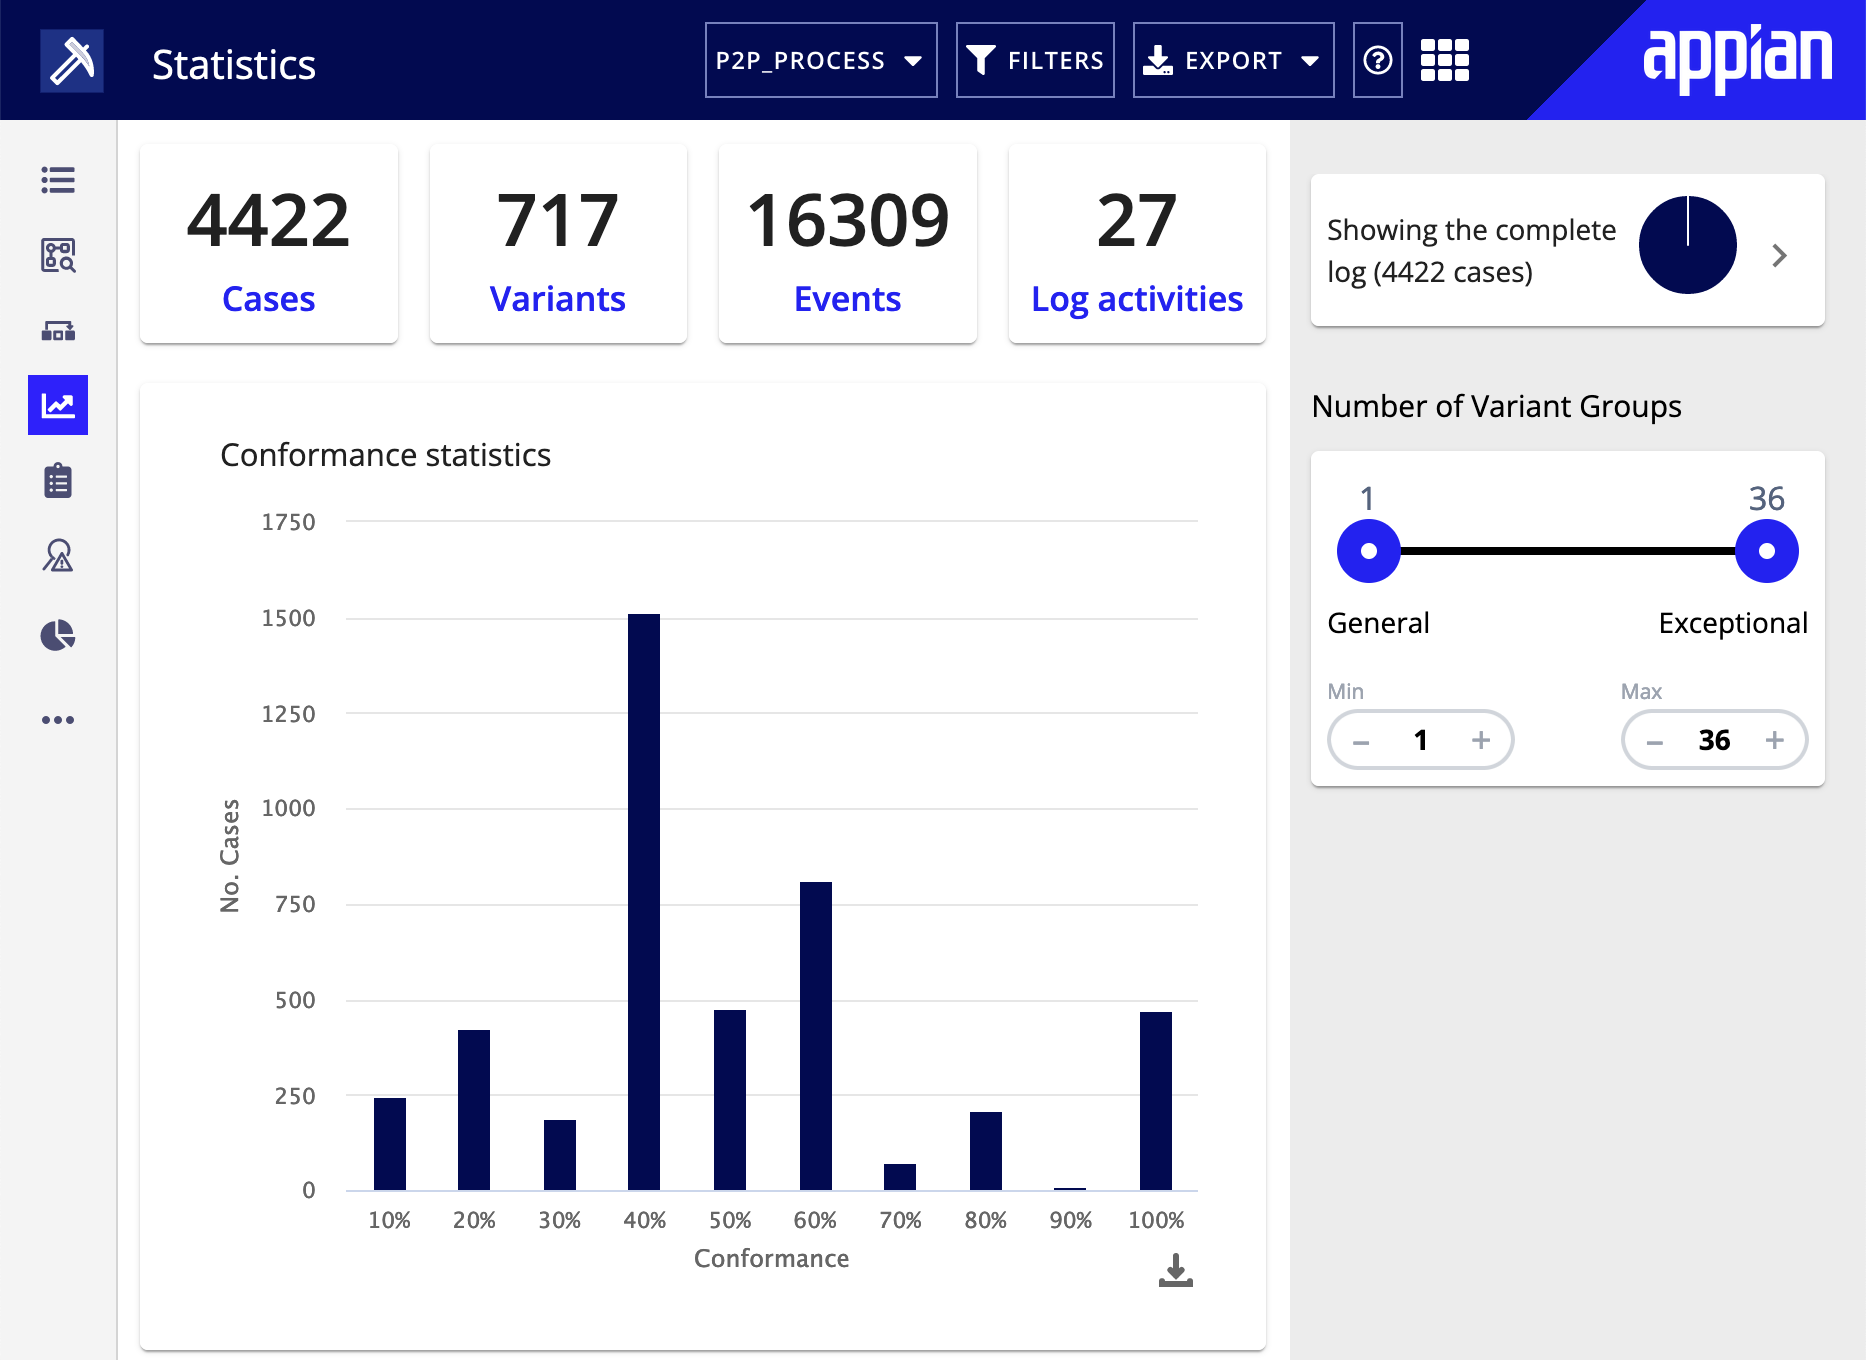
The Statistics page in Process Mining displays basic information about the log, cases, activities and direct follower relations. You can change the data and statistics that appear using filters.
The Statistics page includes information such as:

Conformance statistics show the number of cases that match the target model to a certain degree, measured in percent. These statistics thus provide more precise insights into the conformity of your process runs. This information appears only if a reference model has been linked.
The more variability in conformity, the more process variants. This indicates there is a low degree of process standardization.
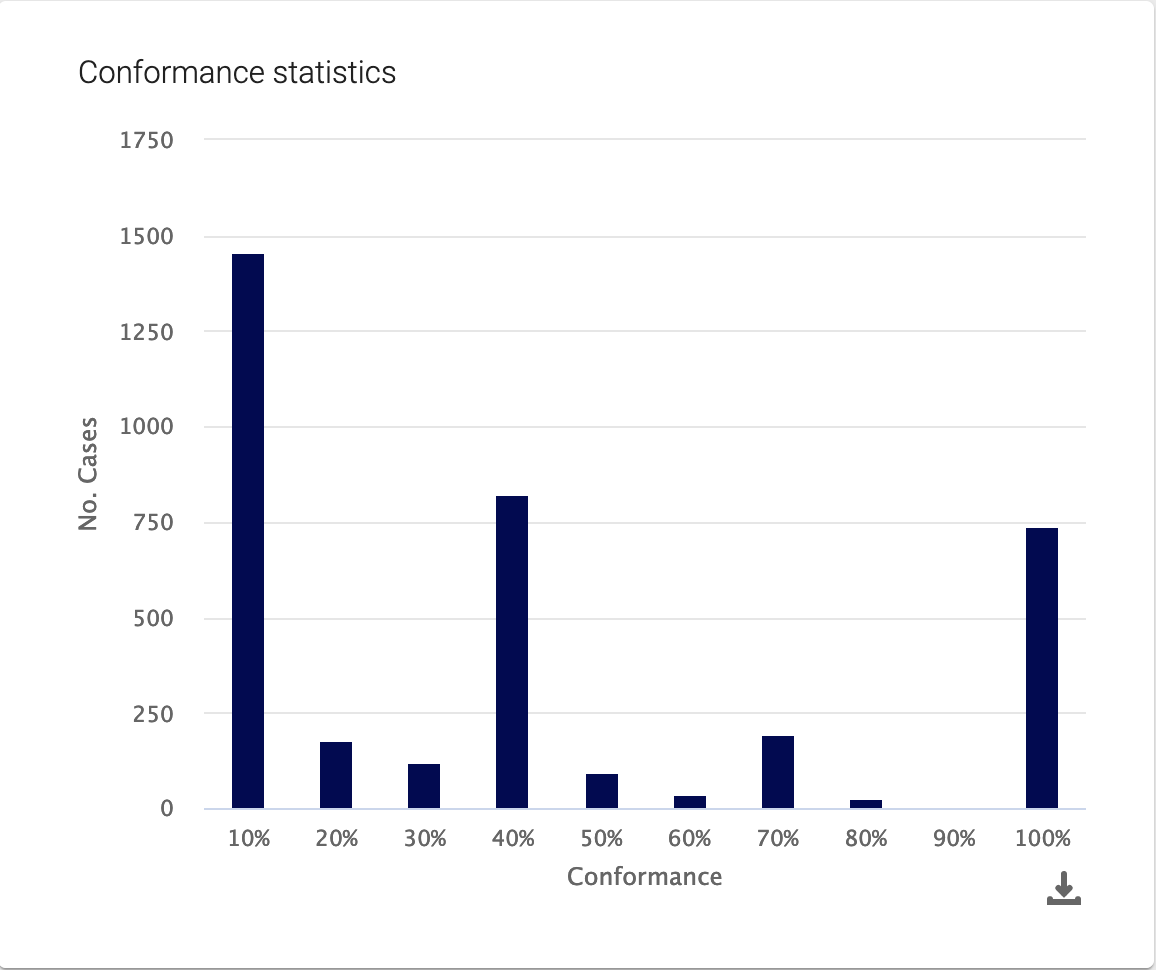
Hover over the bar to see detailed information, such as the degree of conformity and the number of cases with this degree of conformity. Export this diagram as a PNG, PDF, or SVG by clicking the download icon in the upper right-hand corner of the diagram.
Case duration shows how many cases occur within a certain run time range. Hover over the bar to see detailed information, such as the number of cases and the minimum and maximum duration of the span.
Export this diagram as a PNG, PDF, or SVG by clicking the download icon in the corner of the diagram.
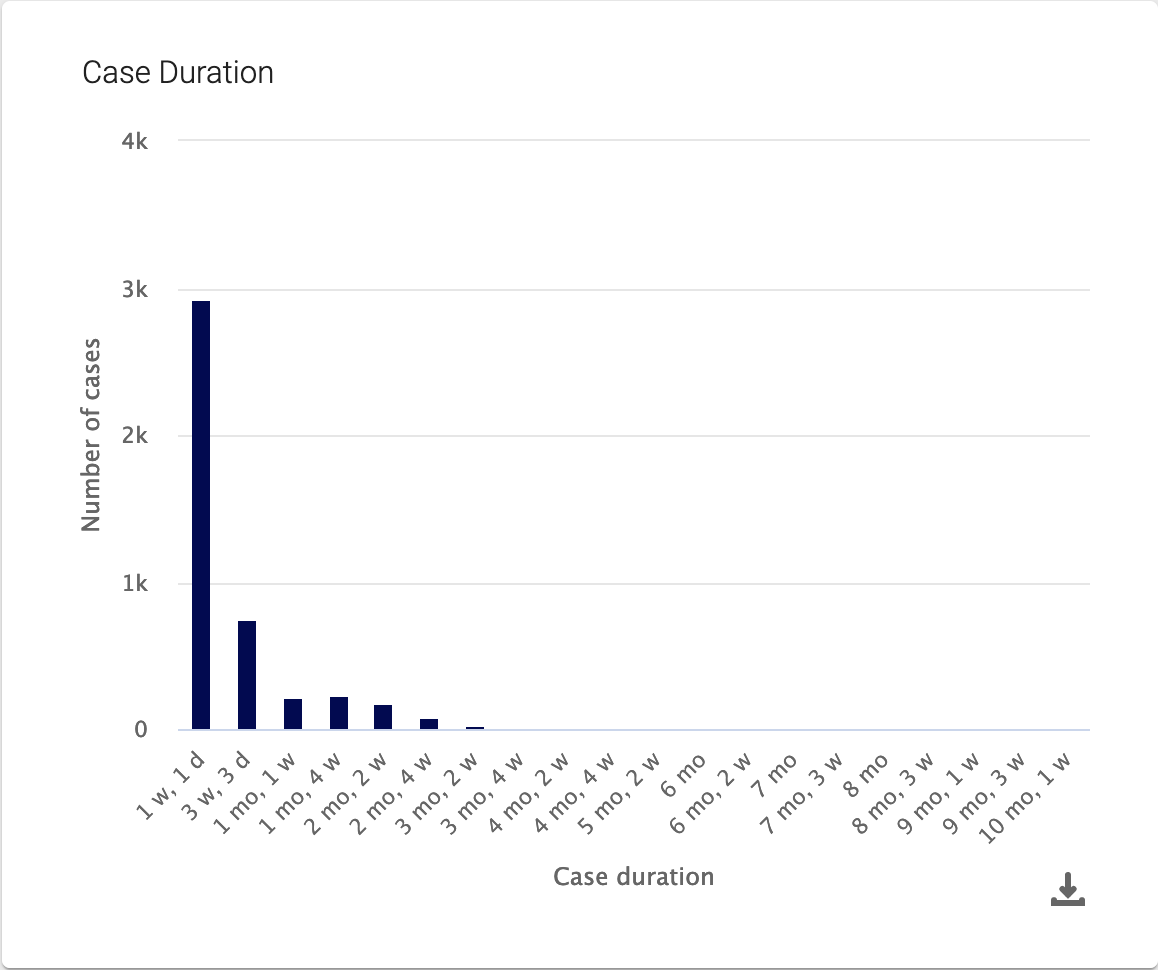
Note: This section appears only if your log contains activities that have both start and end time stamps.
Activity performance statistics show you a list of how often an activity was executed (in terms of frequency and case count) and the average, minimum, maximum, and median durations.
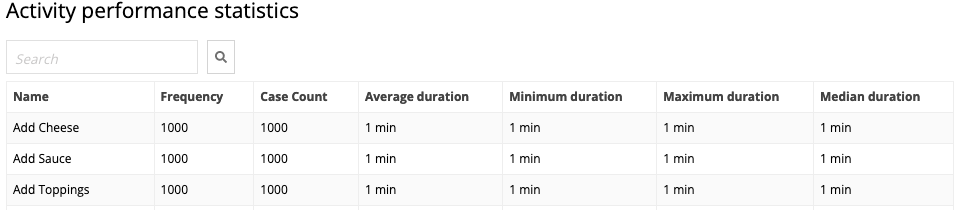
To navigate this list, you can use the search function. You can also use the page navigation to choose how many items appear per page, and navigate to pages before and after the current one.
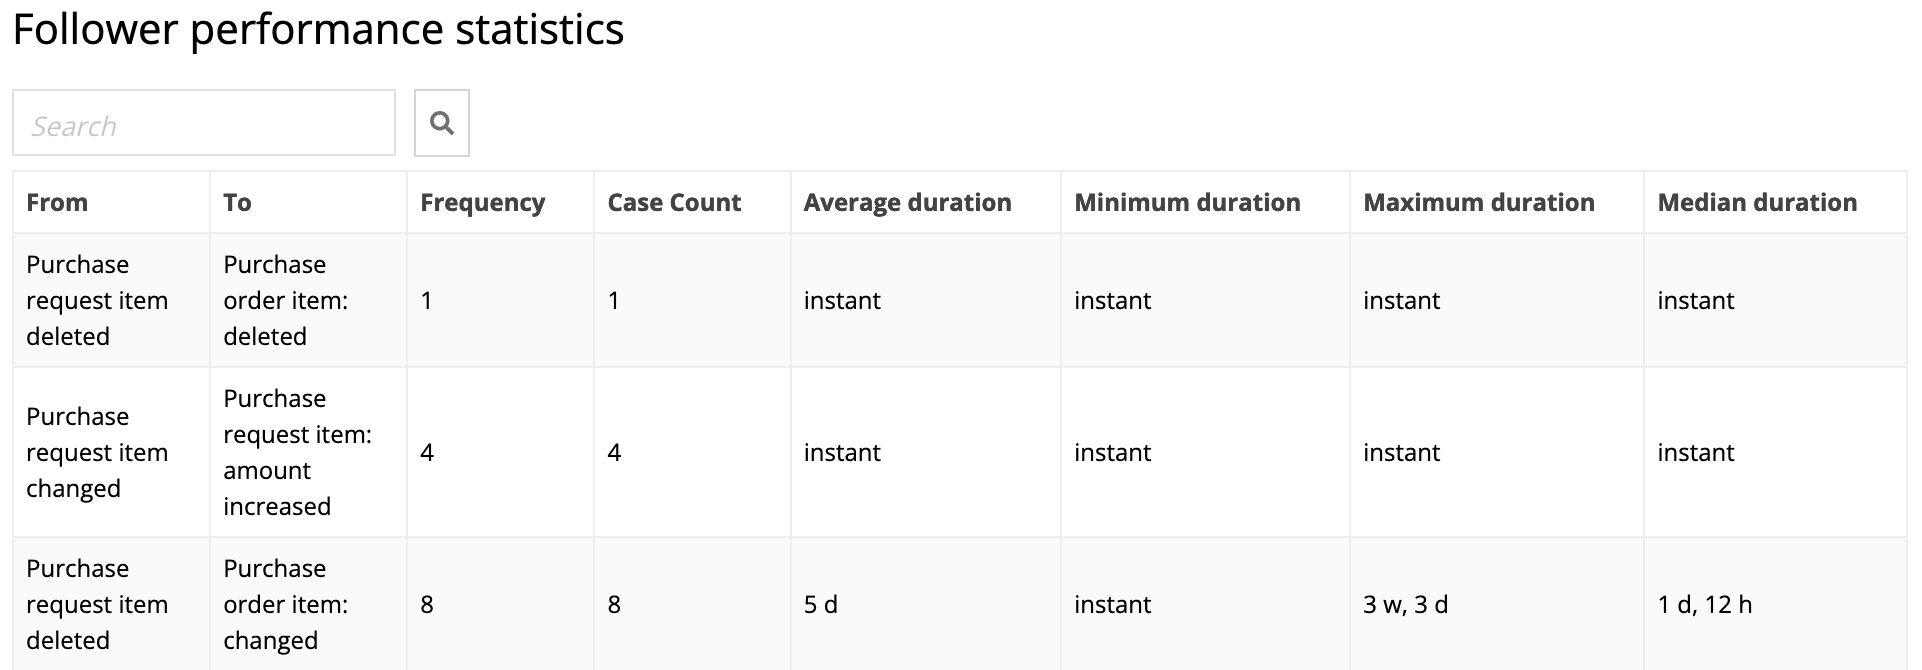
Follower performance statistics show you from path of a specific follower relationship; how often this path is traversed in terms of frequency and case count; and the average, minimum, maximum, and median durations.
To navigate this list, you can use the search function. You can also use the page navigation to choose how many items appear per page, and navigate to pages before and after the current one.