Process Reports can expose process model, process, or task data to be queried so you can report on them in your interfaces. On this page, we will walk through how to create and configure a process report, call that process report using a!queryProcessAnalytics(), and show the results of the process report in an interface.
There are several out-of-the-box system default reports available to use. If you decide to go with one of these process reports, skip to the Calling the Process Report section.
Let's start by creating a process report.
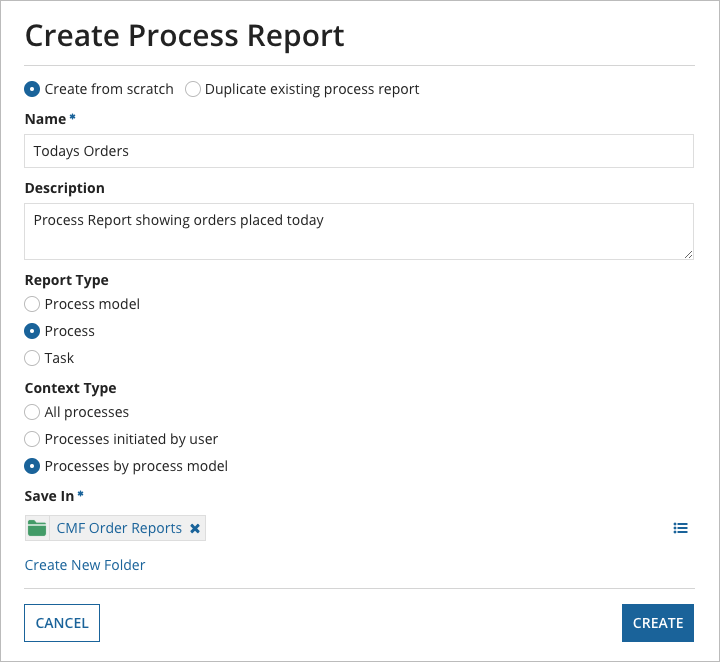
Once created, process reports start with default data. This depends on the initial report type selected. Additionally, some reports require context prior to showing default data. In our case, I need to pass in a process model to compare. For a full listing of these data options including descriptions, see the Process and Process Report Data page.
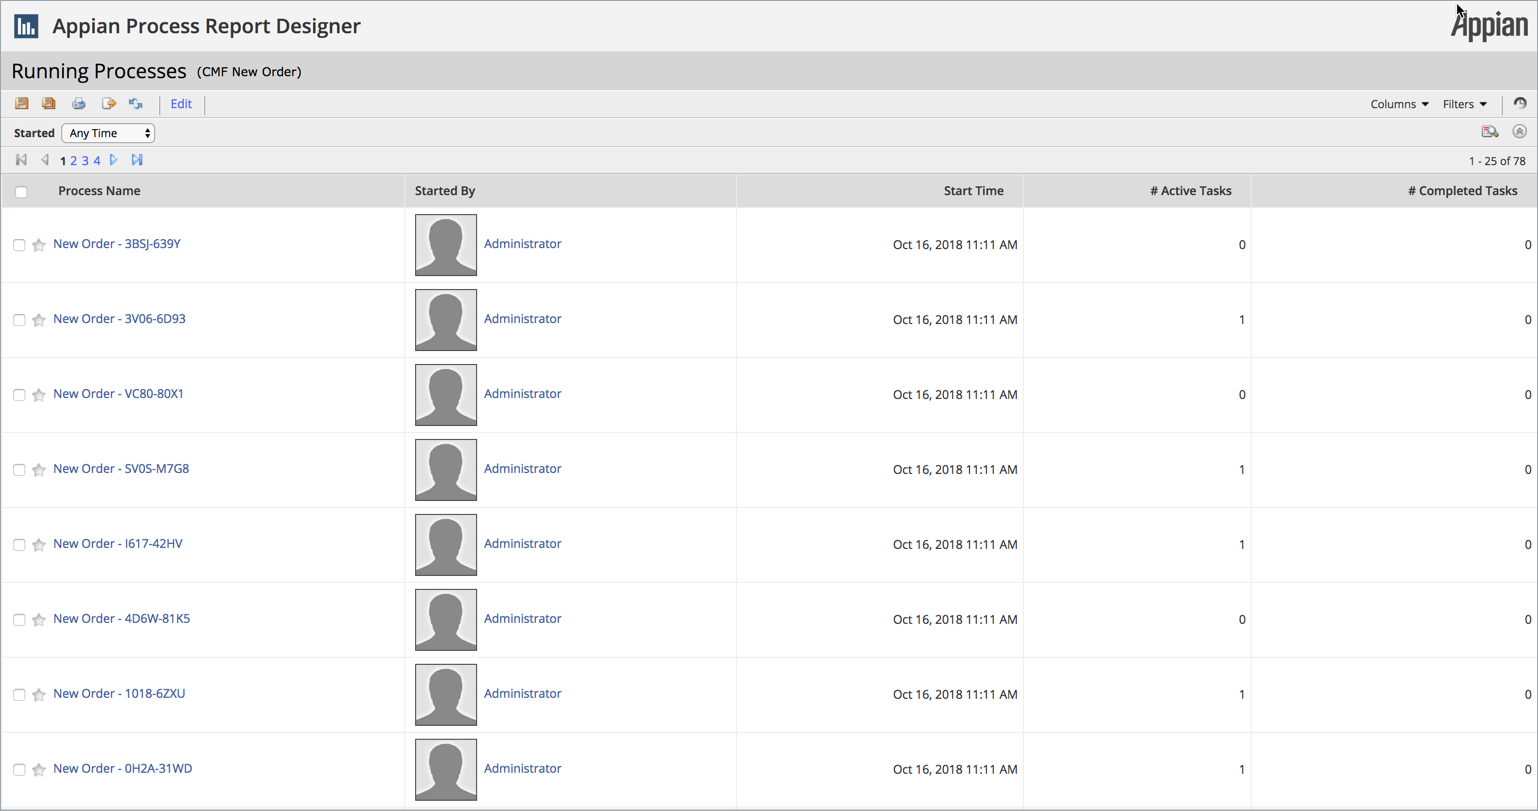
While the default data that's being used is useful, let's add some additional columns to our report.
To do this, we'll:
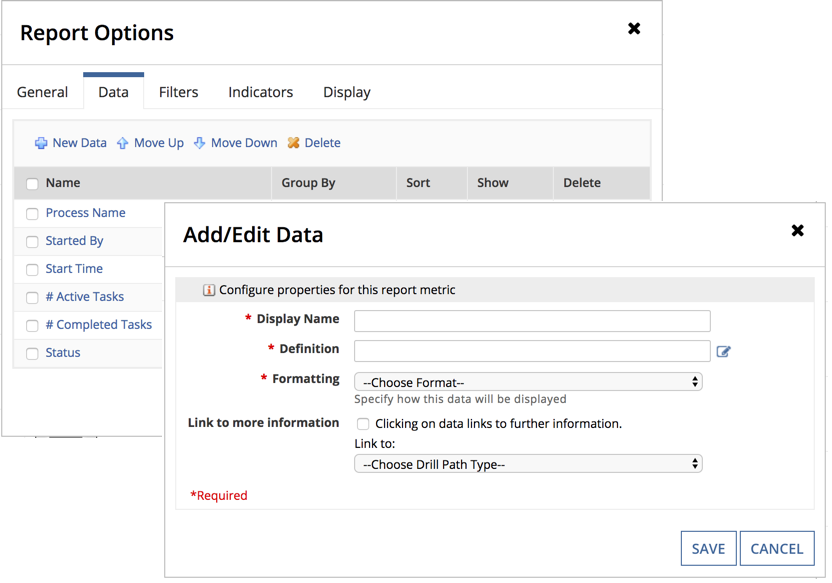
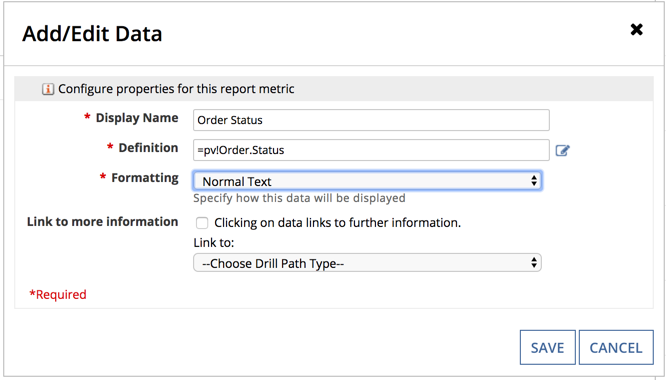
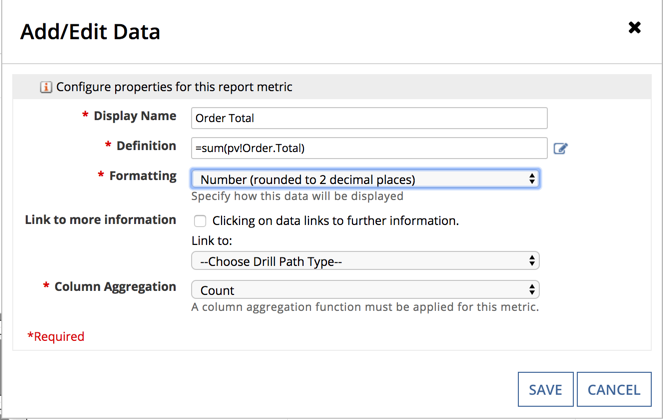
Configure the following properties:
| Properties | Description |
|---|---|
| Display Name | The name of the new column. |
| Defintion | The expression defining the data that the new colum will display. Next to the empty box, click to open the expression editor. |
| Formatting | Select a format from the dropdown list to determine how the data will display in the column. |
| Link to More Information | Links to other useful data points. However, for the purpose of this report, we don't need to specifically link to other process data. |
Tip: These links will return in the d(n) part of the datasubset when we use a!queryProcessAnalytics(), which can be used to create links to other things. Specifically, when creating task reports, linking to tp!id can be useful to create a link to a task in someone's task queue. Learn more about using task prefixes.
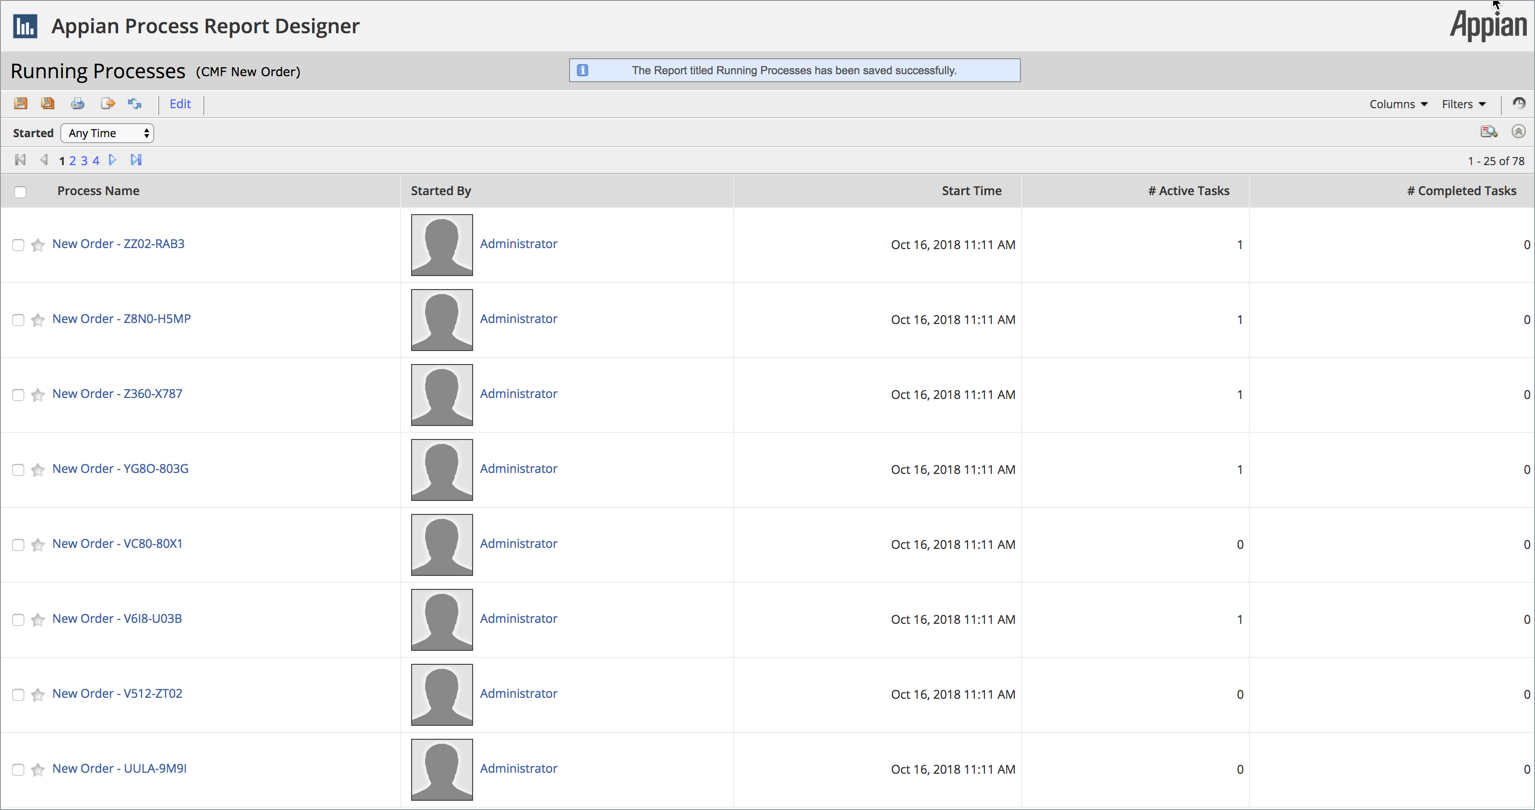
The last thing we'll do is sort the columns. This step is completely optional since we can choose to sort this data later. We're left with a process report with the data we want.
Once we've added the data columns that we want, we can begin to add a filter.
Note: There are two types of filter options available: default and quick. Only default filters are necessary when querying process reports. Quick filters only provide a filter in this designer interface.
To configure our new default filter click on the Edit link to open the Report Options dialog and then click on the Filter tab.
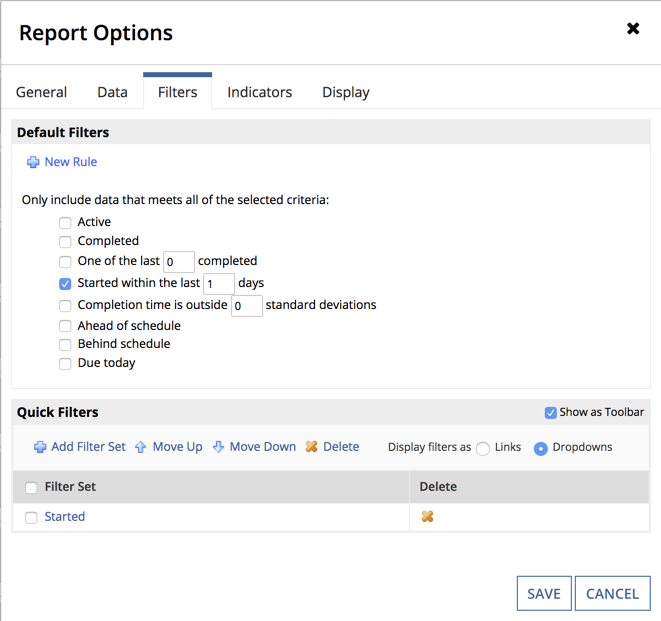
For our filter, we want to get today's orders, so we are going to select one of the out of the box filter options, Started within the last (n) days option. We can now save our process report an use it in an expression to get data to our interface.
`a!queryProcessAnalytics() lets us execute our process report and get the resulting data. Because we're dealing with expressions, we'll need to first create constants that point to our (1) process report, and (2) contextual process model.
Note: Remember that process reports are stored as documents in Appian. For process reports, create a constant with a data type of document.
With these constants, we could return our data simply by calling an expression like this:
1
2
3
4
a!queryProcessAnalytics(
  report: cons!OM_TODAYS_ORDERS,
  contextProcessModels: cons!OM_NEW_ORDER_MODEL
)
However, because we want to be able to page through our results in a Read-Only Grid, we're going to use the query parameter in a!queryProcessAnalytics() to add paging information.
1
2
3
4
5
6
7
a!queryProcessAnalytics(
  report: cons!OM_TODAYS_ORDERS,
  contextProcessModels: cons!OM_NEW_ORDER_MODEL,
  query: a!query(
    pagingInfo: ri!pagingInfo
  )
)
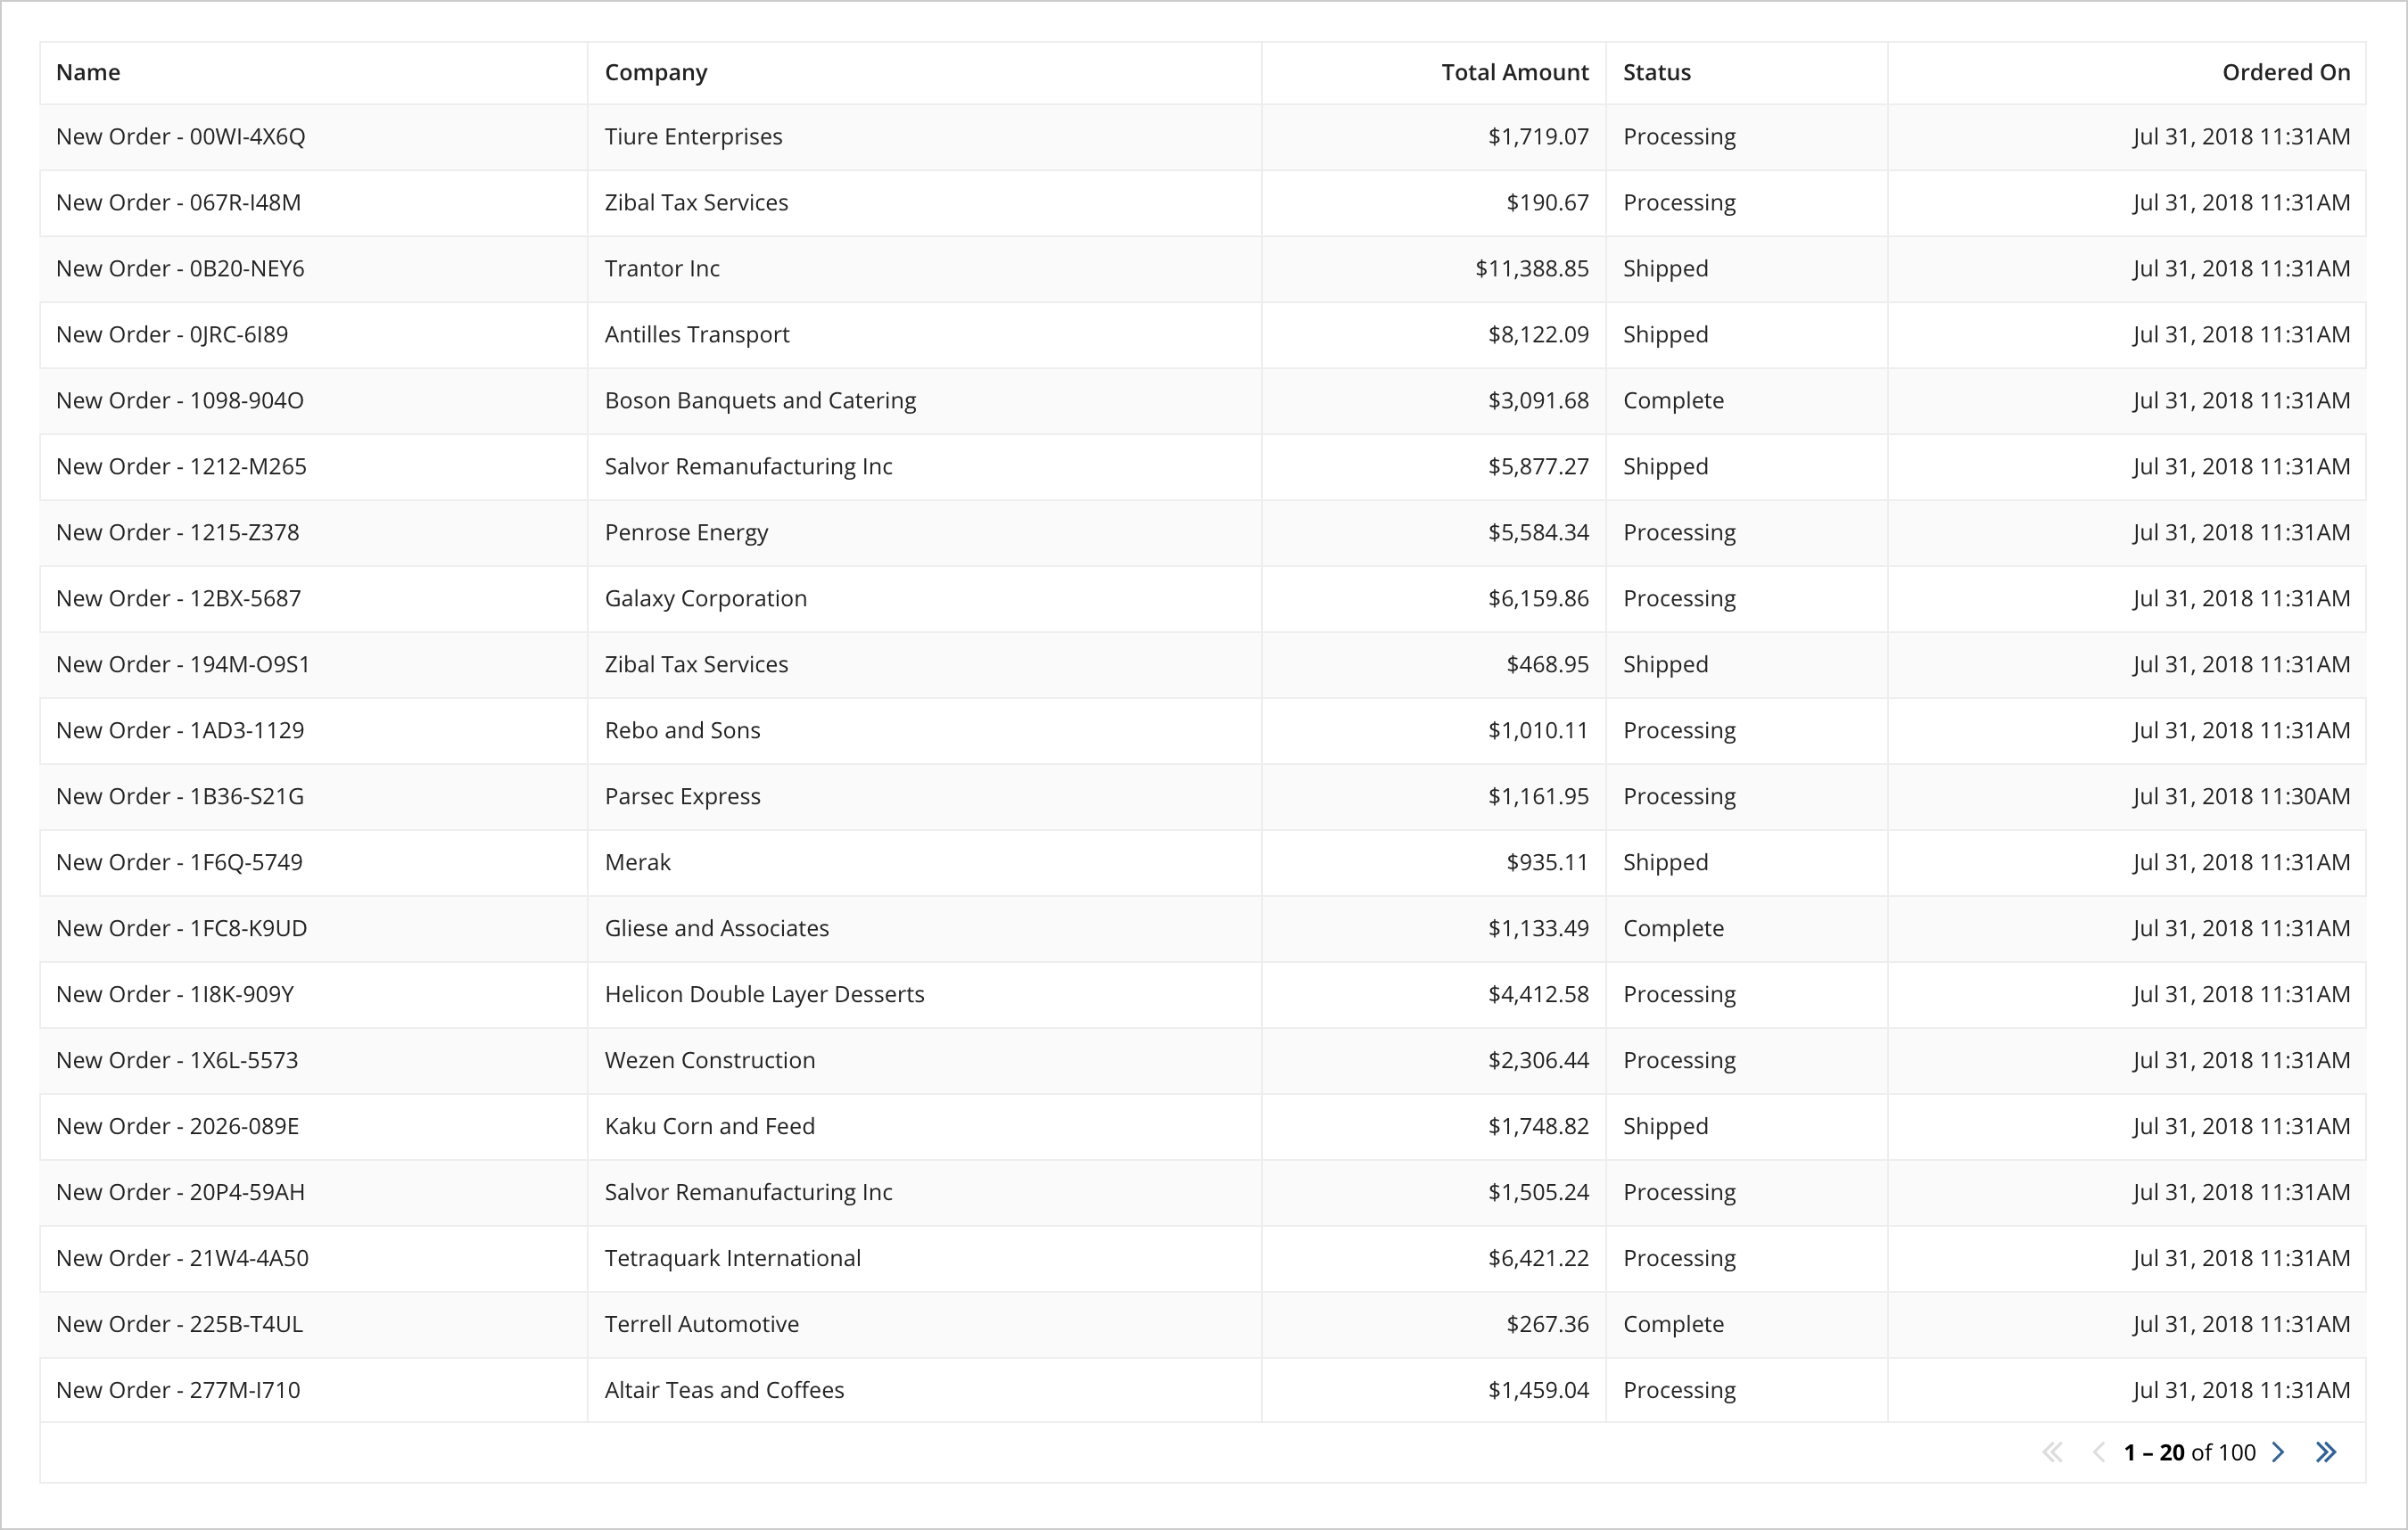
Now we'll get an expression that returns something like this:
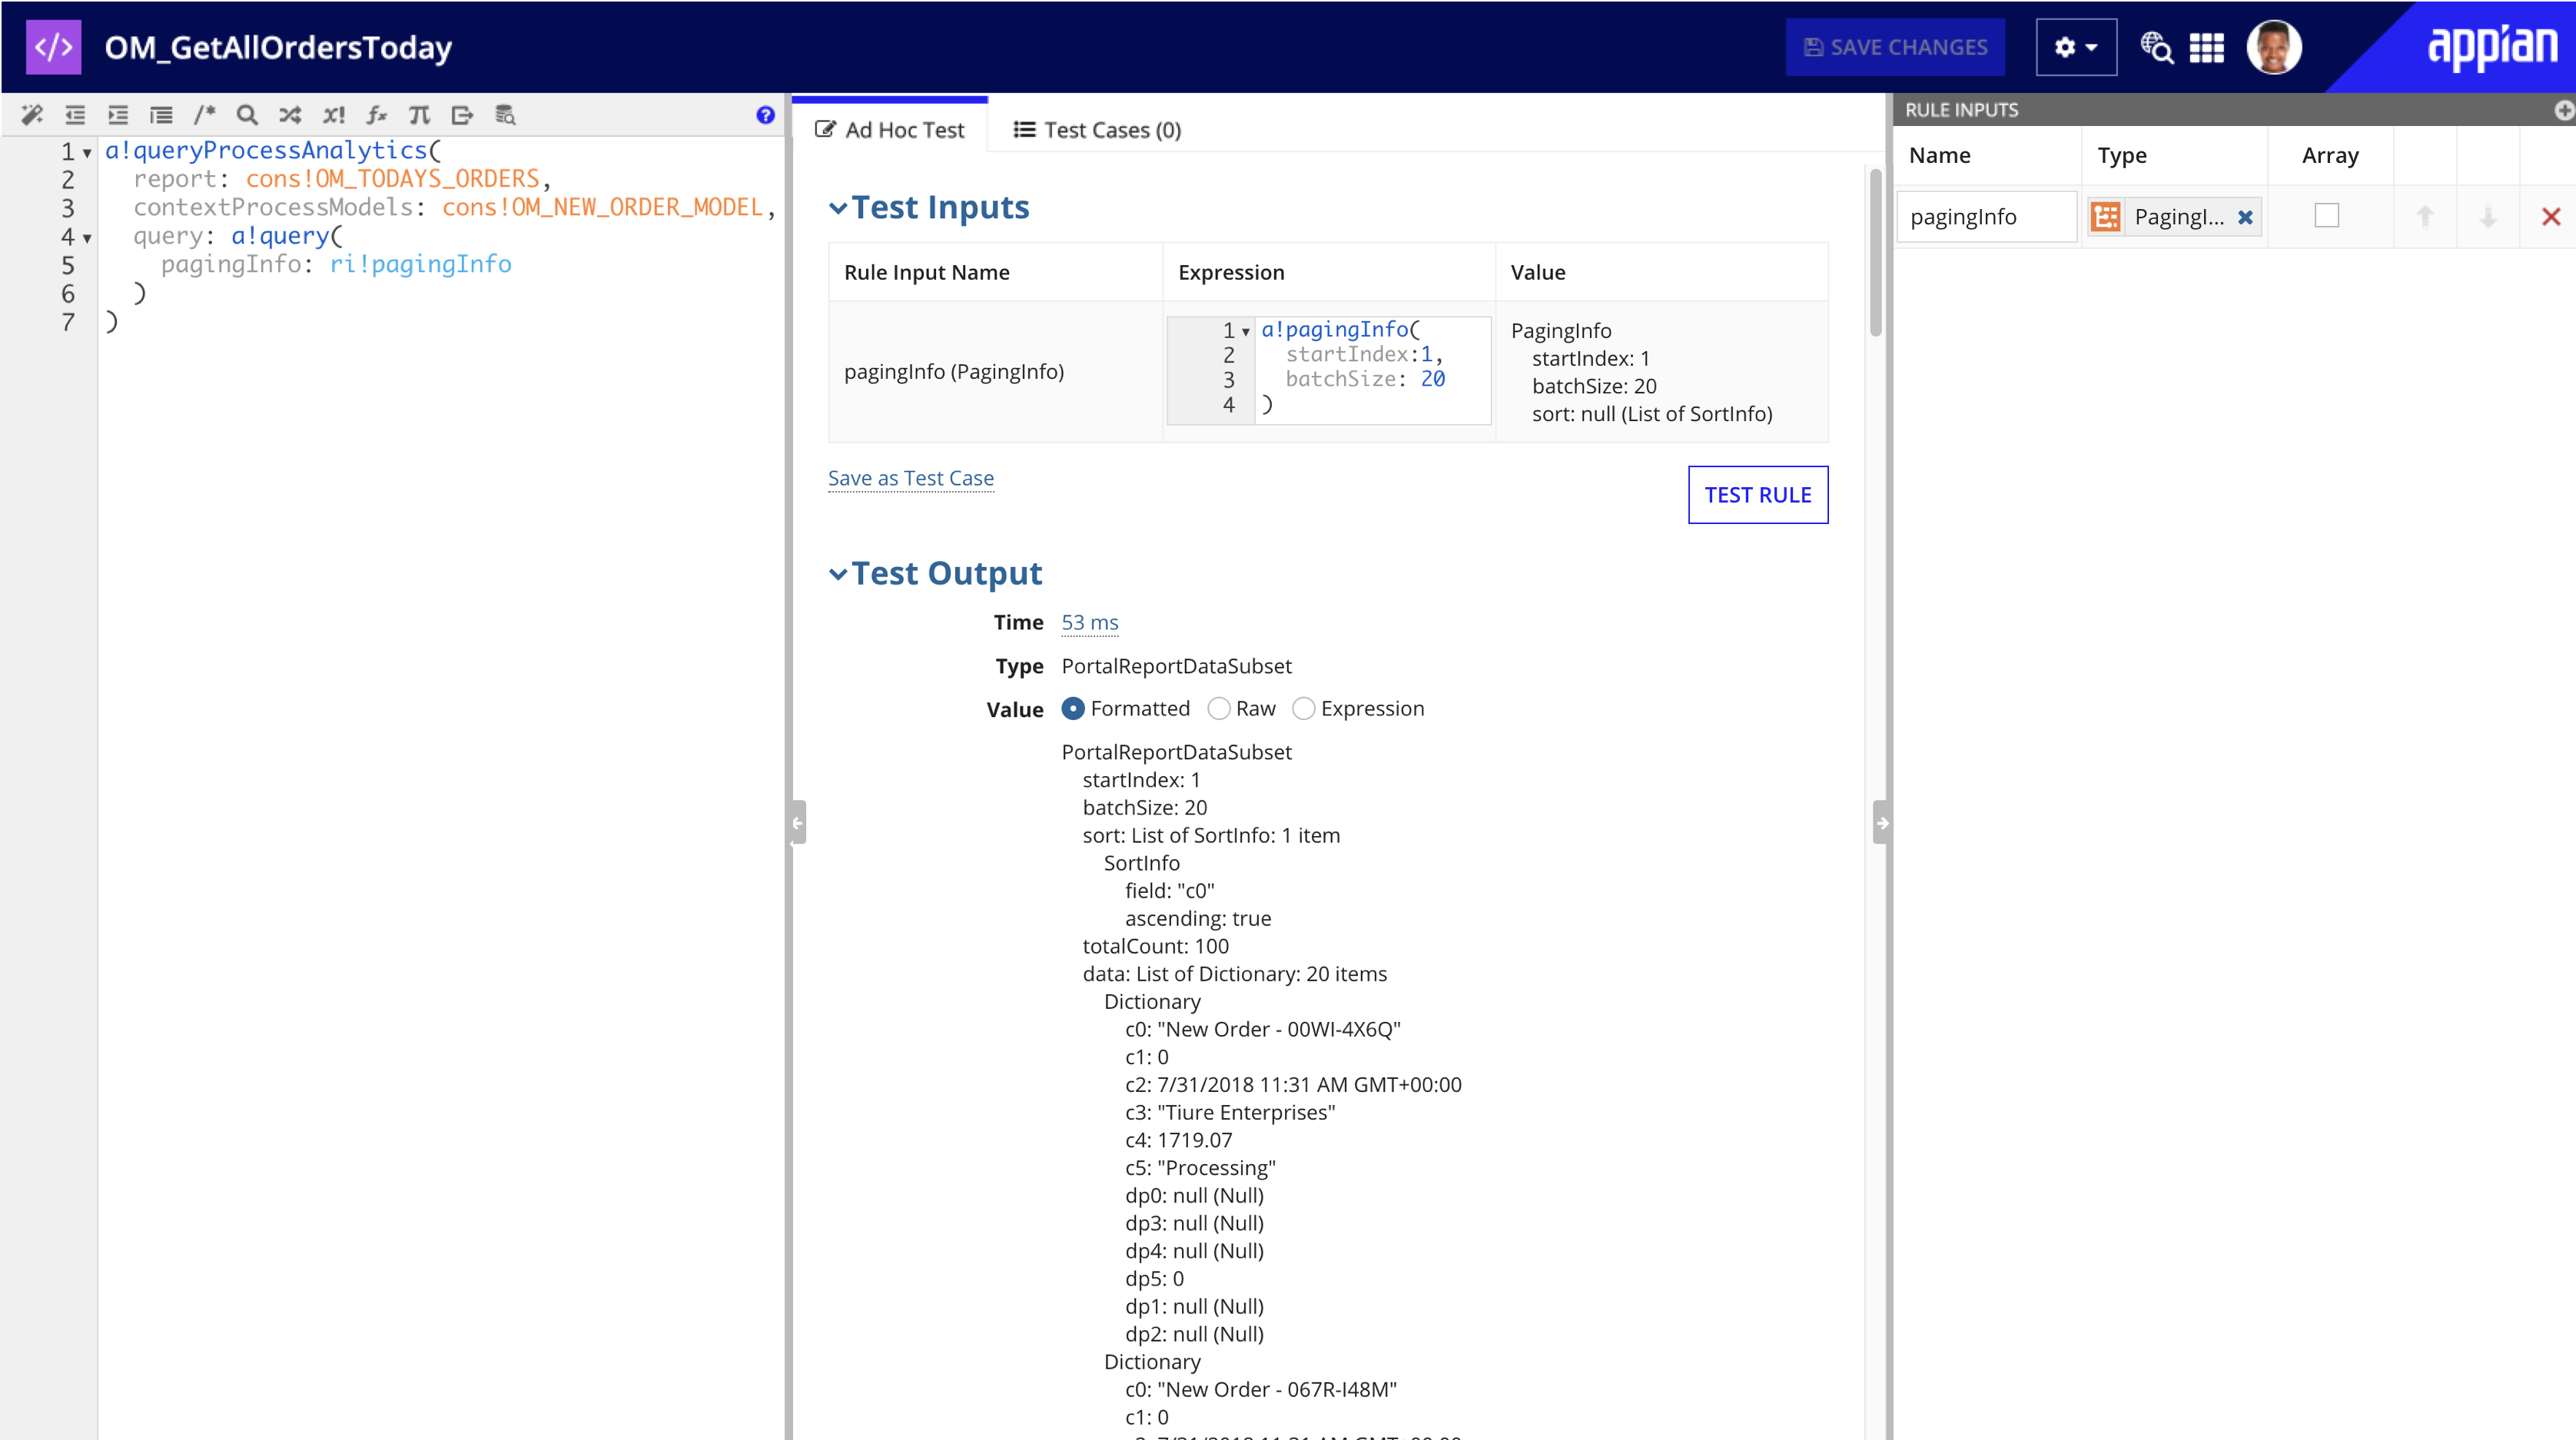
Now that we can query this report and get data from it, we can display that data however we want in interfaces.
We can create an interface either in Design Mode or Expression Mode. What's important is knowing how to use the process report data subset. A process report data subset is almost identical to a typical datasubset with two exceptions:
name, description, and columnConfigs fields that can be used. Of these the columnConfig fields help identify which data is which.data field will always have c(n) and d(n) subelements.
c(n) refer to the data columns we started with and added to our process report.d(n) refer to linked data on any columns where designers selected Link to more information option.The takeaways from these considerations means that when we are trying to use that data in an interface, our grid column configurations would look something like this.
1
2
3
4
a!gridTextColumn(
 label: "Name",
 data: index(local!dataSubset.data, "c0", null)
)
Our finished grid will look something like this:
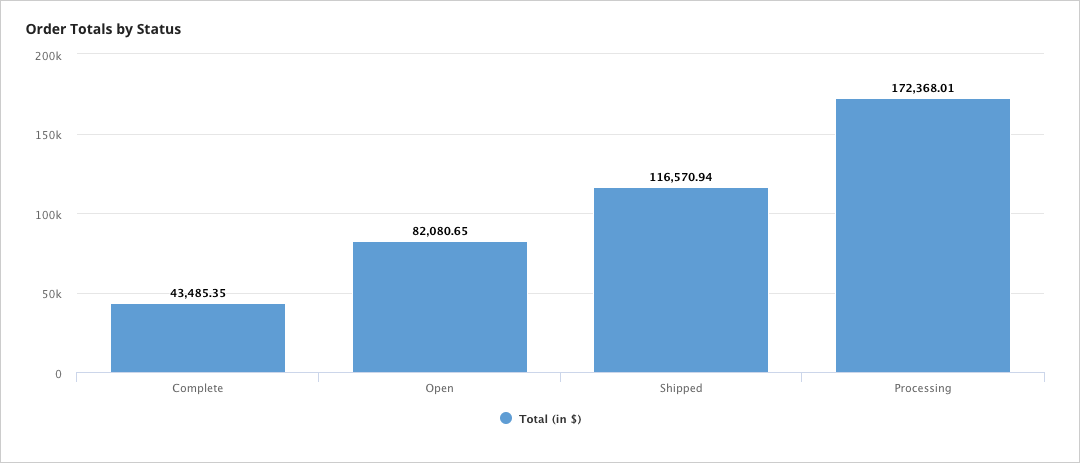
In the above example, we are displaying the data for every order. If we wanted to make a high-level chart of the amount of money that is currently held in each order status type, we could perform an aggregation on the process report itself before querying it. To do so we can create a new process report point to the same process model, but only include two columns into the report, one for order status and on for order total. We can then:
Set our grouping field as the first column by selecting checkbox next to the name and clicking Move Up until it is the first column. Next select the Group By check box.
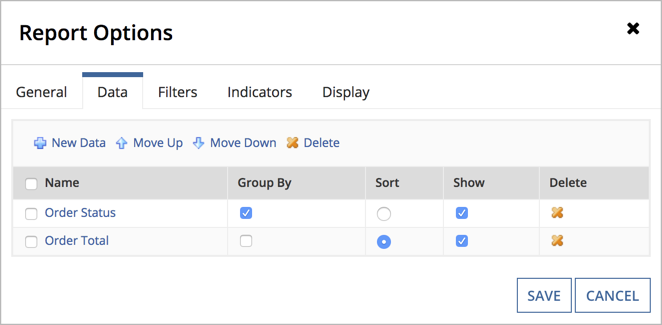
Once the grouping is configured, we can edit the Aggregation column (in or example, Order Total.
We can call this process report using a!queryProcessAnalytics() in the same expression as before and see that our data is now aggregated. That expression can be used to populate other charts or grids.