KPIs
See the developer documentation for technical details about the KPI component.
When to use a KPICopy link to clipboard
Use KPIs to display the current value of a business metric defined by the primary measure.
Add a secondary measure to show a trend, a comparison between the two measures.
Don't use KPIs to show values that are not indicative of an important metric or trend.
TrendsCopy link to clipboard
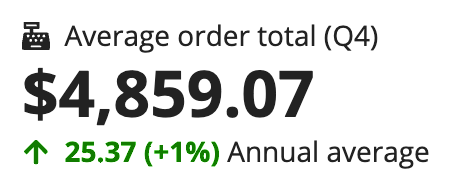
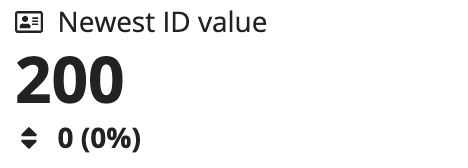
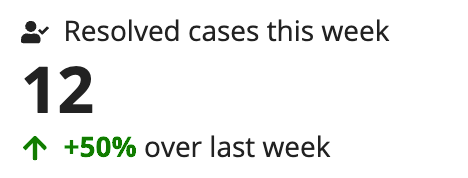
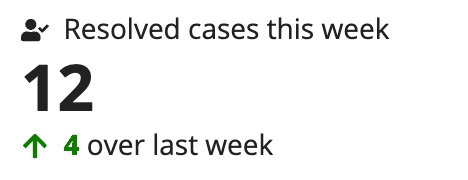
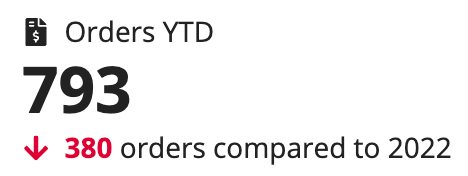
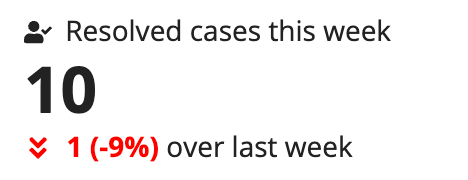
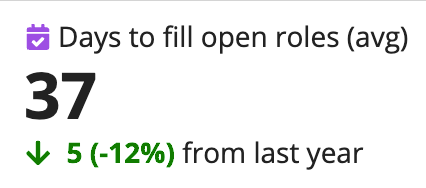
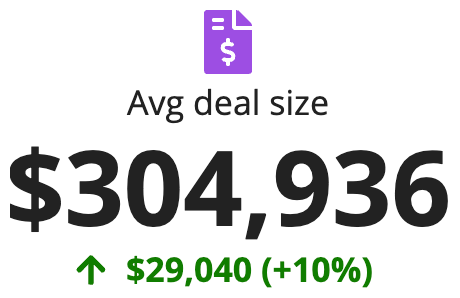
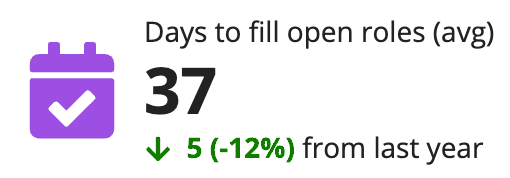
Trends let you display a calculated comparison of the primary and secondary measures. By default, the trend will show both the numeric difference and percentage change.
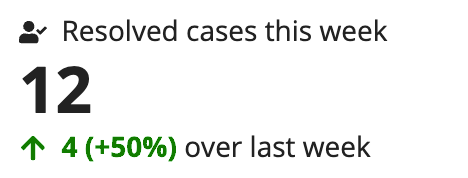
Use the "Percentage" option to show only the percentage change between the primary and secondary measures.
Use the "Difference" option to show only the actual value difference between the primary and secondary measures.
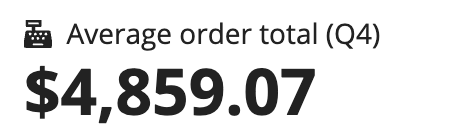
KPI display textCopy link to clipboard
The KPI's primary text is displayed prominently above the KPI's primary measure. Use primary text to describe the value that the measure represents.
Secondary text is shown next to the secondary measure. Use secondary text to label the value that the secondary measure represents.
IconsCopy link to clipboard
The KPI component uses icons to help users identify the KPI on a complex interface and give extra context to the data.
By default, an arrow icon appears next to the calculated trend value. This icon can be changed by creating an expression comparing the fv!primaryMeasure and fv!secondaryMeasure variables. Use this expression in an a!match() to select the icon you want to appear based on the evaluation. Make sure to include icon values for positive change, negative change, and a default value for no change.
TemplatesCopy link to clipboard
Three templates are available to let you quickly style the component.
The default template, "COMPACT", shows the icon and primary text on the same line. Below that, the value of the primary measure is prominently displayed. If you add a trend, this is shown at the bottom of the component.
On a mobile device or in layouts with minimal horizontal space, you may choose to use the "STACKED" template. This puts each major element of the KPI on a separate line. The following example also has the align parameter set to "CENTER".
On a dense dashboard, it may help to have a large icon to draw the eye to important data. The "ADJACENT" template places a larger icon next to the text and trend data for maximum visual impact.
ExamplesCopy link to clipboard
KPIs with supporting dataCopy link to clipboard
Using a KPI with other data display components can help users understand the data on your dashboards faster and put that information in context to make better decisions.
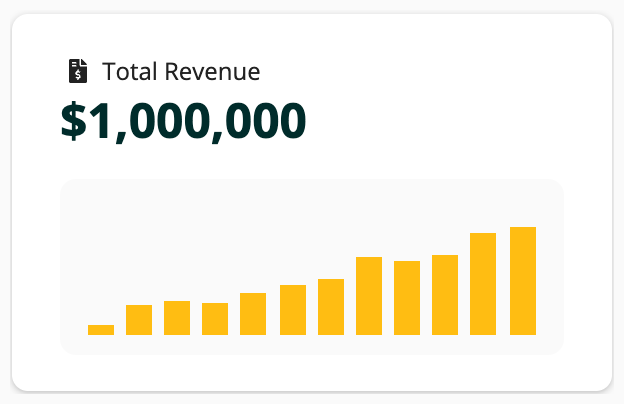
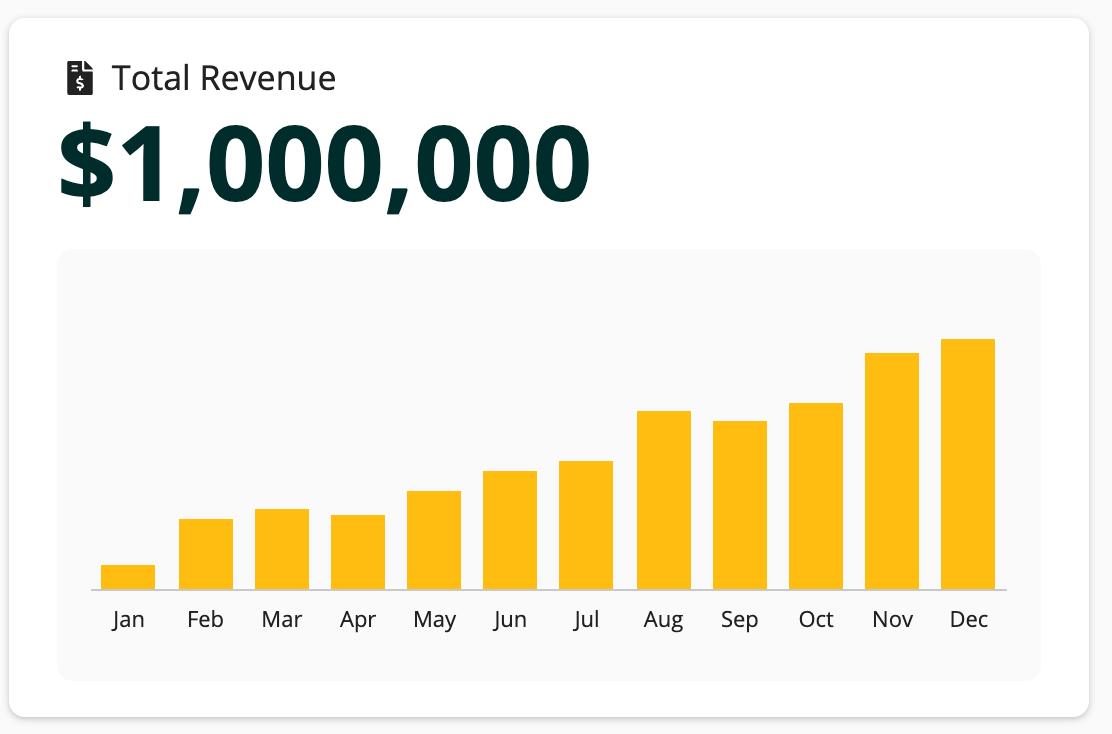
KPI with chartCopy link to clipboard
You can combine KPIs with charts to show the current value of a metric and its performance over time. This context helps users visualize and see the details of the change over time.
This combined display can be built by adding a KPI component and a column chart to a card layout. Because both KPIs and charts are built with records, you can quickly configure each component to show the relevant record data.
1
2
3
4
5
6
7
8
9
10
11
12
13
14
15
16
17
18
19
20
21
22
23
24
25
26
27
28
29
30
31
32
33
34
35
36
37
38
39
40
41
42
43
44
45
46
47
48
49
50
51
52
53
54
55
56
57
58
59
60
61
62
63
64
65
66
67
68
69
70
71
72
73
74
75
76
77
78
79
80
81
82
83
84
85
86
87
88
89
90
91
92
93
a!cardLayout(
  contents: {
    a!kpiField(
      /* Select a record type for the data parameter */
      data: null,
      primaryText: "Total Revenue",
      icon: "file-invoice-dollar",
      size: "SMALL"
    ),
    a!sectionLayout(
      label: "",
      contents: {},
      marginAbove: "NONE",
      marginBelow: "NONE"
    ),
    a!cardLayout(
      contents: {
        a!columnChartField(
          label: "",
          categories: {
            "Jan",
            "Feb",
            "Mar",
            "Apr",
            "May",
            "Jun",
            "Jul",
            "Aug",
            "Sep",
            "Oct",
            "Nov",
            "Dec"
          },
          series: {
            a!chartSeries(
              label: "2023 Total Revenue",
              data: {
                100000,
                290000,
                330000,
                300000,
                400000,
                480000,
                520000,
                720000,
                680000,
                750000,
                950000,
                1000000
              }
            )
          },
          xAxisTitle: "",
          yAxisTitle: "",
          yAxisMin: null,
          yAxisMax: 1250000,
          stacking: "NORMAL",
          referenceLines: a!chartReferenceLine(
            value: 1.85E3,
            color: "#2E2E35",
            style: "SHORTDASH"
          ),
          showLegend: false,
          showDataLabels: false,
          showTooltips: true,
          allowDecimalAxisLabels: false,
          labelPosition: "COLLAPSED",
          colorScheme: a!colorSchemeCustom(
            colors: {
              "#ffbc11",
              "#9d4de3",
              "#F3961F",
              "#18b4ab",
              "#F9CC00"
            }
          ),
          height: "MICRO",
          xAxisStyle: "NONE",
          yAxisStyle: "NONE"
        )
      },
      style: "#FAFAFA",
      shape: "ROUNDED",
      padding: "LESS",
      showBorder: false
    )
  },
  height: "AUTO",
  shape: "ROUNDED",
  padding: "STANDARD",
  showBorder: false,
  showShadow: true()
)
1
2
3
4
5
6
7
8
9
10
11
12
13
14
15
16
17
18
19
20
21
22
23
24
25
26
27
28
29
30
31
32
33
34
35
36
37
38
39
40
41
42
43
44
45
46
47
48
49
50
51
52
53
54
55
56
57
58
59
60
a!cardLayout(
  contents: {
    a!kpiField(
      /* Select a record type for the data parameter */
      data: null,
      primaryText: "Total Revenue",
      icon: "file-invoice-dollar",
      size: "LARGE"
    ),
    a!sectionLayout(
      label: "",
      contents: {},
      marginAbove: "NONE",
      marginBelow: "NONE"
    ),
    a!cardLayout(
      contents: {
        a!columnChartField(
          label: "",
          categories: { "Jan", "Feb", "Mar", "Apr", "May", "Jun", "Jul", "Aug", "Sep", "Oct", "Nov", "Dec" },
          series: {
            a!chartSeries(label: "2023 Total Revenue", data: { 100000, 290000, 330000, 300000, 400000,480000,520000,720000,680000,750000,950000,1000000})
          },
          xAxisTitle: "",
          yAxisTitle: "",
          yAxisMin: null,
          yAxisMax: 1250000,
          stacking: "NORMAL",
          referenceLines: a!chartReferenceLine(value: 1.85E3, color: "#2E2E35", style: "SHORTDASH"),
          showLegend: false,
          showDataLabels: false,
          showTooltips: true,
          allowDecimalAxisLabels: false,
          labelPosition: "COLLAPSED",
          colorScheme: a!colorSchemeCustom(
            colors: {
              "#ffbc11",
              "#9d4de3",
              "#F3961F",
              "#18b4ab",
              "#F9CC00"
            }
          ),
          height: "SHORT",
          xAxisStyle: "STANDARD",
          yAxisStyle: "NONE"
        )
      },
      style: "#FAFAFA",
      shape: "ROUNDED",
      padding: "LESS",
      showBorder: false
    )
  },
  height: "AUTO",
  shape: "ROUNDED",
  padding: "STANDARD",
  showBorder: false,
  showShadow: true()
)
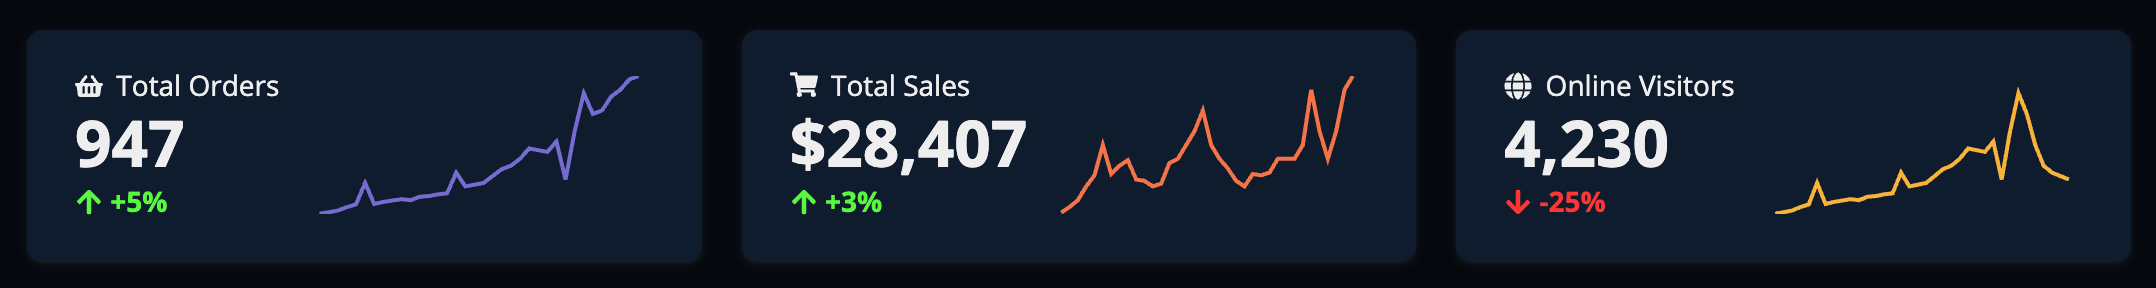
KPI with sparklineCopy link to clipboard
Another option for visualizing performance is to combine a KPI with a sparkline. This is a small line chart that shows the movement of the metric over time.
If you are showing multiple metrics, the sparkline and KPI should be placed in a card layout or other container to provide visual separation.
1
2
3
4
5
6
7
8
9
10
11
12
13
14
15
16
17
18
19
20
21
22
23
24
25
26
27
28
29
30
31
32
33
34
35
36
37
38
39
40
41
42
43
44
45
46
47
48
49
50
51
52
53
54
55
56
57
58
59
60
61
62
63
64
65
66
67
68
69
70
71
72
73
74
75
76
77
78
79
80
81
82
83
84
85
86
87
88
89
90
91
92
93
94
95
96
97
98
99
100
101
102
103
104
105
106
107
108
109
110
111
112
113
114
115
116
117
118
119
120
121
122
123
124
125
126
127
128
129
130
131
132
133
134
135
136
137
138
139
140
141
142
143
144
145
146
147
148
149
150
151
152
153
154
155
156
157
158
159
160
161
162
163
164
165
166
167
168
169
170
171
172
173
174
175
176
177
178
179
180
181
182
183
184
185
186
187
188
189
190
191
192
193
194
195
196
197
198
199
200
201
202
203
204
205
206
207
208
209
210
211
212
213
214
215
216
217
218
219
220
221
222
223
224
225
226
227
228
229
230
231
232
233
234
235
236
237
238
239
240
241
242
243
244
245
246
247
248
249
250
251
252
253
254
255
256
257
258
259
260
261
262
263
264
265
266
267
268
269
270
271
272
273
274
275
276
277
278
279
280
281
282
283
284
285
286
287
288
289
290
291
292
293
294
295
296
297
298
299
300
301
302
303
304
305
306
307
308
309
310
311
312
313
314
315
316
317
318
319
320
321
322
323
324
325
326
327
328
329
330
331
332
333
334
335
336
337
338
339
340
341
342
343
344
345
346
347
348
349
350
351
352
353
354
355
356
357
358
359
360
361
362
363
364
365
366
367
368
369
370
371
372
373
374
375
376
377
378
379
380
381
382
383
384
385
386
387
388
389
390
391
392
393
394
395
a!columnsLayout(
columns: {
a!columnLayout(
contents: {
a!cardLayout(
contents: {
a!sideBySideLayout(
items: {
a!sideBySideItem(
item: a!kpiField(
/* Select a record type for the data parameter */
data: null,
primaryText: "Total Orders",
icon: "shopping-basket",
trend: "PERCENTAGE",
size: "STANDARD",
),
width: "MINIMIZE"
),
a!sideBySideItem(
item: a!lineChartField(
label: "",
labelPosition: "COLLAPSED",
categories: {
"Jan",
"Feb",
"Mar",
"Apr",
"May",
"Jun",
"Jul",
"Aug",
"Sep",
"Oct",
"Nov",
"Dec",
"Jan",
"Feb",
"Mar",
"Apr",
"May",
"Jun",
"Jul",
"Aug",
"Sep",
"Oct",
"Nov",
"Dec",
"Jan",
"Feb",
"Mar",
"Apr",
"May",
"Jun",
"Jul",
"Aug",
"Sep",
"Oct",
"Nov",
"Dec"
},
series: {
a!chartSeries(
label: "2023 Total Revenue",
data: {
1,
5,
10,
20,
28,
90,
29,
35,
39,
43,
40,
50,
52,
57,
60,
120,
80,
85,
90,
110,
130,
140,
160,
190,
185,
180,
210,
100,
240,
350,
290,
300,
340,
360,
390,
400
}
)
},
xAxisTitle: "",
yAxisTitle: "",
yAxisMin: null,
yAxisMax: null,
referenceLines: a!chartReferenceLine(value: null, style: "SOLID"),
showLegend: false,
showDataLabels: false,
showTooltips: false,
allowDecimalAxisLabels: false,
connectNulls: false,
colorScheme: a!colorSchemeCustom(colors: { "#756BD1", "#5448C6" }),
height: "MICRO",
xAxisStyle: "NONE",
yAxisStyle: "NONE"
),
width: "AUTO"
)
}
)
},
style: "#0F1C2E",
shape: "ROUNDED",
padding: "STANDARD",
showBorder: false(),
showShadow: true()
)
}
),
a!columnLayout(
contents: {
a!cardLayout(
contents: {
a!sideBySideLayout(
items: {
a!sideBySideItem(
item: a!kpiField(
data: null,
primaryText: "Total Sales",
icon: "shopping-cart",
trend: "PERCENTAGE",
size: "STANDARD",
),
width: "MINIMIZE"
),
a!sideBySideItem(
item: a!lineChartField(
label: "",
labelPosition: "COLLAPSED",
categories: {
"Jan",
"Feb",
"Mar",
"Apr",
"May",
"Jun",
"Jul",
"Aug",
"Sep",
"Oct",
"Nov",
"Dec",
"Jan",
"Feb",
"Mar",
"Apr",
"May",
"Jun",
"Jul",
"Aug",
"Sep",
"Oct",
"Nov",
"Dec",
"Jan",
"Feb",
"Mar",
"Apr",
"May",
"Jun",
"Jul",
"Aug",
"Sep",
"Oct",
"Nov",
"Dec"
},
series: {
a!chartSeries(
label: "2023 Total Revenue",
data: {
1,
5,
10,
20,
28,
50,
29,
35,
39,
25,
24,
20,
22,
37,
40,
50,
60,
75,
50,
40,
33,
24,
20,
29,
28,
30,
40,
40,
40,
50,
90,
60,
40,
60,
90,
100
}
)
},
xAxisTitle: "",
yAxisTitle: "",
yAxisMin: null,
yAxisMax: null,
referenceLines: a!chartReferenceLine(value: null, style: "SOLID"),
showLegend: false,
showDataLabels: false,
showTooltips: false,
allowDecimalAxisLabels: false,
connectNulls: false,
colorScheme: a!colorSchemeCustom(colors: { "#F47348", "#5448C6" }),
height: "MICRO",
xAxisStyle: "NONE",
yAxisStyle: "NONE"
),
width: "AUTO"
)
}
)
},
style: "#0F1C2E",
shape: "ROUNDED",
padding: "STANDARD",
showBorder: false(),
showShadow: true()
)
}
),
a!columnLayout(
contents: {
a!cardLayout(
contents: {
a!sideBySideLayout(
items: {
a!sideBySideItem(
item: a!kpiField(
data: null,
primaryText: "Online Visitors",
icon: "globe-alt",
trend: "PERCENTAGE",
size: "STANDARD",
),
width: "MINIMIZE"
),
a!sideBySideItem(
item: a!lineChartField(
label: "",
labelPosition: "COLLAPSED",
categories: {
"Jan",
"Feb",
"Mar",
"Apr",
"May",
"Jun",
"Jul",
"Aug",
"Sep",
"Oct",
"Nov",
"Dec",
"Jan",
"Feb",
"Mar",
"Apr",
"May",
"Jun",
"Jul",
"Aug",
"Sep",
"Oct",
"Nov",
"Dec",
"Jan",
"Feb",
"Mar",
"Apr",
"May",
"Jun",
"Jul",
"Aug",
"Sep",
"Oct",
"Nov",
"Dec"
},
series: {
a!chartSeries(
label: "2023 Total Revenue",
data: {
1,
5,
10,
20,
28,
90,
29,
35,
39,
43,
40,
50,
52,
57,
60,
120,
80,
85,
90,
110,
130,
140,
160,
190,
185,
180,
210,
100,
240,
350,
290,
200,
140,
120,
110,
100
}
)
},
xAxisTitle: "",
yAxisTitle: "",
yAxisMin: null,
yAxisMax: null,
referenceLines: a!chartReferenceLine(value: null, style: "SOLID"),
showLegend: false,
showDataLabels: false,
showTooltips: false,
allowDecimalAxisLabels: false,
connectNulls: false,
colorScheme: a!colorSchemeCustom(colors: { "#F8B439", "#5448C6" }),
height: "MICRO",
xAxisStyle: "NONE",
yAxisStyle: "NONE"
),
width: "AUTO"
)
}
)
},
style: "#0F1C2E",
shape: "ROUNDED",
padding: "STANDARD",
showBorder: false(),
showShadow: true()
)
}
)
}
),
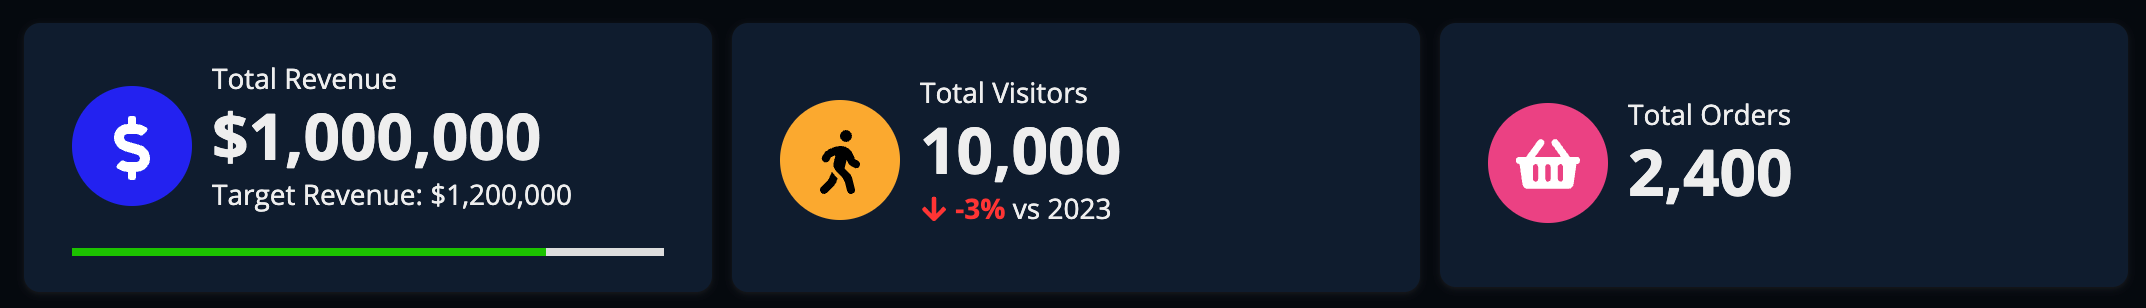
KPI with progress barCopy link to clipboard
For tracking progress toward a goal, you can combine a KPI with a progress bar.
If you are showing multiple metrics, the progress bar and KPI should be placed in a card layout or other container to provide visual separation.
1
2
3
4
5
6
7
8
9
10
11
12
13
14
15
16
17
18
19
20
21
22
23
24
25
26
27
28
29
30
31
32
33
34
35
36
37
38
39
40
41
42
43
44
45
46
47
48
49
50
51
52
53
54
55
56
57
58
59
60
61
62
63
64
65
66
67
68
69
70
71
72
73
74
75
76
77
78
79
80
81
82
83
84
85
a!columnslayout(
  columns: {
    a!columnLayout(
      contents: a!cardLayout(
        contents: {
          a!cardLayout(
            contents: {
              a!kpiField(
                /* Select a record type for the data parameter */
                data: null,
                template: "ADJACENT",
                iconStyle: "STAMP",
                icon: "usd",
                primaryText: "Total Revenue",
                trend: "NONE",
                secondaryText: "Target Revenue: $1,200,000"
              ),
              a!progressBarField(
                labelPosition: "COLLAPSED",
                percentage: 80,
                color: "POSITIVE",
                style: "THIN",
                marginAbove: "LESS",
                marginBelow: "NONE",
                showPercentage: false()
              )
            },
            style: "TRANSPARENT",
            padding: "NONE",
            showBorder: false
          )
        },
        style: "#0F1C2E",
        shape: "ROUNDED",
        padding: "STANDARD",
        showBorder: false,
        showShadow: true()
      )
    ),
    a!columnLayout(
      contents: a!cardLayout(
        contents: {
          a!kpiField(
            data: null(),
            template: "ADJACENT",
            iconColor: "#FAA92F",
            iconStyle: "STAMP",
            icon: "walking",
            primaryText: "Total Visitors",
            trend: "PERCENTAGE",
            secondaryText: "vs 2023"
          ),

        },
        style: "#0F1C2E",
        shape: "ROUNDED",
        padding: "STANDARD",
        showBorder: false,
        showShadow: true()
      )
    ),
    a!columnLayout(
      contents: a!cardLayout(
        contents: {
          a!kpiField(
            data: null(),
            template: "ADJACENT",
            iconStyle: "STAMP",
            icon: "shopping-basket",
            iconColor: "#EB4183",
            primaryText: "Total Orders",
            trend: "NONE",

          ),

        },
        style: "#0F1C2E",
        shape: "ROUNDED",
        padding: "STANDARD",
        showBorder: false,
        showShadow: true()
      )
    )
  }
),
Multiple KPIs in a cardCopy link to clipboard
You can combine multiple KPIs in one card to group similar metrics in a visual container.

1
2
3
4
5
6
7
8
9
10
11
12
13
14
15
16
17
18
19
20
21
22
23
24
25
26
27
28
29
30
31
32
33
34
35
36
37
38
39
40
41
42
43
44
45
46
47
48
49
50
51
52
53
54
55
56
57
58
59
60
61
62
63
64
65
66
67
68
69
70
71
72
73
74
75
76
77
78
79
80
81
82
83
84
85
86
87
88
89
90
91
92
93
94
a!cardLayout(
  contents: {
    a!richTextDisplayField(
      labelPosition: "COLLAPSED",
      value: {
        a!richTextItem(
          text: "University Admissions",
          size: "MEDIUM",
          style: "STRONG"
        )
      },
      marginBelow: "NONE"
    ),
    a!richTextDisplayField(
      labelPosition: "COLLAPSED",
      value: {
        a!richTextItem(
          text: { "2024 ", "Fall Semester" },
          color: "SECONDARY",
          size: "SMALL",
          style: "PLAIN"
        )
      },
      marginAbove: "NONE",
      marginBelow: "STANDARD"
    ),
    a!columnsLayout(
      columns: {
        a!columnLayout(
          contents: {
            a!kpiField(
              /* Select a record type for the data parameter */
              data: null,
              primaryText: "Total Applications",

            ),

          }
        ),
        a!columnLayout(
          contents: {
            a!kpiField(
              /* Select a record type for the data parameter */
              data: null,
              primaryText: "Admitted",
              trend: "NONE",

            ),

          }
        ),
        a!columnLayout(
          contents: {
            a!kpiField(
              /* Select a record type for the data parameter */
              data: null,
              primaryText: "Accepted",
              trend: "NONE",

            ),

          }
        ),
        a!columnLayout(
          contents: {
            a!kpiField(
              /* Select a record type for the data parameter */
              data: null,
              primaryText: "Enrolled",
              trend: "NONE",

            ),

          }
        ),

      },
      alignVertical: "TOP",
      marginAbove: "EVEN_LESS",
      marginBelow: "STANDARD",
      spacing: "SPARSE",
      showDividers: true()
    )
  },
  height: "AUTO",
  style: "#ffffff",
  shape: "SEMI_ROUNDED",
  padding: "STANDARD",
  marginBelow: "STANDARD",
  showBorder: false(),
  showShadow: true(),
  decorativeBarPosition: "TOP",
  decorativeBarColor: "ACCENT"
)
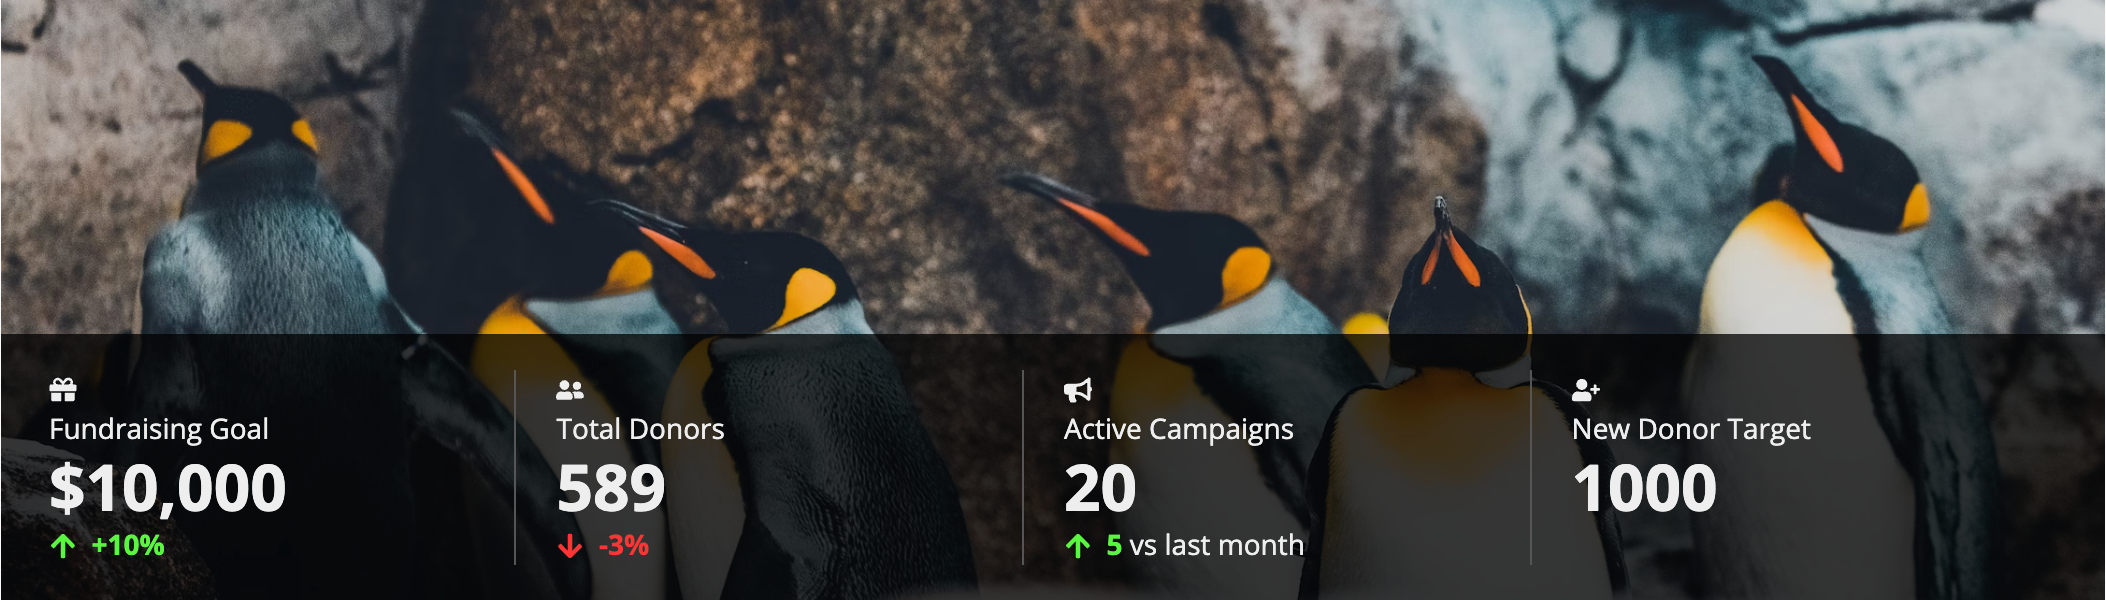
KPI overlayCopy link to clipboard
The billboard layout's overlay options provide a way to condense your display and visually connect the KPIs to the subject of the data.
For example, say you are building metrics for a wildlife foundation. You could place the KPIs inside a bar overlay to include all of the important data with a meaningful background image.
1
2
3
4
5
6
7
8
9
10
11
12
13
14
15
16
17
18
19
20
21
22
23
24
25
26
27
28
29
30
31
32
33
34
35
36
37
38
39
40
41
42
43
44
45
46
47
48
49
50
51
52
53
54
55
56
57
58
59
60
61
62
63
64
65
66
67
68
69
70
71
72
73
74
75
76
77
78
79
80
81
82
83
84
85
86
87
88
89
90
91
92
93
94
95
96
97
98
99
100
101
102
103
104
105
106
107
108
a!billboardLayout(
  backgroundMedia: a!webImage(
    source: "https://images.unsplash.com/photo-1574950333594-f3e9a9446d0f?ixid=MXwxMjA3fDB8MHxwaG90by1wYWdlfHx8fGVufDB8fHw%3D&ixlib=rb-1.2.1&auto=format&fit=crop&w=2250&q=80"
  ),
  height: "MEDIUM",
  marginBelow: "NONE",
  overlay: a!barOverlay(
    position: "BOTTOM",
    contents: {
      a!columnsLayout(
        columns: {
          a!columnLayout(
            contents: {
              a!columnsLayout(
                columns: {
                  a!columnLayout(
                    contents: {
                      a!kpiField(
                        /* Select a record type for the data parameter */
                        data: null,
                        template: "STACKED",
                        primaryText: "Gifts Dollars to target",
                        icon: "gift",
                        trend: "PERCENTAGE"
                      ),

                    }
                  ),
                  a!columnLayout(
                    contents: {
                      a!kpiField(
                        /* Select a record type for the data parameter */
                        data: null,
                        template: "STACKED",
                        primaryText: "Total Donors",
                        icon: "user-friends",
                        trend: "PERCENTAGE"
                      ),

                    }
                  ),
                  a!columnLayout(
                    contents: {
                      a!kpiField(
                        /* Select a record type for the data parameter */
                        data: null,
                        template: "STACKED",
                        primaryText: "Active Campaigns",
                        icon: "bullhorn",
                        trend: "DIFFERENCE",
                        secondaryText: "vs last month"
                      ),

                    }
                  ),
                  a!columnLayout(
                    contents: {
                      a!kpiField(
                        /* Select a record type for the data parameter */
                        data: null,
                        template: "STACKED",
                        primaryText: "New Donors to target",
                        icon: "user-plus",
                        trend: "NONE",

                      ),

                    }
                  )
                },
                spacing: "SPARSE",
                stackWhen: {
                  "PHONE",
                  "TABLET_PORTRAIT",
                  "TABLET_LANDSCAPE"
                },
                showDividers: true
              )
            },
            width: "WIDE_PLUS"
          ),
          a!columnLayout(
            contents: {},
            width: "AUTO",
            showWhen: not(
              a!isPageWidth(
                {
                  "DESKTOP_NARROW",
                  "TABLET_LANDSCAPE",
                  "TABLET_PORTRAIT",
                  "PHONE"
                }
              )
            )
          )
        },
        alignVertical: "MIDDLE",
        spacing: "DENSE",
        stackWhen: {
          "PHONE",
          "TABLET_PORTRAIT",
          "TABLET_LANDSCAPE",
          "DESKTOP_NARROW"
        }
      )
    }
  )
)
