| The capabilities described on this page are included in Appian's standard capability tier. Usage limits may apply. |
Appian RPA offers visualizations of data from multiple points with a dashboard as well as detailed charts and reports. Access real-time insights into executions and queue outcomes directly within the Operations Console and the Appian RPA console.
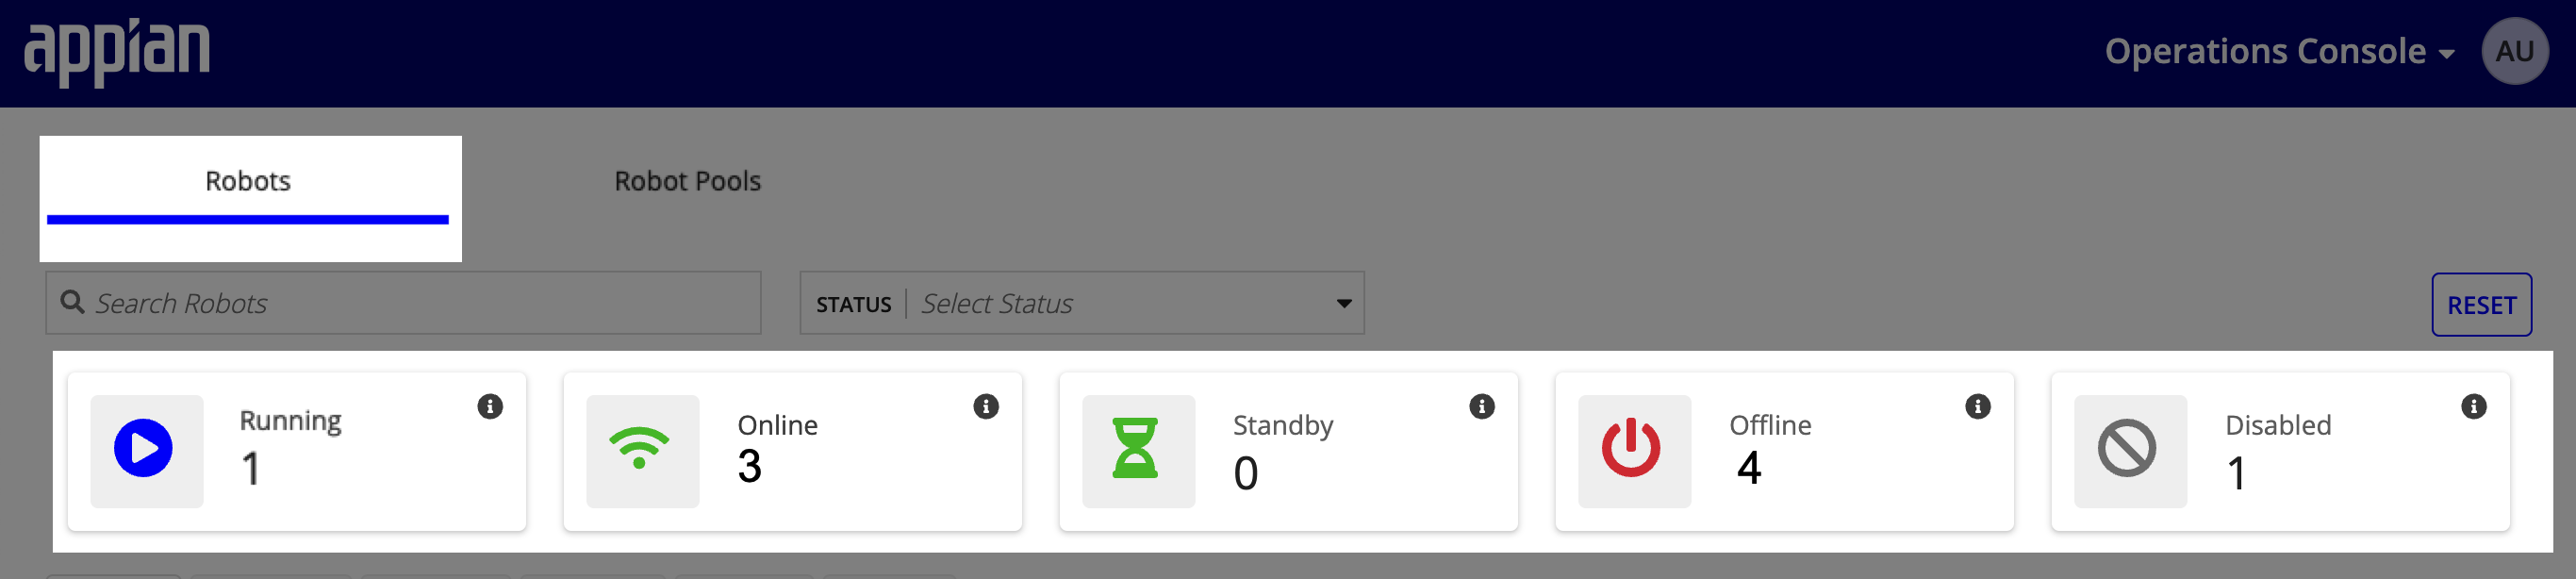
The Robots screen in the Operations Console provides a real-time overview of your robots' statuses. Here's what each section indicates:
You can search for specific robots using the search bar, filter by status using the dropdown menu, or reset any filters applied by clicking the RESET button.

Most commonly, you'll find the Charts icon in the toolbar when viewing details for a specific robotic task from the Robotic tasks tab.

The charts on this page summarize information for all executions for that robotic task: Total items processed, including the number of executions, count of items with OK and Warnings as the result, and the average Execution time.

You'll also find the Charts icon in the toolbar on the Dashboard. These charts show accumulated data for Processed work items, Accumulated execution time, and Execution hours, for all robotic tasks.

On the Download reports page under the Schedule tab, you can access reports that were generated inside the console. This page includes information on who requested the report, the task related to the report, how long it took to generate the report and when it started, and when the report expires.
When a report is in progress, it appears in the list but without an End or Duration. A report is available for download when all fields are filled:
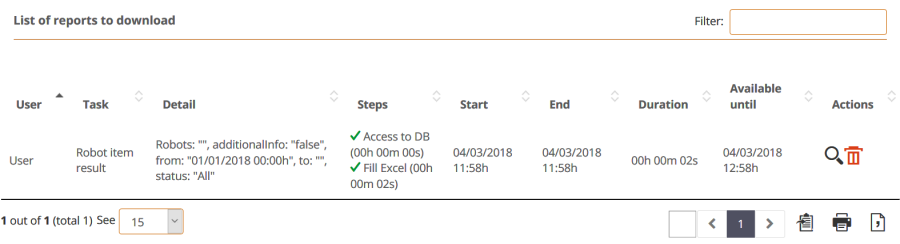
In the Actions column, click Result  to download the report or Remove
  to delete the report.
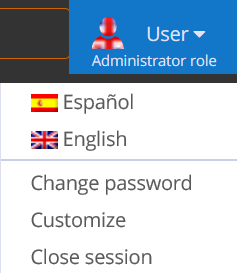
You can choose the availability of reports in the Customize menu of the User Settings menu.
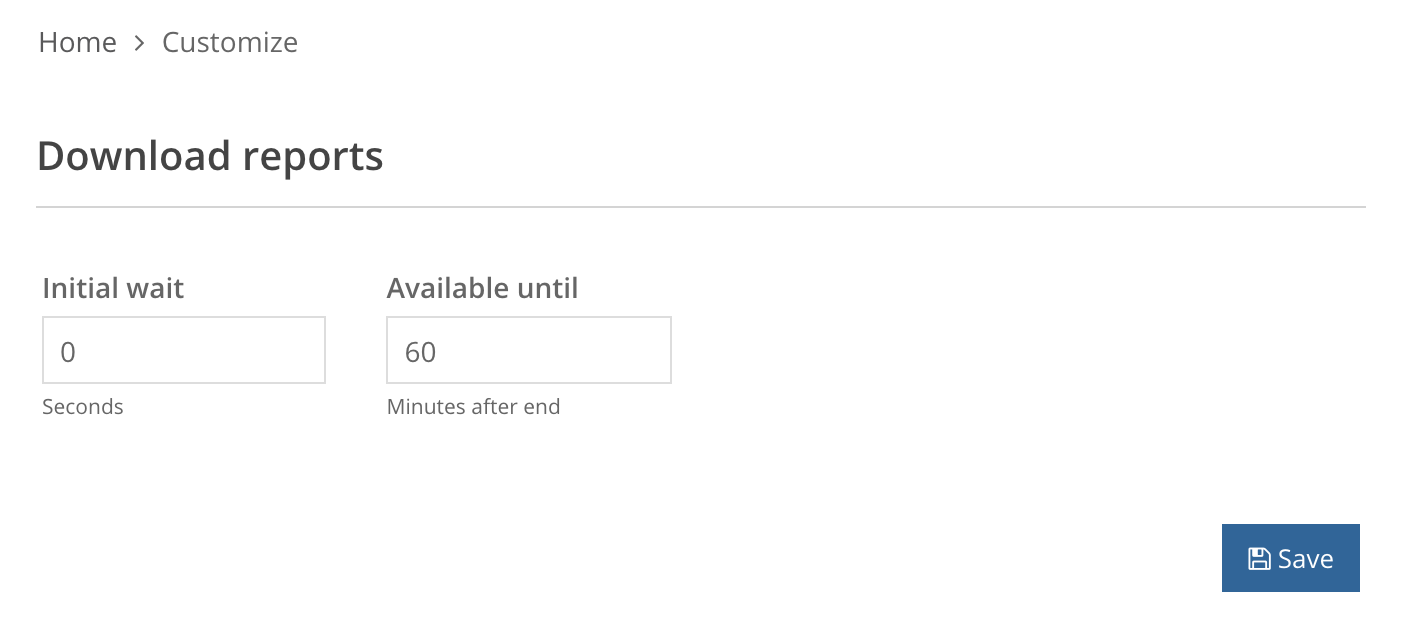
In Customize > Download report, you can determine:
Monitor Performance
