Tip: Interface patterns give you an opportunity to explore different interface designs. Be sure to check out How to Adapt a Pattern for Your Application.
GoalCopy link to clipboard
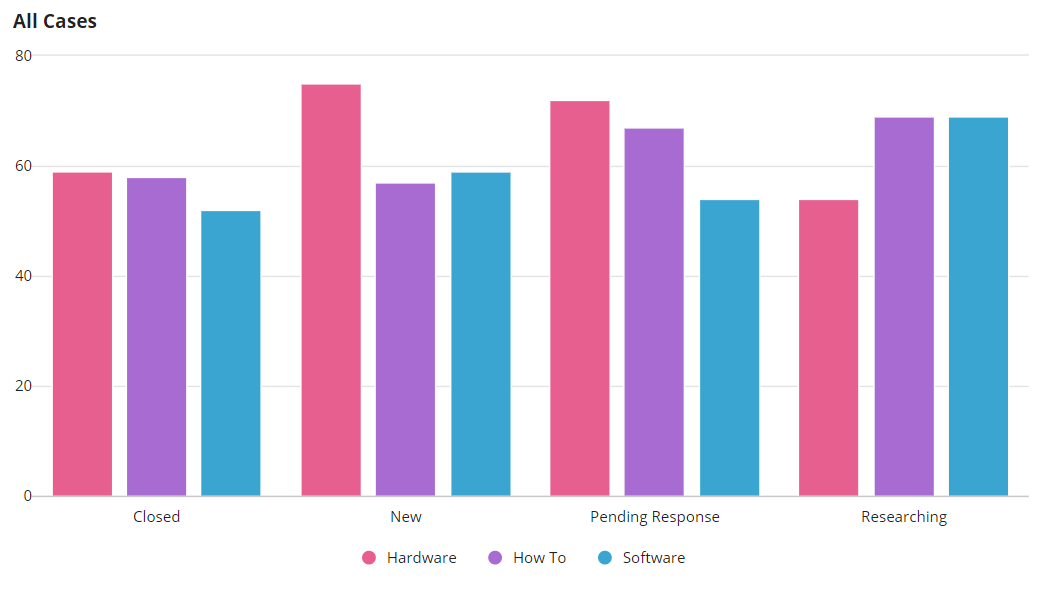
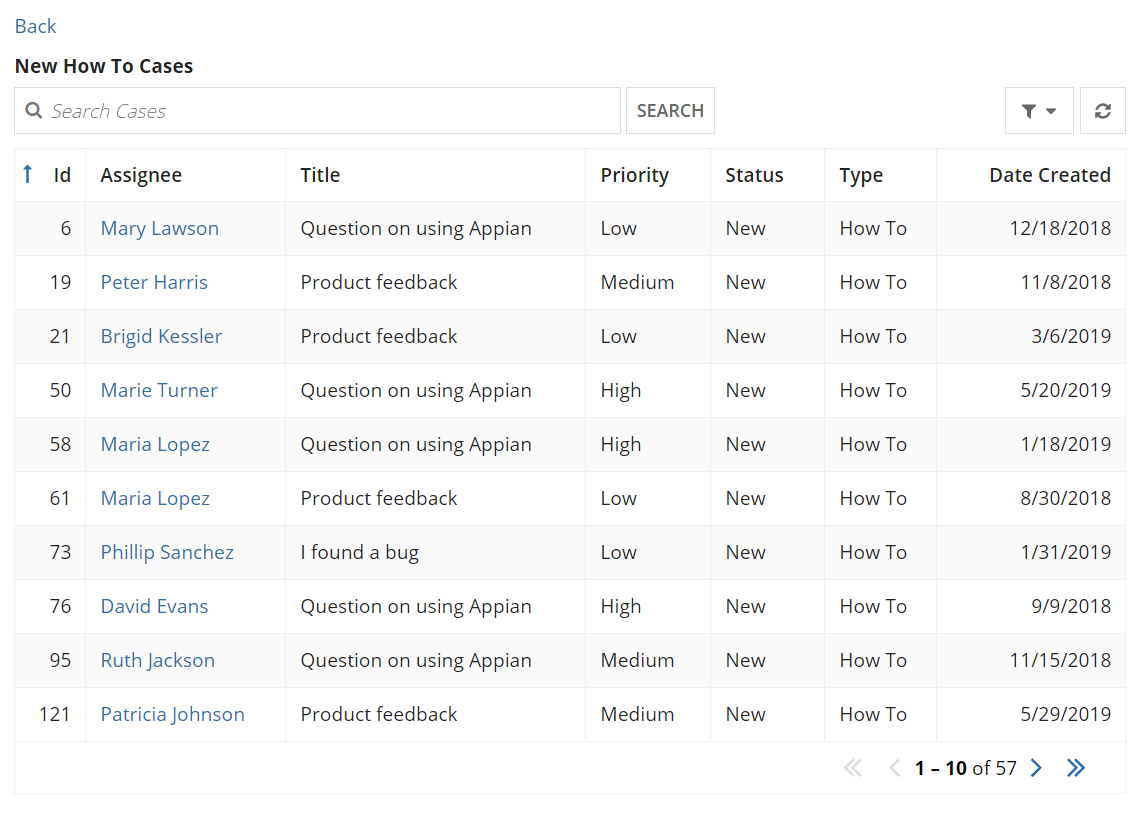
Displays a column chart with aggregate data from a record type and conditionally shows a grid with filtered records when a user selects a column on the chart.
This design pattern is not recommended for offline interfaces because reflecting immediate changes in an interface based on user interaction requires a connection to the server.
This scenario demonstrates:
- How to create a grid and chart using a record type as the source.
- How to save a selection from the chart and filter the grid.
You can click on the chart to drill down and view more details in a grid. This pattern is related to the grid with detail pattern.

When a column in the chart is selected, a grid displays with the results for the selected column:

Create this patternCopy link to clipboard
The main components in this pattern is a chart and read-only grid that are alternately visible. In the pattern below, the chart and grid use a record type as the data source.
This recipe uses references to record types and record fields. To use this recipe, you will need to update the references to record types and record fields in your application.
1
2
3
4
5
6
7
8
9
10
11
12
13
14
15
16
17
18
19
20
21
22
23
24
25
26
27
28
29
30
31
32
33
34
35
36
37
38
39
40
41
42
43
44
45
46
47
48
49
50
51
52
53
54
55
56
57
58
59
60
61
62
63
64
65
66
67
68
69
70
71
72
73
74
75
76
77
78
79
80
81
82
83
84
85
86
87
88
89
90
91
92
93
94
95
96
97
98
99
100
101
102
103
104
105
106
107
108
109
110
111
112
113
114
115
116
117
118
119
120
121
122
123
124
125
126
127
128
129
130
131
132
a!localVariables(
  local!selection,
  a!sectionLayout(
    contents: {
      a!columnChartField(
        label: "All Cases",
        data: a!recordData(
          recordType: recordType!Case,
          filters: a!queryLogicalExpression(
            operator: "AND",
            filters: {
              a!queryFilter(
                field: recordType!Case.fields.type,
                operator: "not in",
                value: {"Other"}
              )
            },
            ignoreFiltersWithEmptyValues: true
          )
        ),
        config: a!columnChartConfig(
          primaryGrouping: a!grouping(
            field: recordType!Case.fields.status,
            alias: "status"
          ),
          secondaryGrouping: a!grouping(
            field: recordType!Case.fields.type,
            alias: "type"
          ),
          measures: {
            a!measure(
              function: "COUNT",
              field: recordType!Case.fields.id,
              alias: "id_count"
            )
          },
          dataLimit: 100,
          link: a!dynamicLink(
            value: fv!selection,
            saveInto: local!selection
          )
        ),
        stacking: "NONE",
        colorScheme: "PARACHUTE",
        showWhen: isnull(local!selection)
      ),
      a!linkField(
        labelPosition: "COLLAPSED",
        links: a!dynamicLink(
          label: "Back",
          saveInto: a!save(
            target: local!selection,
            value: null
          )
        ),
        showWhen: not(isnull(local!selection))
      ),
      a!gridField(
        label: local!selection.status & " " &local!selection.type & " Cases",
        labelPosition: "ABOVE",
        data: a!recordData(
          recordType:recordType!Case,
          filters: a!queryLogicalExpression(
            operator: "AND",
            filters: {
              a!queryFilter(
                field: recordType!Case.fields.type,
                operator: "=",
                value: local!selection.type
              ),
              a!queryFilter(
                field: recordType!Case.fields.status,
                operator: "=",
                value: local!selection.status
              )
            },
            ignorefilterswithemptyvalues: true
          )
        ),
        columns: {
          a!gridColumn(
            label: "Id",
            sortField: recordType!Case.fields.id,
            value: fv!row[recordType!Case.fields.id],
            align: "END"
          ),
          a!gridColumn(
            label: "Assignee",
            sortField: recordType!Case.fields.assignee,
            value: a!linkField(
              links: {
                a!recordLink(
                  label: fv!row[recordType!Case.fields.assignee],
                  recordType: recordType!Case,
                  identifier: fv!identifier
                )
              }
            )
          ),
          a!gridColumn(
            label: "Title",
            sortField: recordType!Case.fields.title,
            value: fv!row[recordType!Case.fields.title]
          ),
          a!gridColumn(
            label: "Priority",
            sortField: recordType!Case.fields.priority,
            value: fv!row[recordType!Case.fields.priority]
          ),
          a!gridColumn(
            label: "Status",
            sortField: recordType!Case.fields.status,
            value: fv!row[recordType!Case.fields.status]
          ),
          a!gridColumn(
            label: "Type",
            sortField: recordType!Case.fields.type,
            value: fv!row[recordType!Case.fields.type]
          ),
          a!gridColumn(
            label: "Date Created",
            sortField: recordType!Case.fields.dateCreated,
            value: fv!row[recordType!Case.fields.dateCreated],
            align: "END"
          ),
        },
        showWhen: not(isnull(local!selection))
      )

    }
  )
)
Copy
Test it outCopy link to clipboard
- Click a bar on the chart. The chart will be replaced with a grid that displays all cases for that type and status.
- Click the "Back to Chart" link. The grid will be replaced with the original chart.
