| The capabilities described on this page are included in Appian's standard capability tier. Usage limits may apply. |
More experienced Java developers may prefer to use remote debugging when testing and refining a robotic task in development.
Remote debugging means that the robotic task runs on a different machine than the one being used by the developer. In Appian RPA, that machine is usually the host machine.
This section discusses how to enable and use remote debugging.
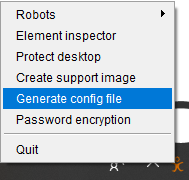
First, configure the host machine.
In the agent menu, select the option Generate configuration file.
In Debug Settings, select Enable debug. This generates a file that includes the required configuration to accept debug connections through the port 13000. Be aware that the port must be accessible from the development machine (where our IDE is) to the host machine.
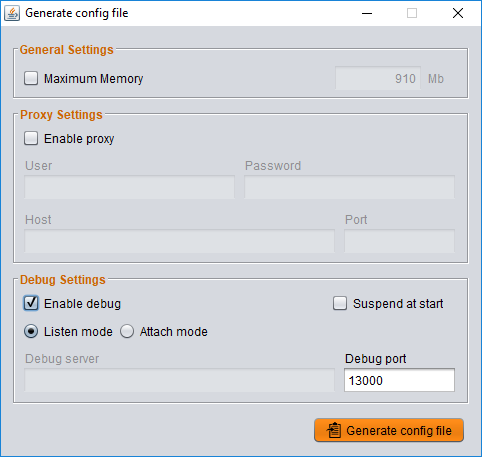
The agent may be already configured to accept an incoming connection for debugging through port 13000. However, this option is disabled by default, so you'll need to enable it if it hasn't been enabled previously.
If debugging isn't enabled yet, enable remote debugging through the agent configuration file. This file, usually called jidoka.l4j.ini, is optional and adds specific configuration to the host machine JVM. In this file, we must add the following line to enable remote debugging:
1
-Xdebug -Xrunjdwp:transport=dt_socket,server=y,suspend=n,address=[PORT]
Replace [PORT] with the port where debugging will be enabled. This port must be available and be capable of receive incoming connections for debugging.
Next, configure Eclipse.
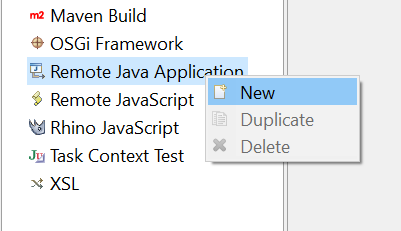
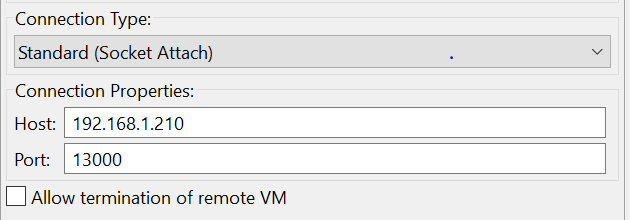
To be able to remotely debug a robot, we must add a remote Java machine within the debugging settings.
Right click on Remote Java Application and select New.
13000, if using the standard port mentioned above.Click Debug to connect to the host machine and begin debugging.
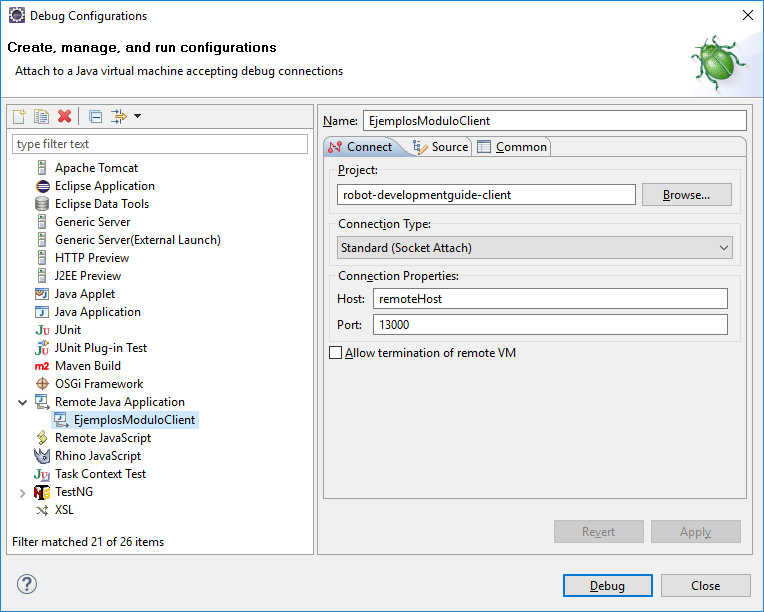
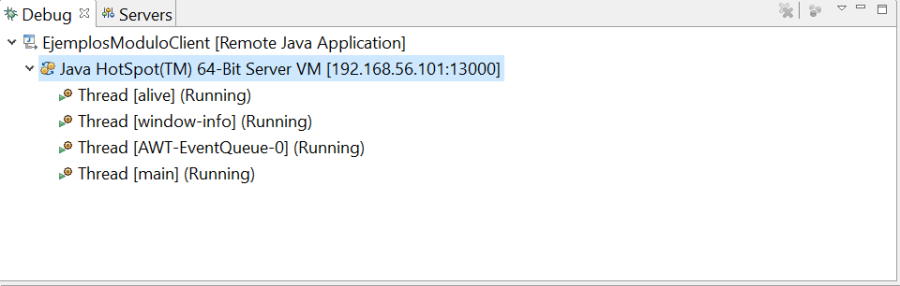
With the connection established and the robotic task execution started, you're ready to set the necessary breakpoints for the debugging. Eclipse shows the threads that are running on the remote machine. You don't need to click Debug each time we want to debug a robot. Once connected, you can debug each robot execution until the connection is closed.
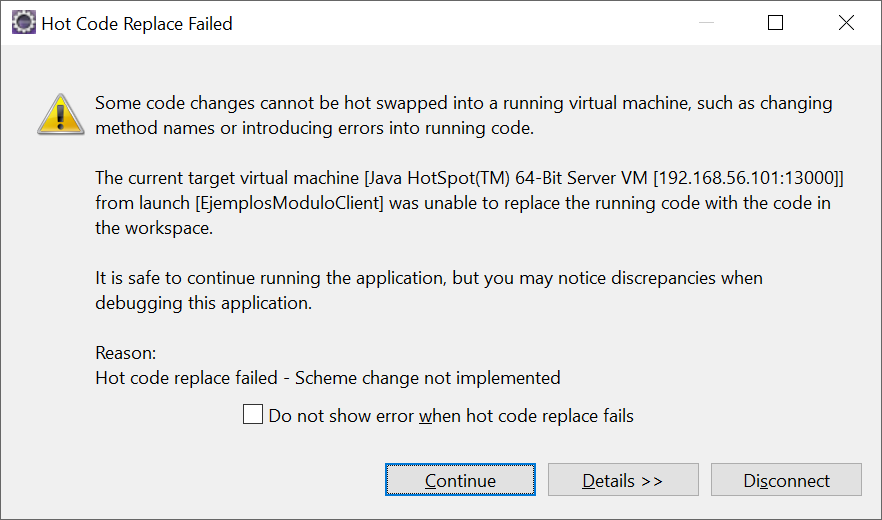
It's common to make changes in the source code during debugging. For this reason, be aware that if you change the code, it is no longer synchronized with the deployed robotic task's code. Although you don't need to reconnect with the remote machine, you'll need to redeploy the robot directly to synchronize your changes. Every time you change your code and save it, Eclipse will show you a warning message reminding you of these discrepancies.
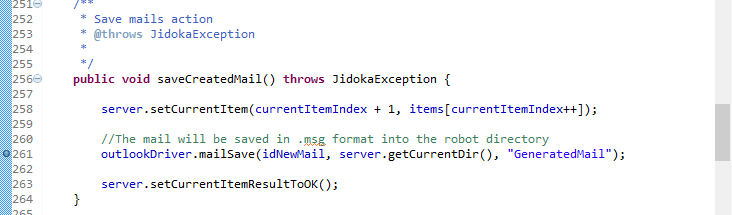
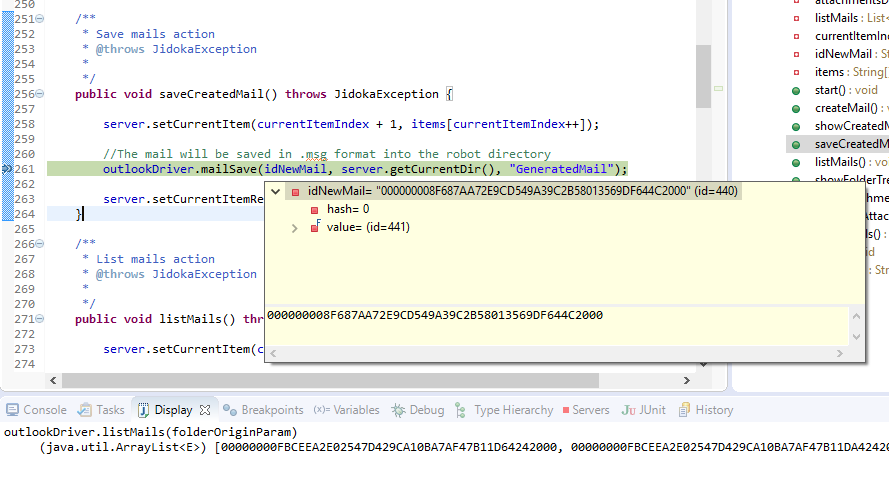
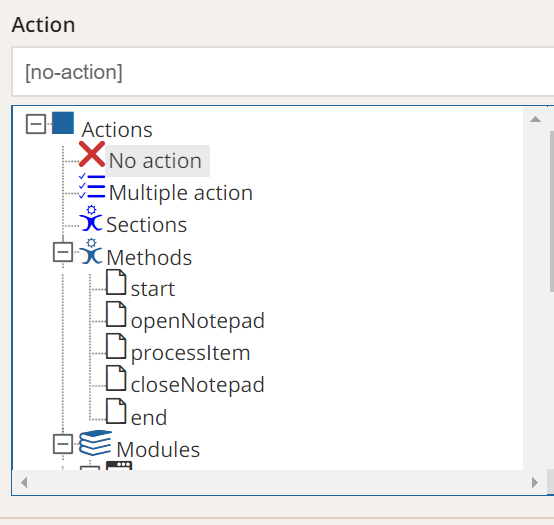
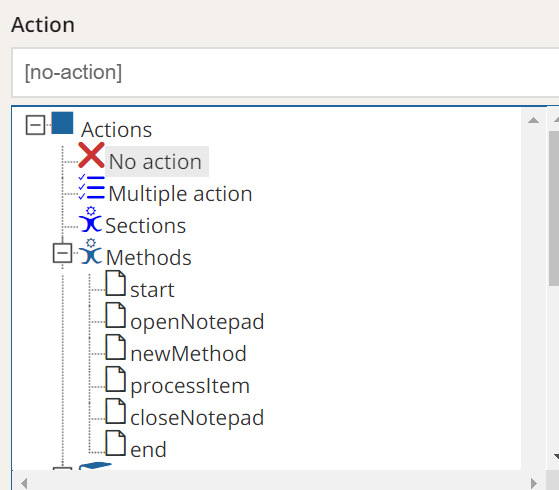
A key element of debugging is to establish breakpoints to stop the execution at certain steps.
In the image below, we can see the breakpoints already established.
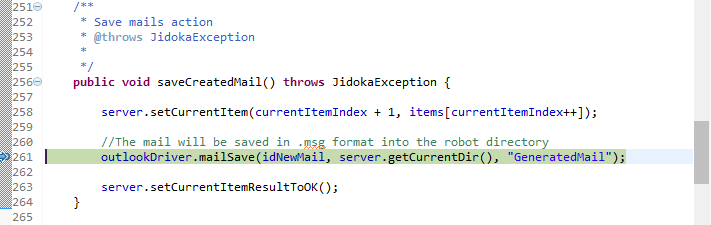
You can launch the robot and wait for the execution to stop, so that you can debug step by step.
From this point on, you can use the usual commands for debugging. From the Display view, you can write and run any set of lines of code.
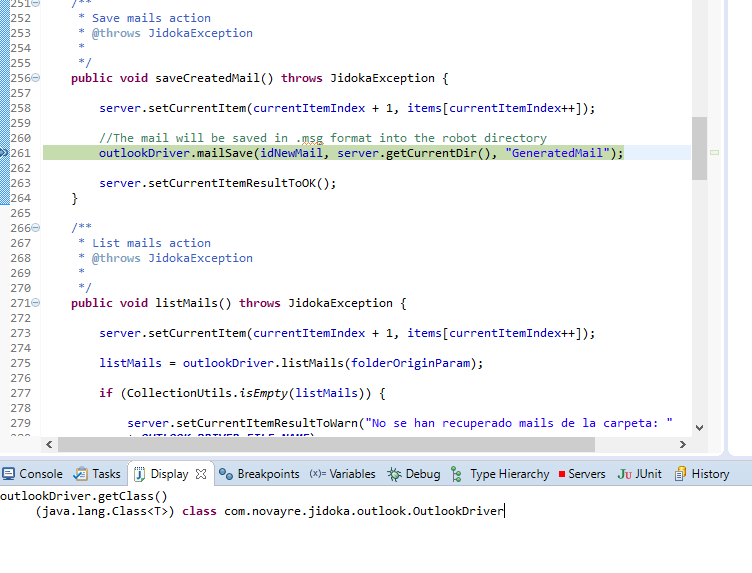
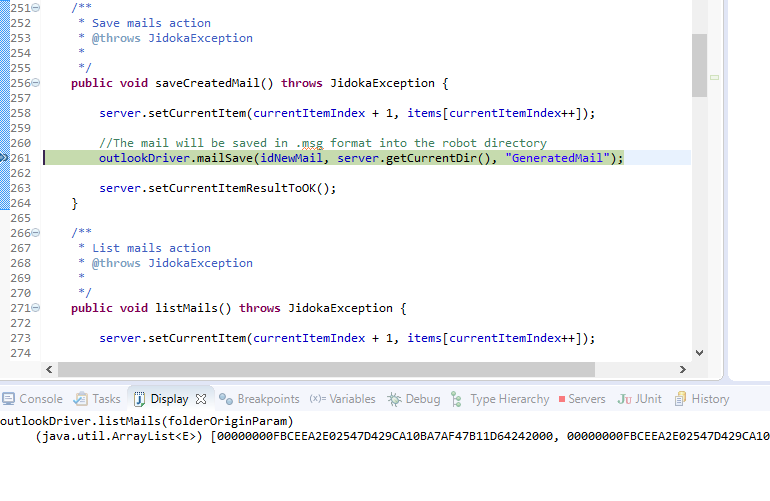
To run code from the Display window, write the code, select it, and press the keys Ctrl + Shift + D. You can also right-click and click Display in the menu. You can also select Inspect, but this option shows the result on a pop-up window, rather than on the display view.
Refer to the Eclipse documentation for more information about debugging.
If you set up a Windows environment variable named APPIAN_RPA_JAVA_HOME and point it to your chosen Java installation, the agent will start using that Java setup automatically. Ensure everything is set up correctly.
If the robot icon is not displayed in red, this means that it is not connected to the server.
Check if your organization has activated a firewall on this machine to prevent access to the console URL.
Check if your organization is using a proxy for internet access. If this is the case, you must include the proxy settings in the jidoka.l4j.ini file. This file must be created in the same directory where the AppianRPAagent.exe file was installed. Request the proxy settings to your network administrator, and set the values in the file as shown.
1
2
3
4
5
6
7
8
-Dhttp.proxyUser=USER
-Dhttp.proxyPassword=PASSWORD (password could be encrypted using the Appian RPA robot)
-Dhttp.proxyHost=PROXY_ADDRESS
-Dhttp.proxyPort=8080
-Dhttps.proxyUser=USER
-Dhttps.proxyPassword=PASSWORD (password could be encrypted using the Appian RPA robot)
-Dhttps.proxyHost=PROXY_ADDRESS
-Dhttps.proxyPort=8080
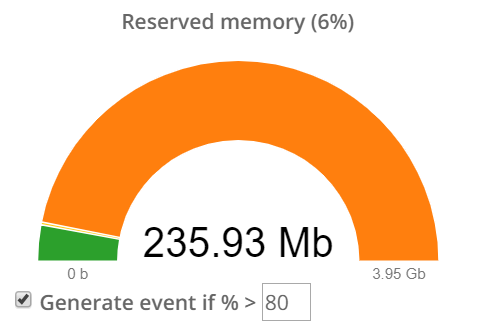
This error is due to insufficient assigned memory for the host machine executing in the computer. In general, the host machine does not require too much memory, but the use of the IExcel module or high number of images in the Falcon module requires a necessary memory expansion assigned to the task.
To solve these errors, do the following:
Increase the RAM available for the Java task:
To expand the available RAM for the Java task, it's necessary to configure the maximum available memory by adding the Java standard parameters -Xms and -Xmx in the jidoka.l4j.ini file. -Xms sets the initial memory and -Xmx sets the value for maximum memory. Use the maximum RAM the system allows without affecting applications used by robotic tasks. For example, this could be -Xms512m -Xmx2048m.
Relaunch the robot's agent:
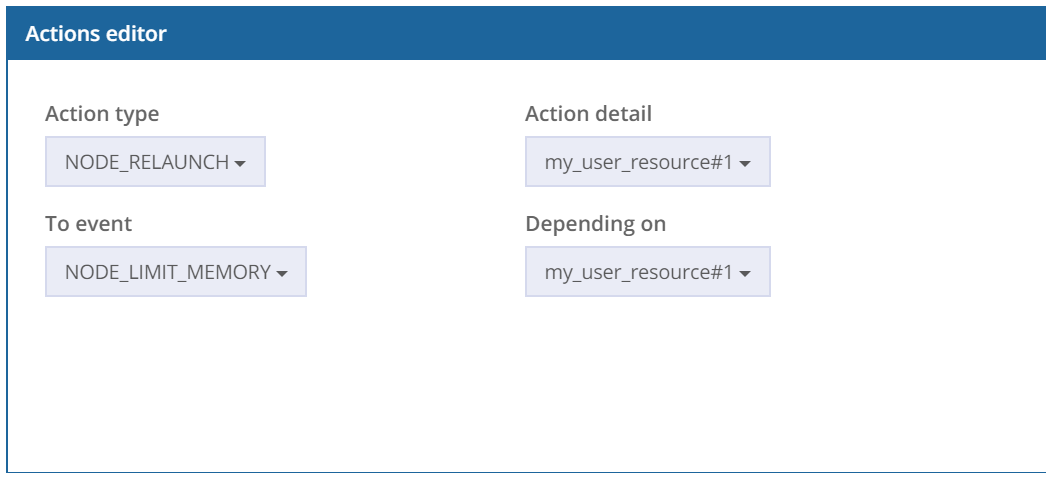
The garbage collector in Java allows you to free up the used memory after each execution. But due to the design of Java, sometimes it is not completely released and the available memory decreases in each execution. To avoid this problem, you can configure in the console to restart the host machine when it reaches a certain threshold of used memory (our recommendation is 80%). To do this, you have to define the event in the robot configuration, and define a NODE_RELAUNCH action.
This error occurs when you are trying to reserve more memory for Java than the OS allows. We recommend that you check your computer's RAM to set the appropriate -Xmx value.
Note that a 32-bit Java Virtual Machine cannot handle too much memory, even if the computer's capacity is properly sized.
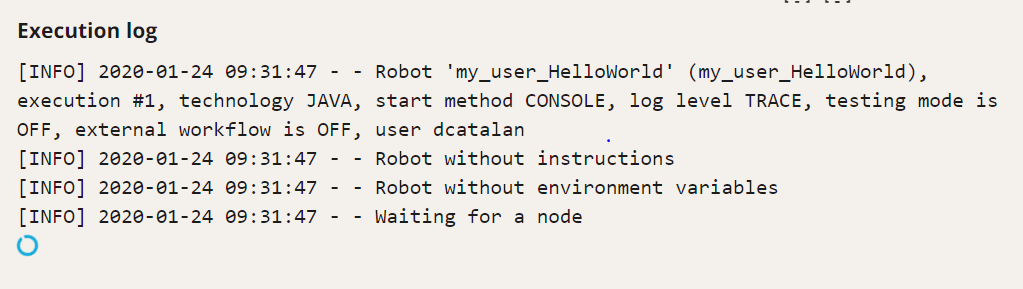
You have executed "my-first-robot" but the robotic task is queued up and still waiting for a robot.
If this is the case, perform the following checks:
Once these checks have been made, relaunch the robotic task.
Be sure to add the host machines to your Appian environment's firewall allow list, if applicable. The robotic task may not be able to execute successfully if the firewall blocks communication between the agent, host machine, and server.
If the following error occurs when importing or compiling your first robotic task:
Project build error: Non-resolvable parent POM for com.novayre.jidoka.robot.test:hello-world:0.0.1: Failure to transfer com.novayre.jidoka.robot:jidoka-robot-parent:pom:x.y.z from https://myrepository.appiancloud.com/rpa/repo was cached in the local repository, resolution will not be reattempted until the update interval of jidoka has elapsed or updates are forced.
You should check the following:
Verify that your robotic task's pom.xml file is referencing the correct URL with a server ID that matches the definition found in your settings.xml.
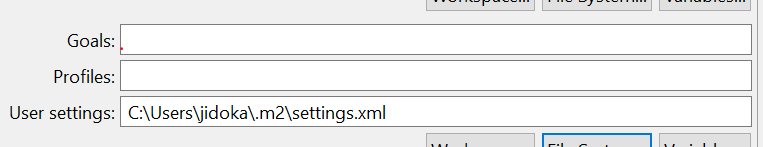
Check that your settings.xml file is stored in your user directory: C:/Users/<username>/.m2/settings.xml.
For example, when you configure a new Maven build in Eclipse, the system suggests a path for the file setting.xml. Check that your file is stored in this path.

Your settings.xml file must contain an entry for your repository id.
In your pom.xml file, you should define your Maven repository URL with an id (<id>jidoka</id>). The credentials for this id must be defined in your settings.xml file using your Appian username and Maven API key. For example:
1
2
3
4
5
6
7
  <servers>
   <server>
    <id>jidoka</id>
     <username>appian_username</username>
     <password>maven_API_key</password>
   </server>
  </servers>
You can find your Maven API key from the Appian RPA Console. Click Settings > Refresh Maven Key and copy the value. Note that this is the only time you'll be able to view and copy this specific key.
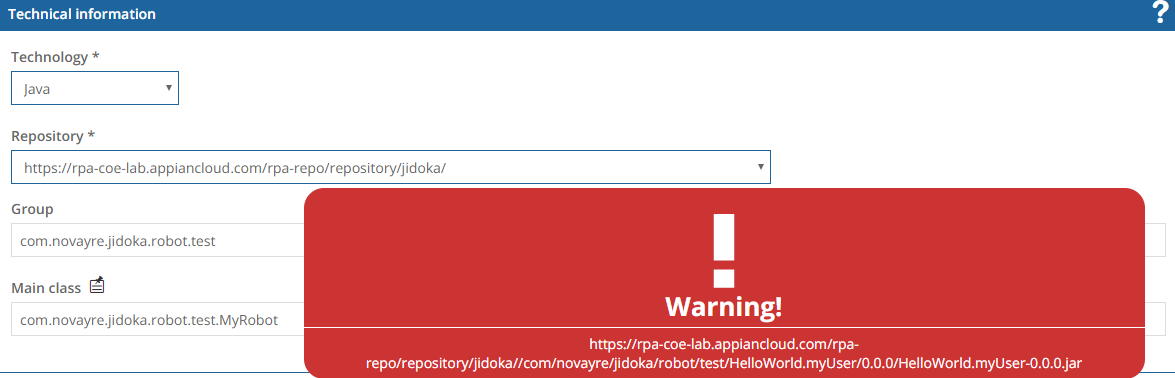
If the following error occurs when importing or compiling your first robotic task:
[FATAL] Non-resolvable parent POM for com.novayre.jidoka.robot.test:my_user_HelloWorld:0.0.1: Could not transfer artifact com novayre.jidoka.robot:jidoka-robot-parent:pom:x.y.z from/to jidoka (https://myrepository.jidoka.io/rpa-repo/repository/jidoka/ : Access denied to https://myrepository.jidoka.io/rpa-repo/repository/jidoka/com/novayre/jidoka/robot/jidoka-robot-parent/x.y x/jidoka-robot-parent-x.y.z.pom. Error code 401, Unauthorized and 'parent.relativePath' points at wrong local POM @ line 10 column 10
Check the following:
You're probably using the wrong API key. It should be the same you used to set up the development environment with the Configurator. That is, the one that is in your settings.xml file (go to your pc at USER_HOME/.m2/settings.xml to find it).
1
2
3
4
5
6
7
  <servers>
   <server>
    <id>jidoka</id>
     <username>appian_username</username>
     <password>maven_API_key</password>
   </server>
  </servers>
You can refresh your API key in the Appian RPA Console. Click Settings > Refresh Maven Key and copy the value.
If you don't see your main class in the Appian RPA Console, you should check the configuration following the steps detailed in the previous section.
First, verify your connection to the Maven repository. Go to the settings.xml file and confirm your username and API key are correct.
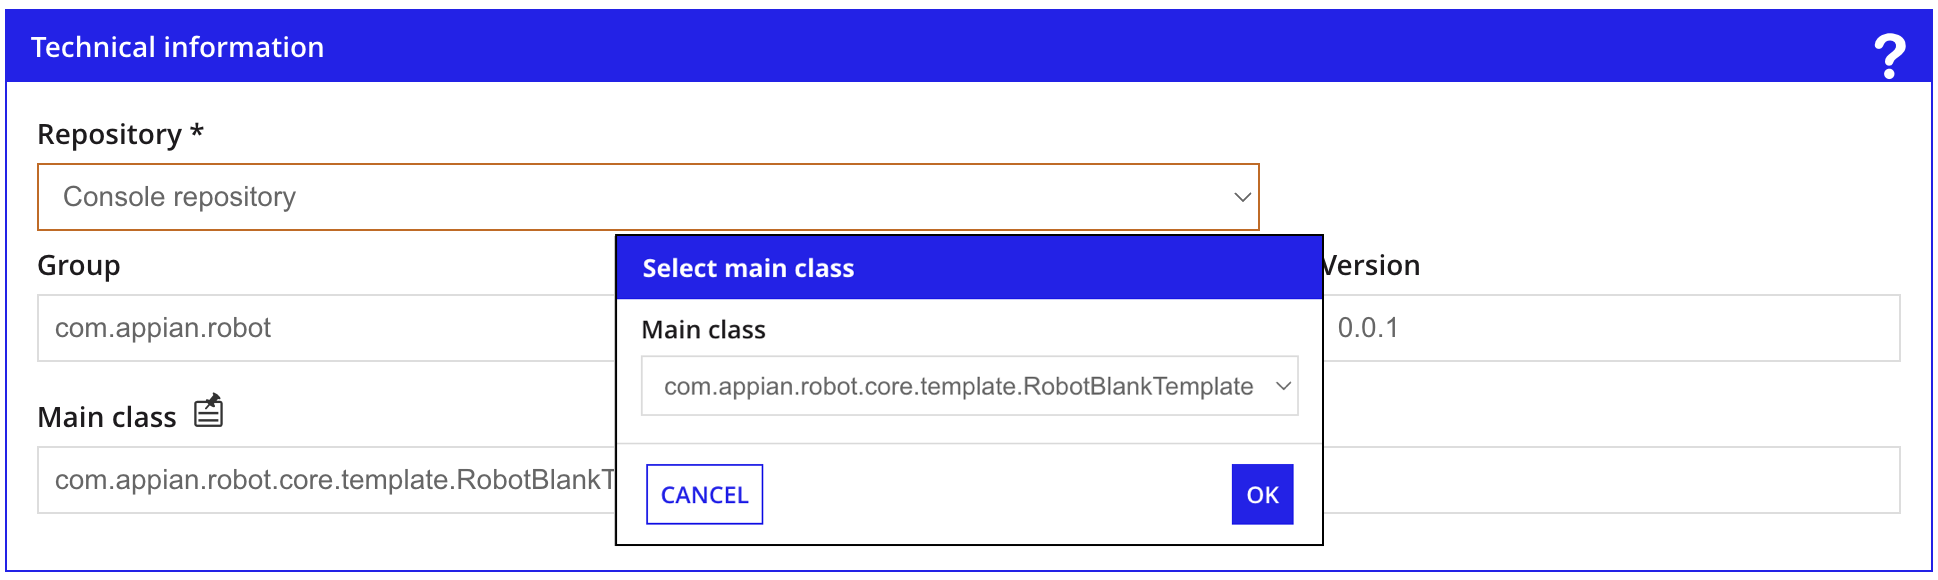
Second, check the Group, Robotic Task, and Version to ensure that they are the same in the console as in pom.xml. For example:
1
2
3
4
<groupId>com.appian.robot</groupId>
<artifactId>HelloWorld.myUser</artifactId>
<packaging>jar</packaging>
<version>0.0.1</version>
You have created a new method in your IDE:
1
2
3
public void newMethod() {
    server.info("This is a new method");
}
However, after compiling and deploying, you don't see it in the console.
Maybe you haven't correctly linked your code with the technical data in the console.
You must check the robotic task configuration as in the previous section.
To be sure, change the version or the artifact in your pom.xml, and redeploy. For example:
1
2
3
4
<groupId>com.appian.robot.test</groupId>
<artifactId>my_user_HelloWorld</artifactId>
<packaging>jar</packaging>
<version>0.0.2</version>
Change the Technical Information in your console. And you will see the new version:
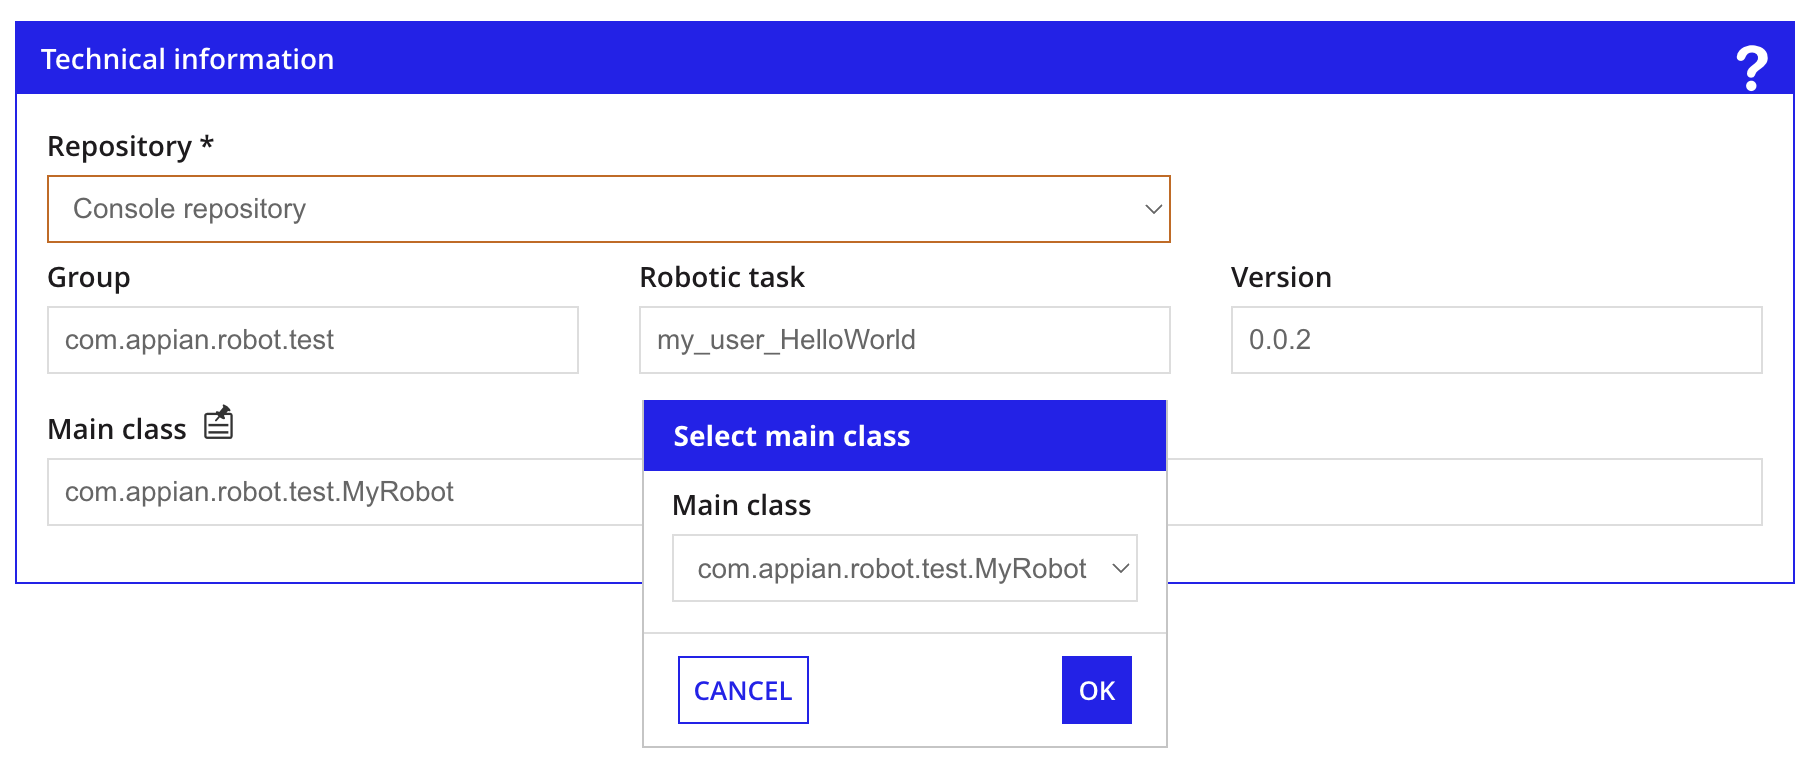
Check if you are able to see the new method.
Note that it is not necessary to change the version number in each deployment. This suggestion is intended to ensure that your robotic task is correctly linked to your source code.
You have to make sure that the file doesn't have the .txt extension, which is sometimes added when editing the file.
Review the file content. You should have this line:
-Xdebug -Xrunjdwp:transport=dt_socket,address=13000,server=y,suspend=n
Make sure that the host machine is started and connected to the server. If the jidoka.l4j.ini file does not have the right format, it will not start.
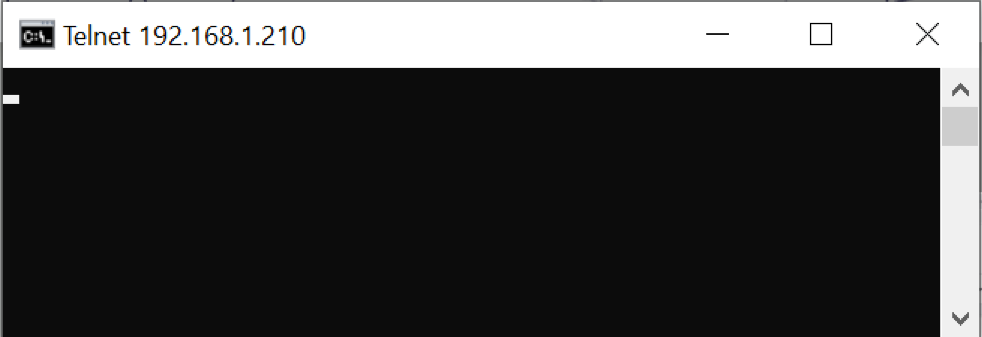
If your robot is running on another machine, check that you can connect to the remote port. For example:
In the command prompt, test the telnet command to the attached port. If it is not working, you don't have visibility to the host machine debug port. Check the firewall options or try to choose with a smaller number, sometimes the port 13000 is not available.
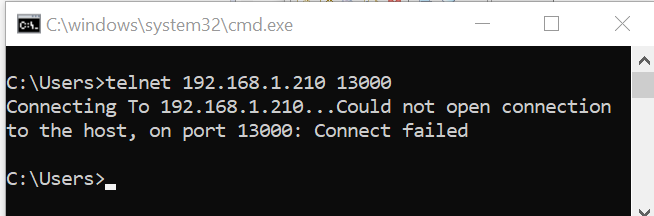
If you have a connection you'll see the following:
Testing a robotic task is an important step before deploying it to production environments. You want to make sure that the robotic task executes properly and is set up to handle changes or unexpected situations.
This page outlines some ways to test your robotic task and solve common problems during the bug fixing process.
When you're ready to test, the first step is to execute a robotic task using the method that fits your use case. Developers usually execute the task manually.
