| Process Mining is deprecated with Appian 24.2 and will no longer be available in an upcoming release. Instead, we encourage customers to use Process HQ to explore and analyze business processes and data. |
Dashboards are useful ways to present process data visually. Dashboards contain a number of charts and graphs that help communicate about key metrics within a given log. Process Mining lets you create, manage, and share dashboards to track and communicate this information within your organization.
This page describes how to create, use, manage, and share dashboards in Process Mining.
Find your dashboards in the Dashboard page of Process Mining. You'll have access to dashboards you created or dashboards that have been shared with you.
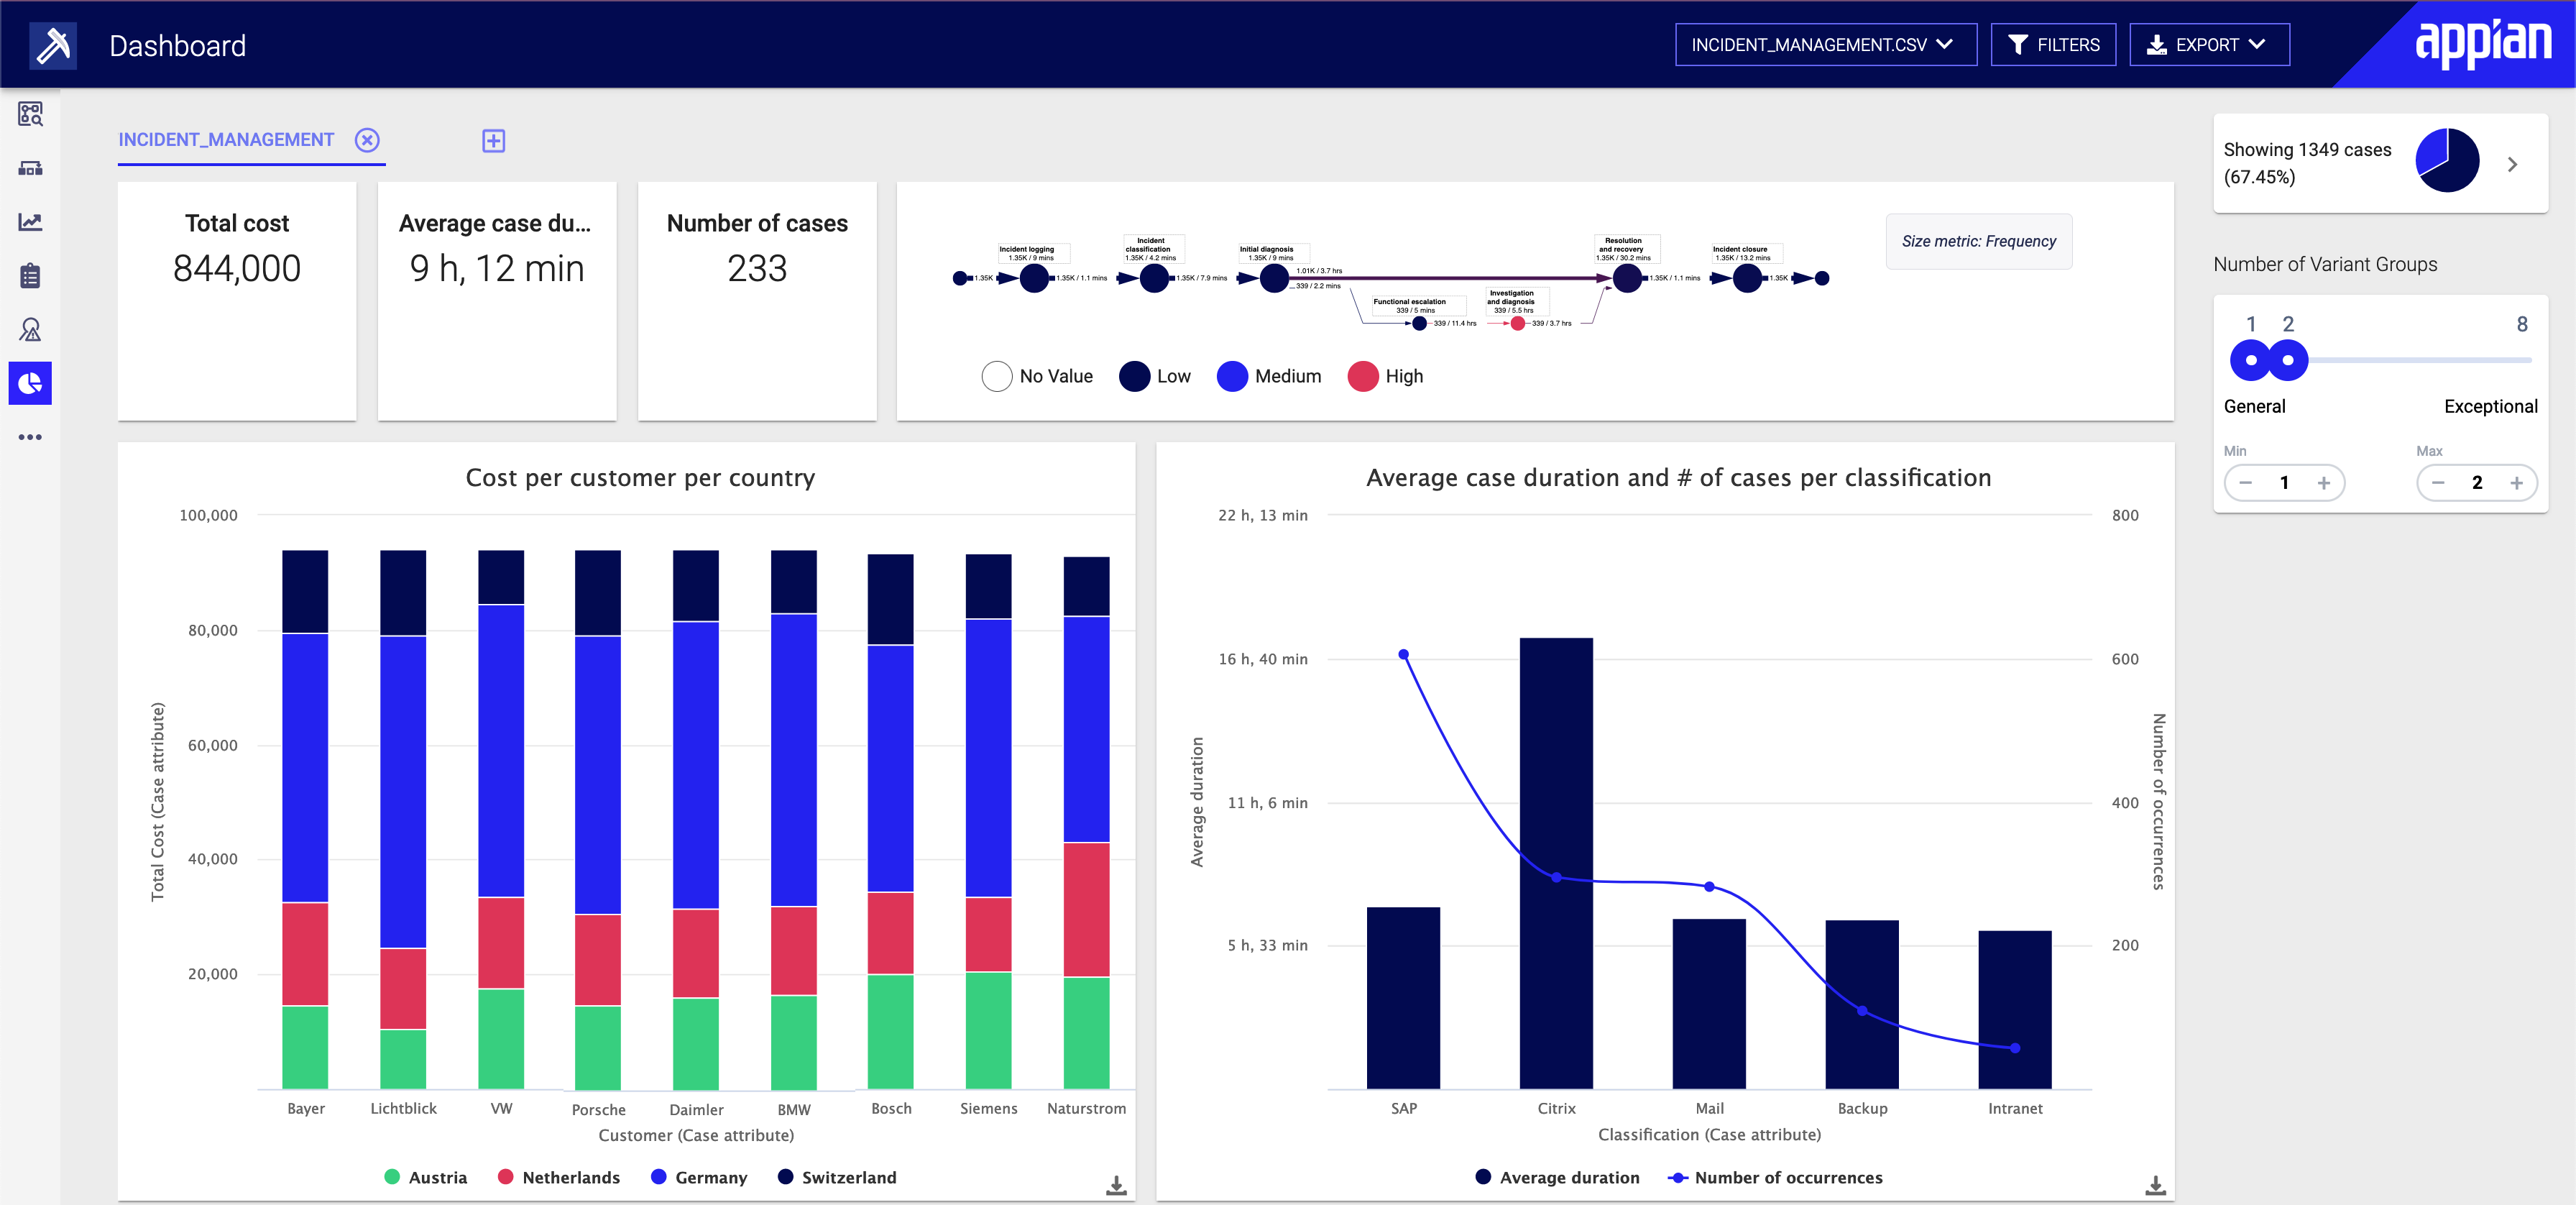

An empty dashboard automatically appears for the log you have selected. You can add charts and additional tabs to the dashboard to interpret the data.
Tip: The log you selected determines the attributes that appear in the charts. The options that appear in the chart configurations may differ between logs.
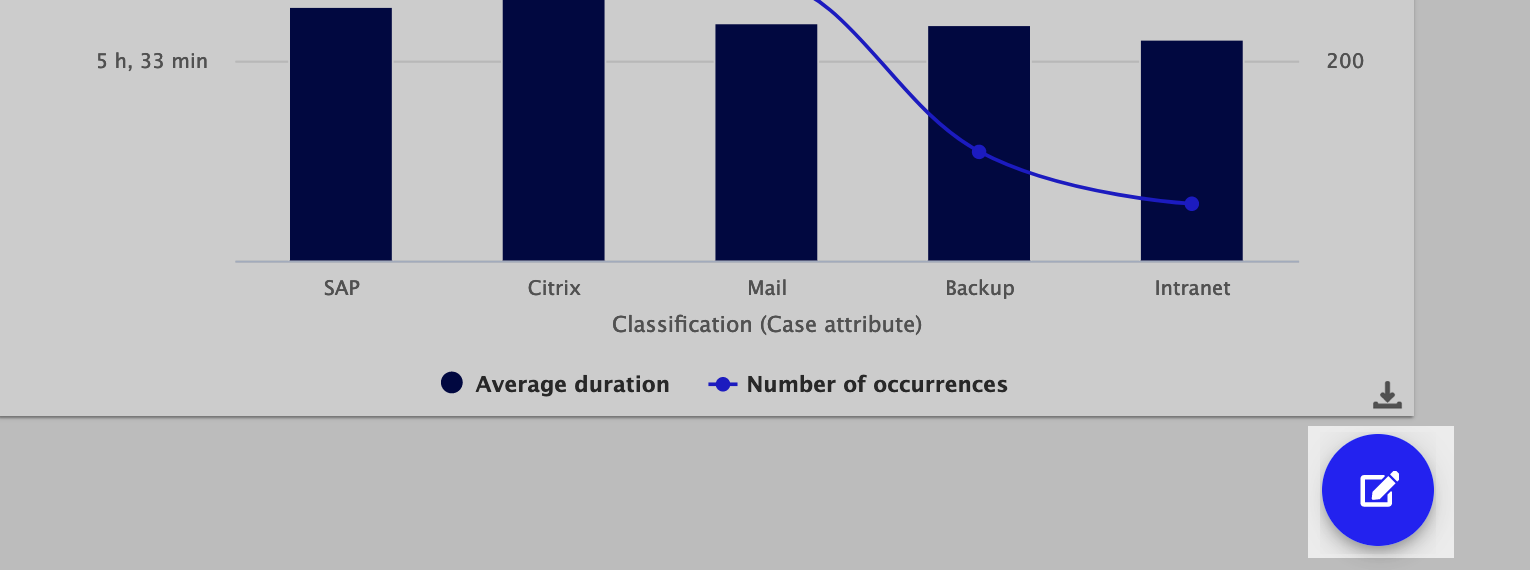
To add items, such as charts and metrics, to the dashboard, you must switch to the editing mode of the page or dashboard.
To switch to dashboard edit mode:
Once you're in editing mode, you can add a new item. In the sidebar, select a chart type from the list:
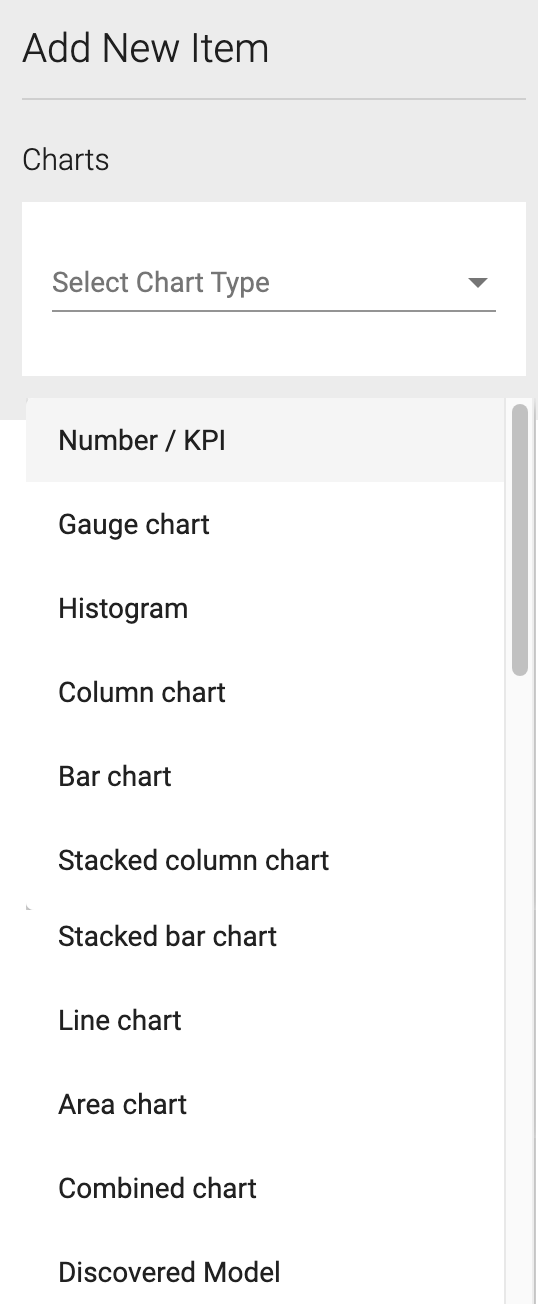
An empty chart appears on the dashboard, ready for your to configure.
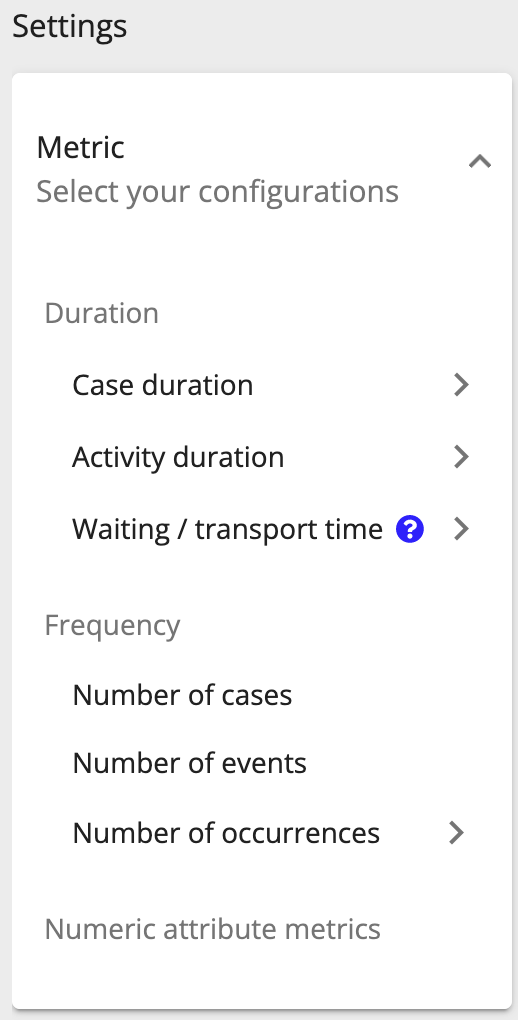
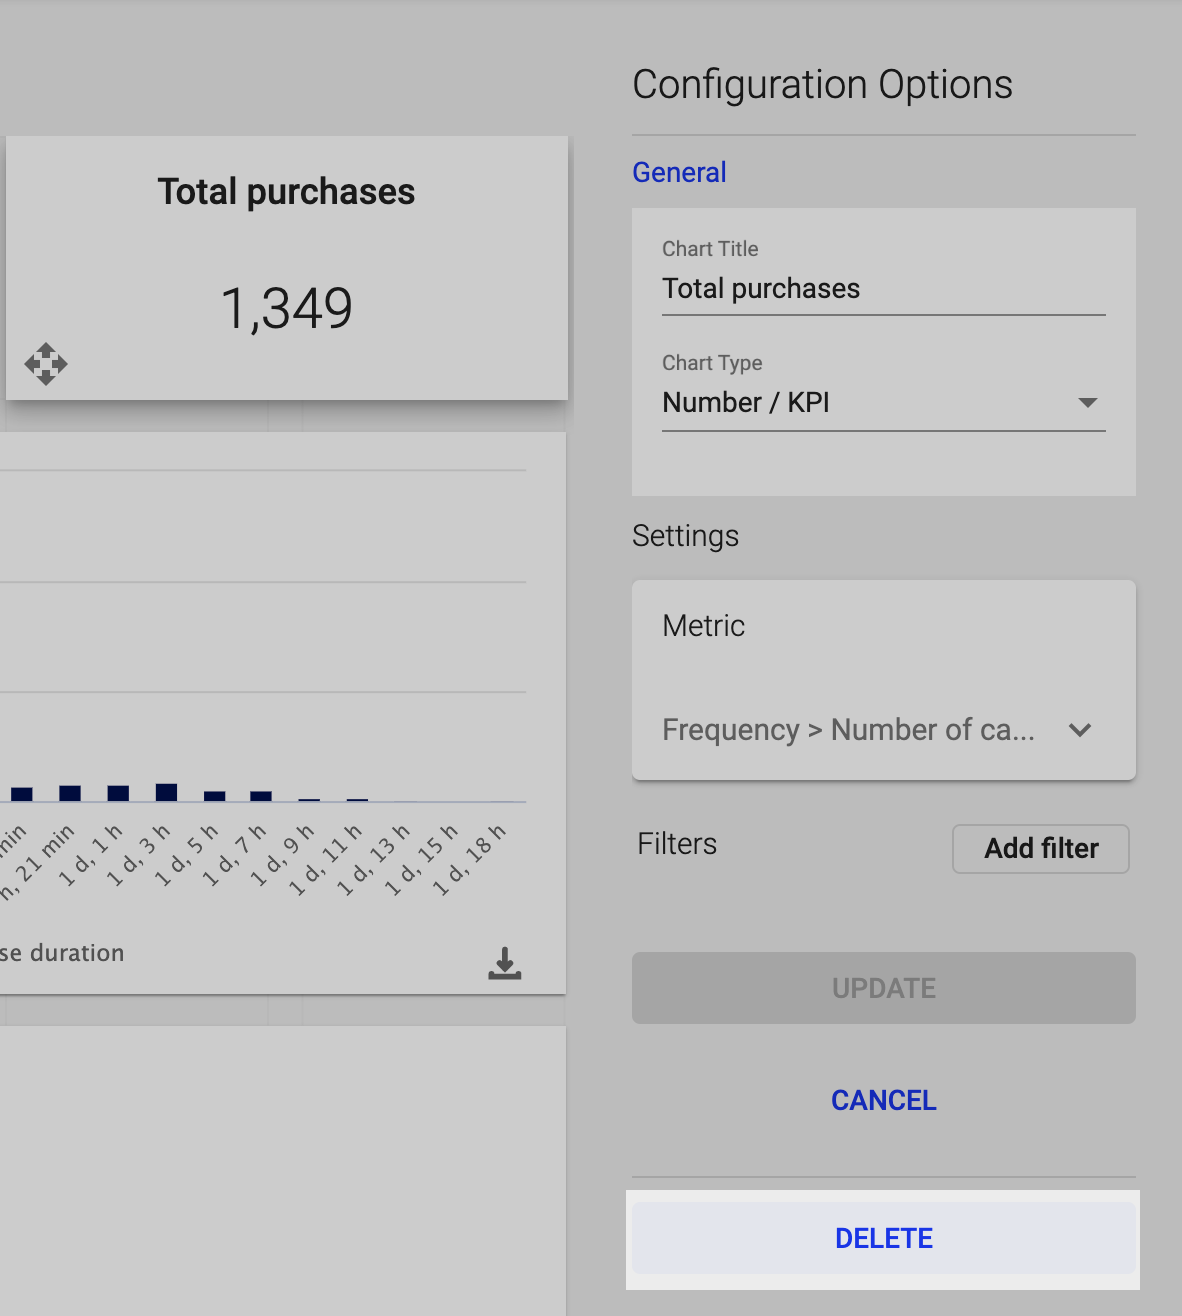
In the Settings area of the Configuration Options, enter the following:
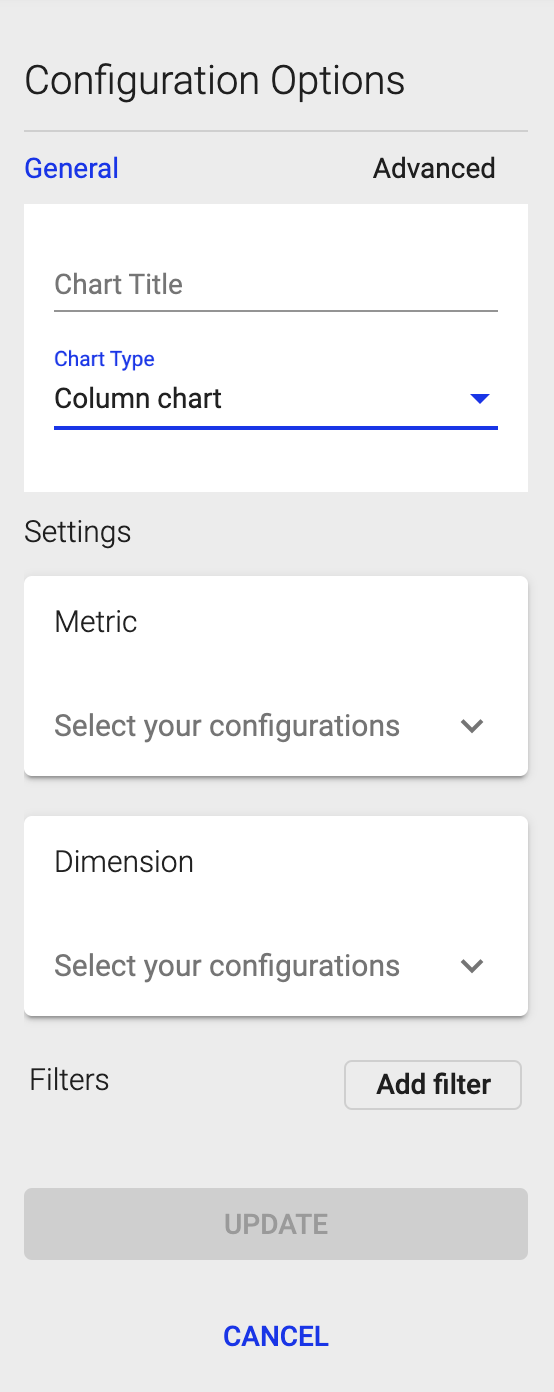
When you select a metric or a dimension, you can drill down into more specific settings. For example, if you select Case duration, you can then choose between Average duration, Median duration, etc.
Duration metrics let you display data about how long certain aspects of your process take:
Frequency metrics let you display data about how often certain asppects of your process occur:
When you're ready to save changes, click UPDATE. The chart refreshes and shows the updated information. You'll see No data available in the chart if the commands do not lead to a valid result or if there is no data for the selected combination.
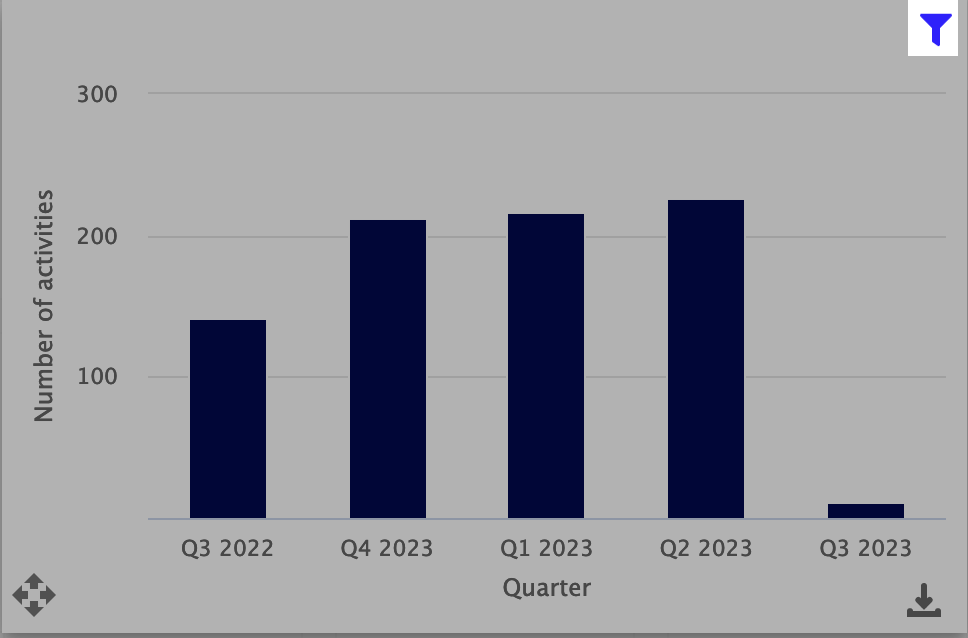
You can apply a filter to the chart to focus the data that's displayed. Click Add filter to create one. If a filter is applied to a chart, a Filter ![]() icon displays in the corner.
icon displays in the corner.
You can change the size and location of the chart on the dashboard. The size of the chart is adjusted according to the lines of the dashboard grid. You need to be in editing mode to resize or move a chart.
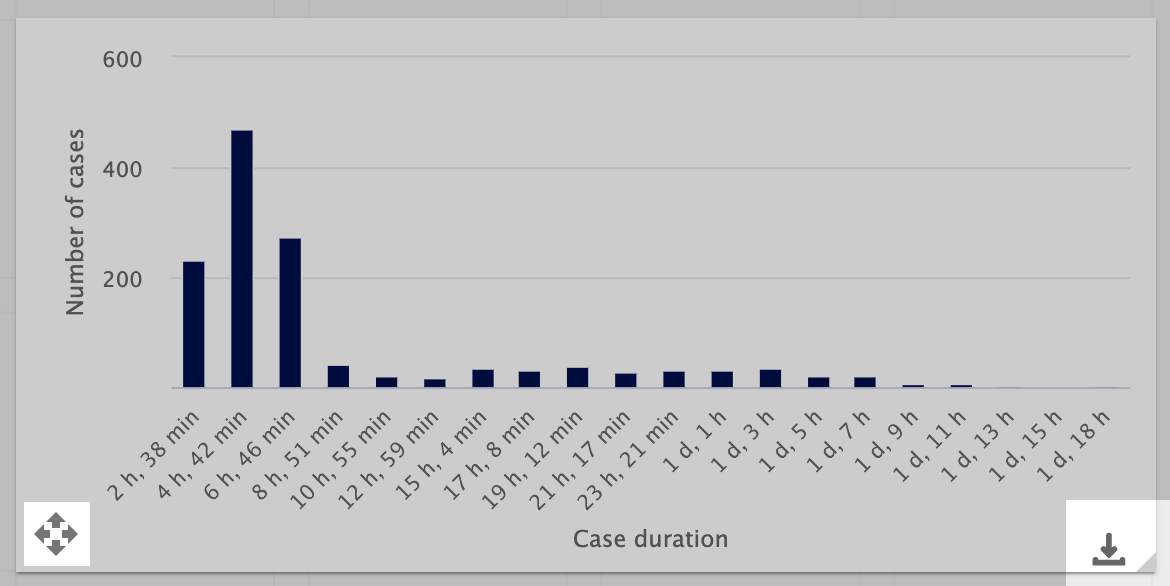
To move the chart, click and hold the arrows icon in the lower left. Drag and drop the chart where you want it to appear on the dashboard.
To resize the chart, click and drag the lower right corner to make it larger or smaller.
Some charts include an Advanced settings tab in the Configuration Options.
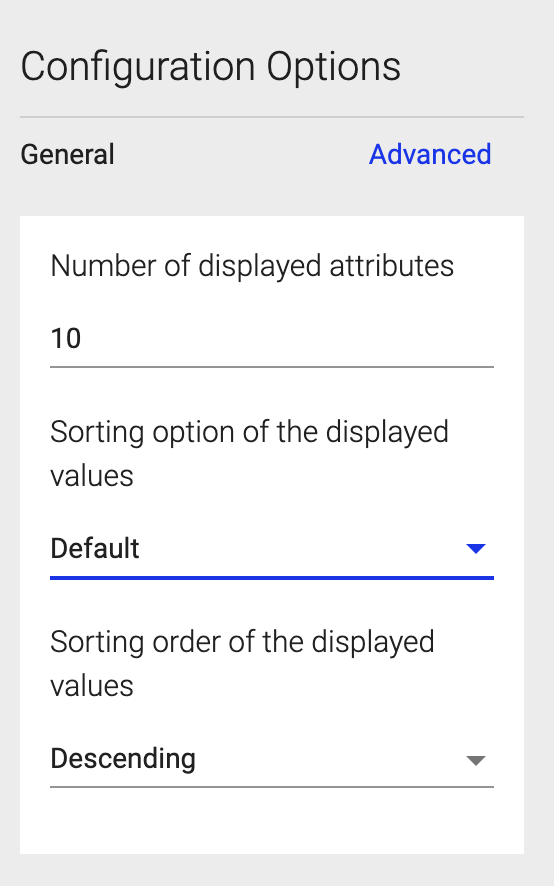
Certain advanced options are available for different chart types:
| Chart type | Advanced options |
|---|---|
| Column chart | Number of displayed attributes; Sorting option of the displayed values; Sorting order of the displayed values; Threshold |
| Bar chart | Number of displayed attributes; Sorting option of the displayed values; Sorting order of the displayed values; Threshold |
| Line chart | Number of displayed attributes; Sorting option of the displayed values; Sorting order of the displayed values |
| Area chart | Number of displayed attributes; Sorting option of the displayed values; Sorting order of the displayed values |
| Combined chart | Number of displayed attributes; Sorting option of the displayed values; Sorting order of the displayed values |
| Histogram | X-axis duration unit; Bins |
| Gauge chart | Metric |
The column chart and bar chart let you define threshold values and be notified if they are exceeded.
To delete a chart:
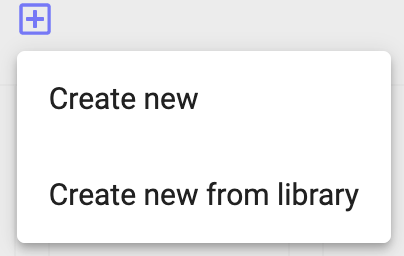
To add a new tab:
Choose Create New to start with a blank tab, or Create New from Library to create a dashboard from a template.
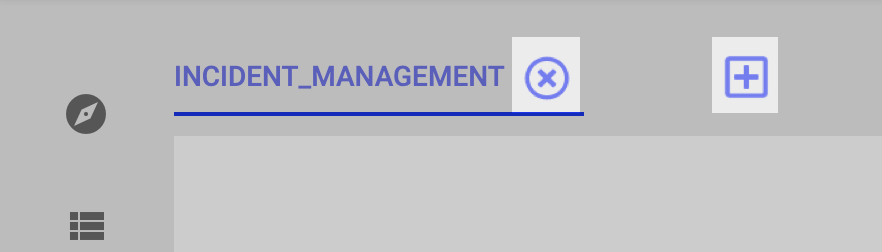
To delete a tab, click the X on the tab.
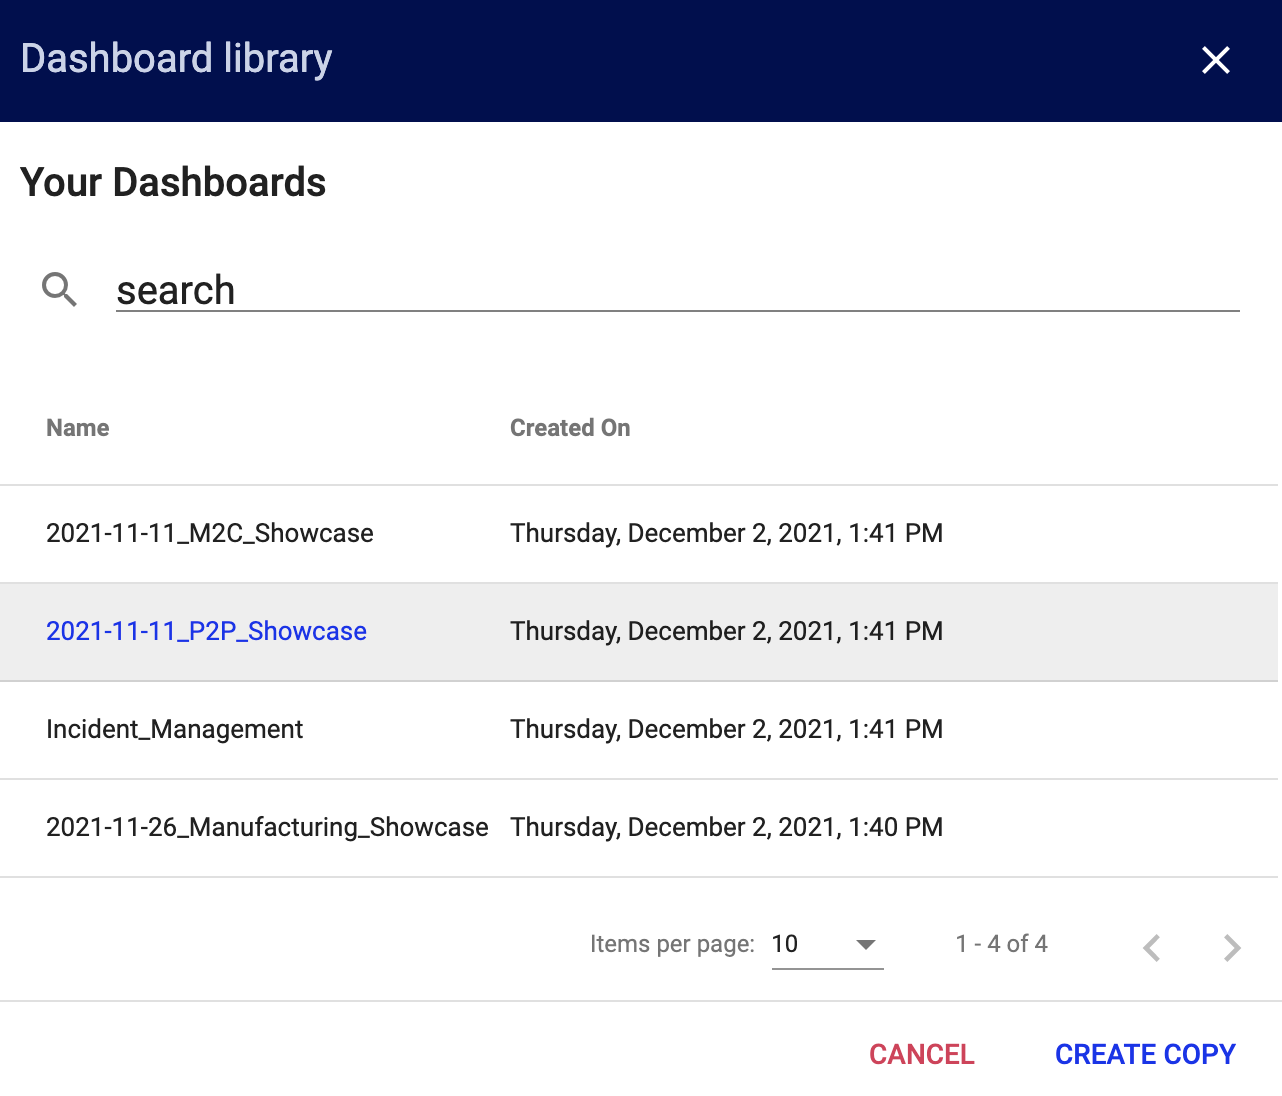
If you previously built a dashboard that you wish to use again, or a dashboard has been shared with you, you can use it as a template when you create a new dashboard. When you add a new tab, choose Create New from Library to create a dashboard from a template.
In the window, you'll see your existing dashboards or dashboards that have been shared with you. Both types of dashboards appear in the table. Use the search function and the navigation options to locate the dashboard you wish to use.
Click the row of the dashboard you want to use. Click CREATE COPY to use that dashboard as a starting point for your new dashboard.
Note: When you create a dashboard, Process Mining uses data from the log you currently have selected. Therefore, certain charts may not appear correctly when you create a dashboard from a template that was designed to be used with a different data set.
You can add, share, edit, and delete dashboards from the management hub. The DASHBOARDS tab displays all the dashboards you have created or that have been shared with you.
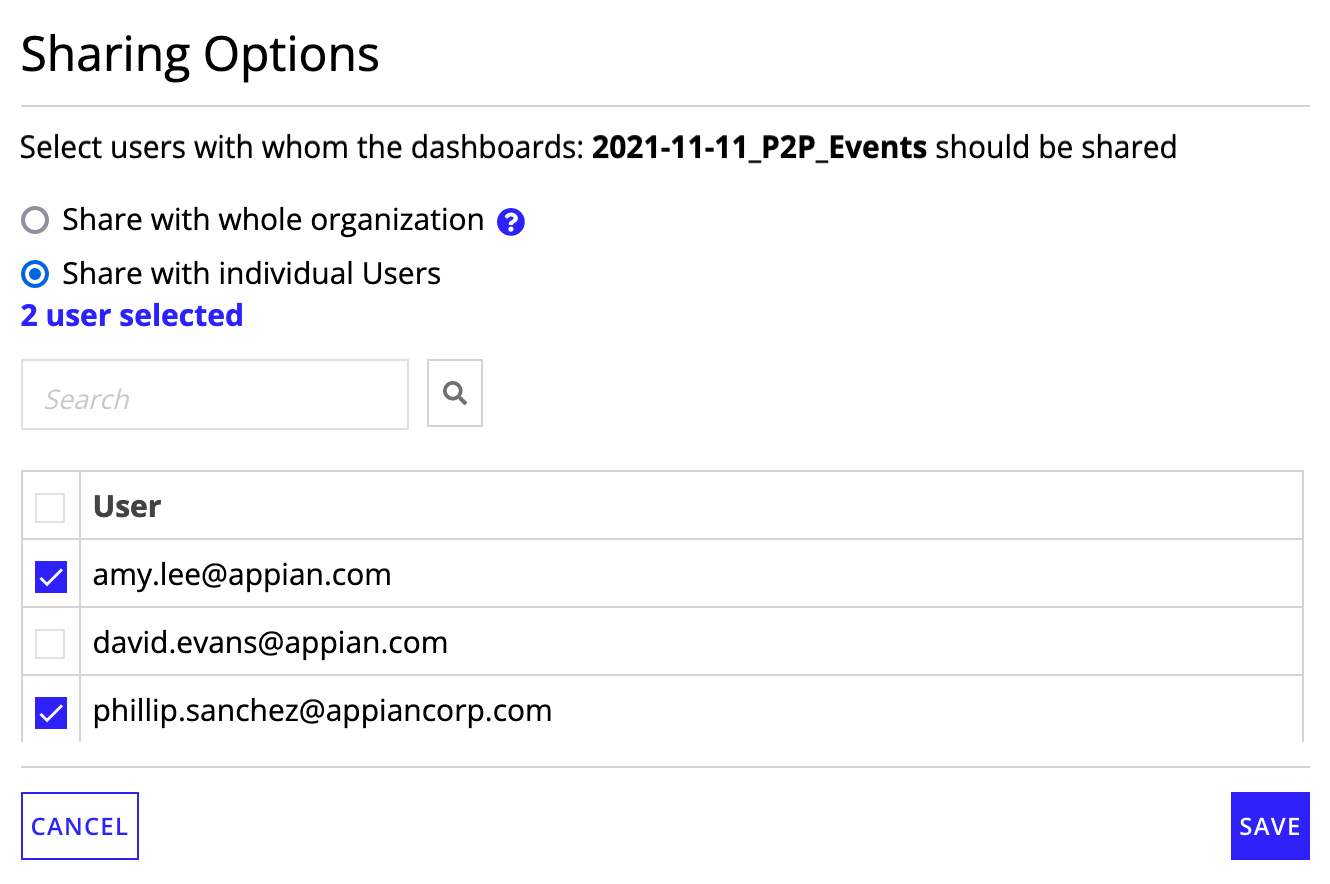
To share a dashboard:
To stop sharing a dashboard:
