
Tip: Interface patterns give you an opportunity to explore different interface designs. Be sure to check out How to Adapt a Pattern for Your Application.
GoalCopy link to clipboard
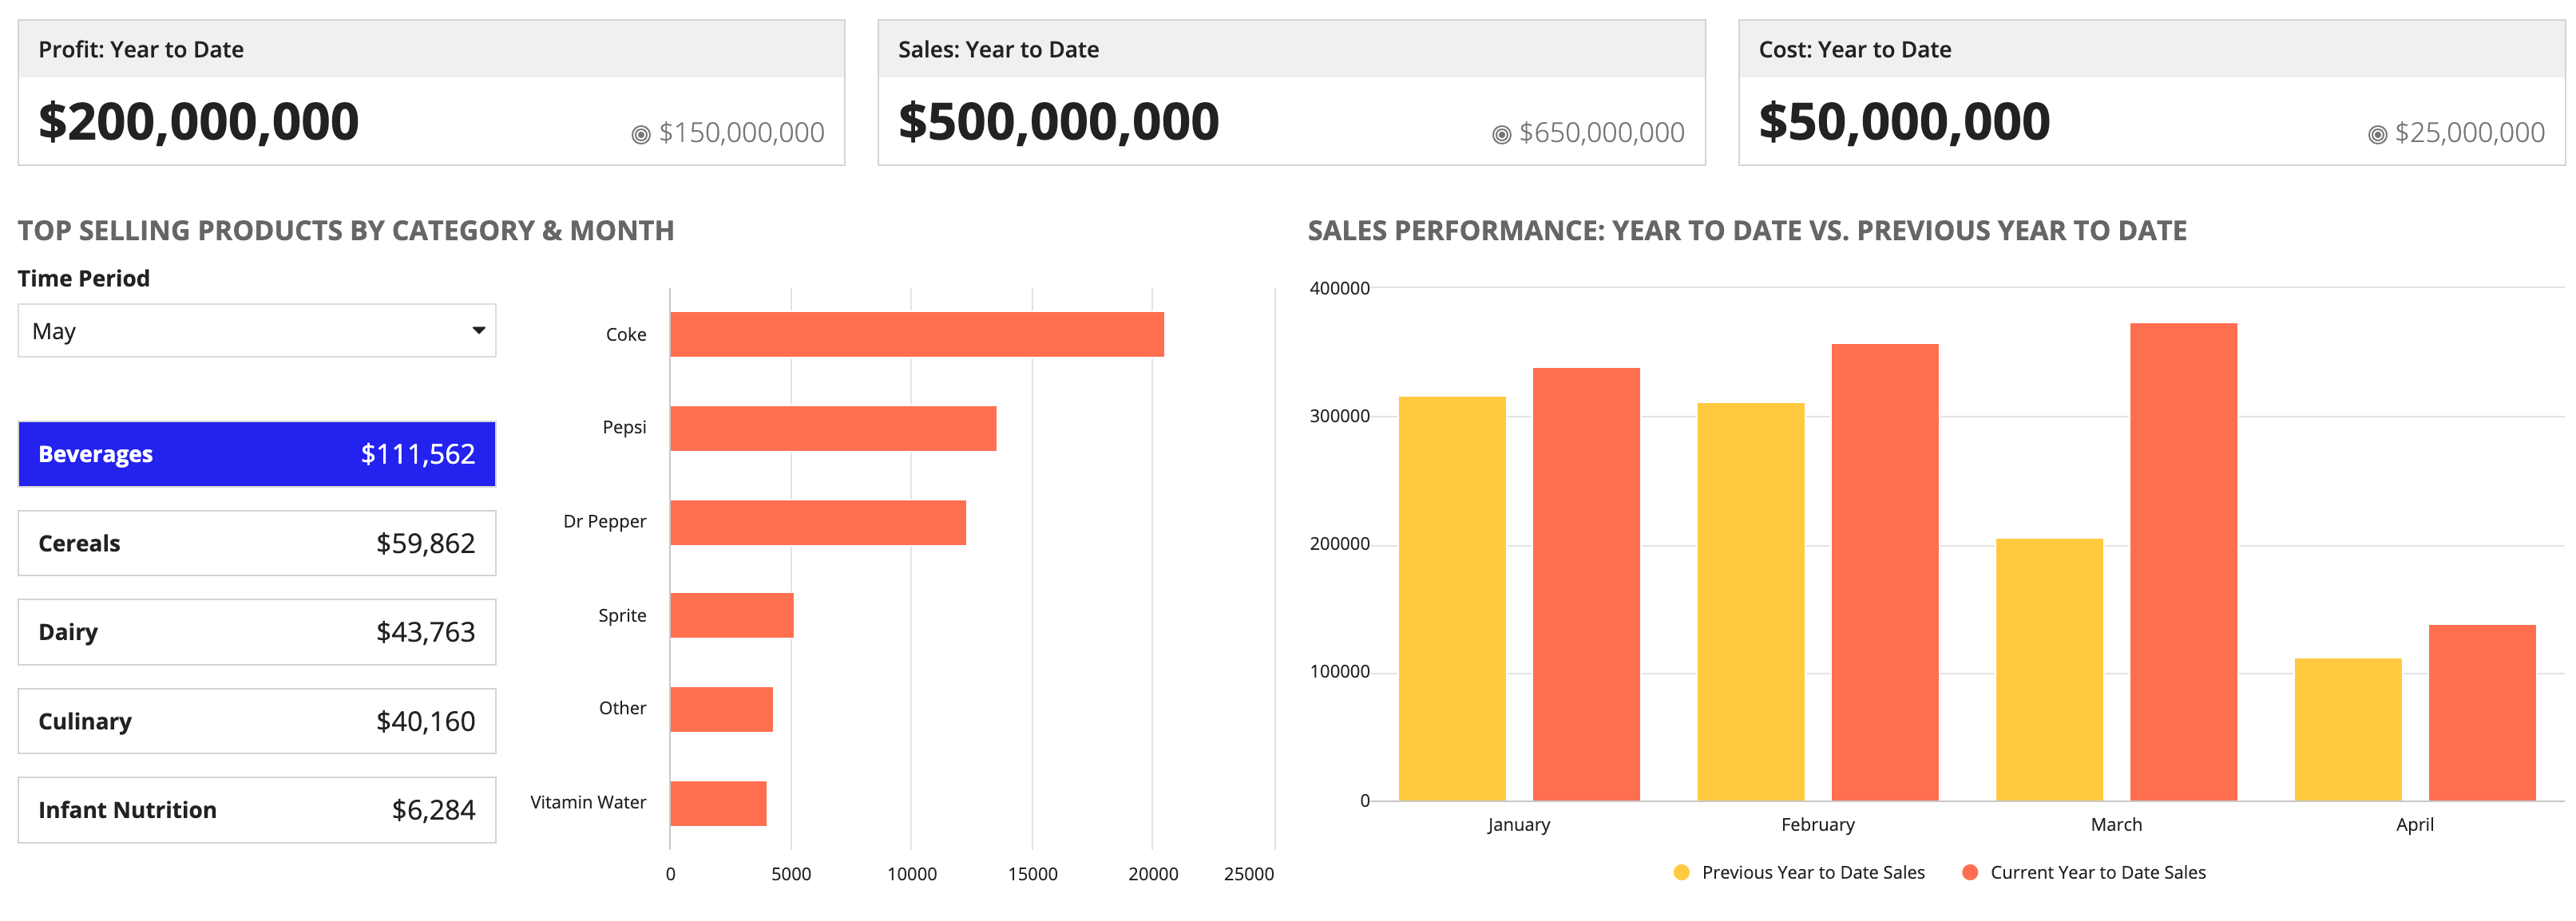
This is a feature-rich, interactive report for sales and profits by products over select periods of time. This page explains how you can use this pattern in your interface, and walks through the design structure in detail.
Design structureCopy link to clipboard
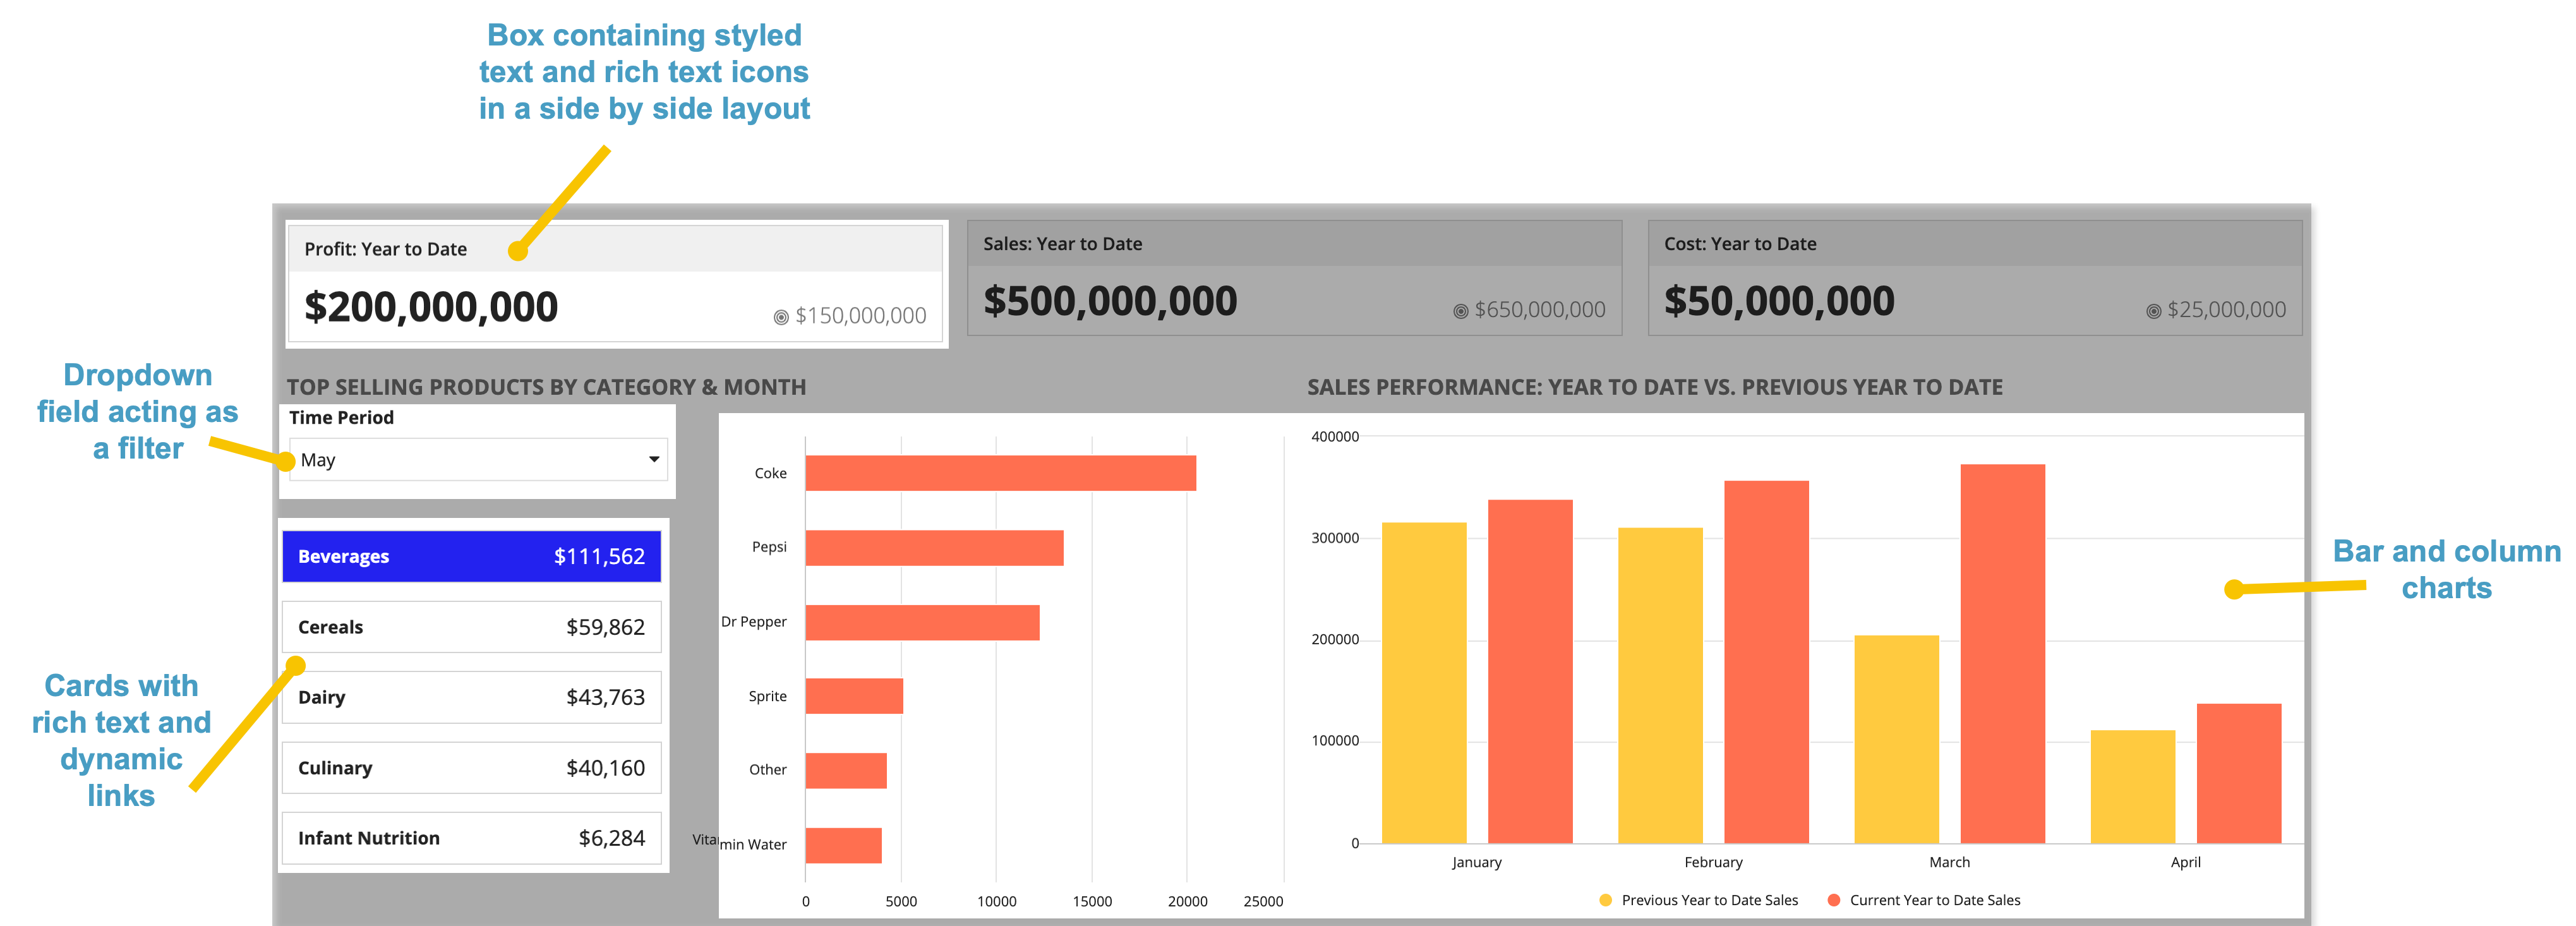
The main components in this pattern are box layout, rich text display, and chart components that show a break down of profits, sales, and costs per year, month, and product. The components are organized in side by side layouts nested within columns layouts.
The image below displays how the pattern looks on a blank interface with callouts of the main components.
Pattern expressionCopy link to clipboard
To add this pattern to your interface, from a blank interface object, under EXAMPLES click YEAR OVER YEAR REPORT or click Copy expression in the code box below.
The pattern introduces a 406-line expression to the interface.