
Tip: Interface patterns give you an opportunity to explore different interface designs. Be sure to check out How to Adapt a Pattern for Your Application.
GoalCopy link to clipboard
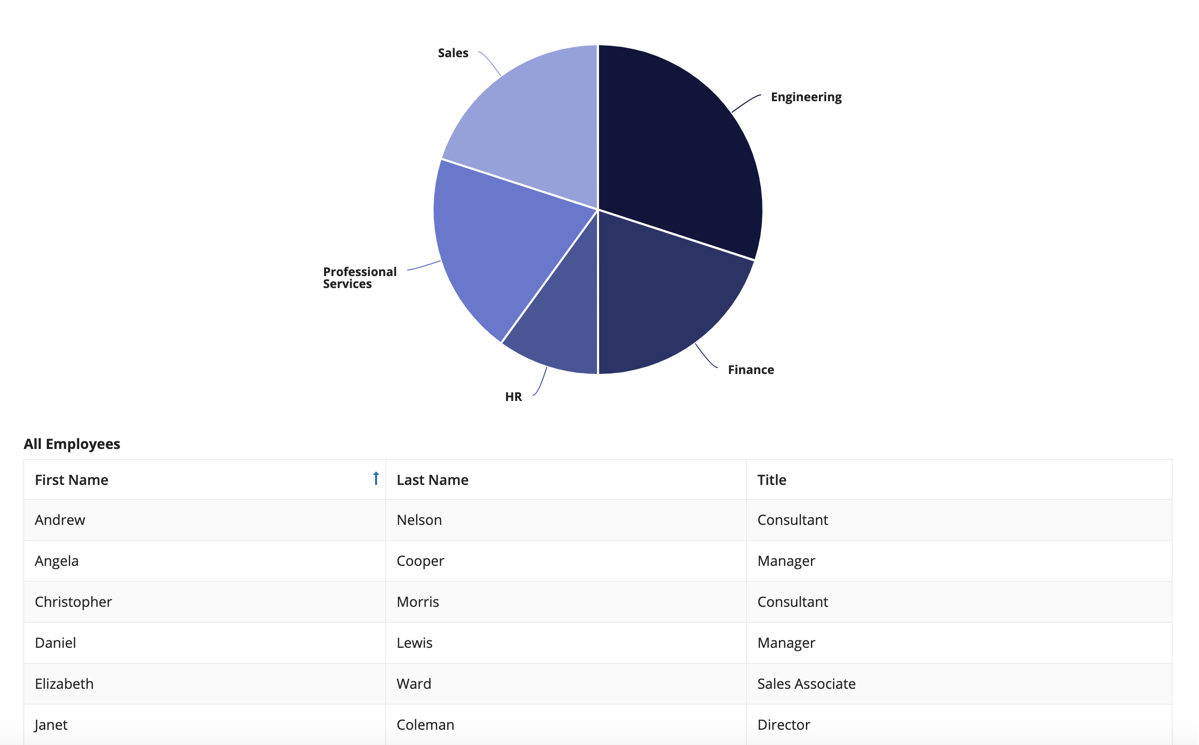
Display an interactive pie chart with selectable sections so that a user may filter the results in a grid.
This design pattern is not recommended for offline interfaces because reflecting immediate changes in an interface based on user interaction requires a connection to the server.
Note: This expression uses direct references to the Employee record type, created in the Records Tutorial. If you've completed that tutorial in your environment, you can change the existing record-type references in this pattern to point to your Employee record type instead.
This interface has two main components: (1) a grid listing all of a company’s employees, and (2) a pie chart with dynamic link sections capable of filtering the grid by department.
This scenario demonstrates:
- How to use an expression to add links to each slice of the pie chart and use those links to filter grid data.
- How to use multiple datasubsets.
Create this patternCopy link to clipboard
This recipe uses references to record types and record fields. To use this recipe, you will need to update the references to record types and record fields in your application.
1
2
3
4
5
6
7
8
9
10
11
12
13
14
15
16
17
18
19
20
21
22
23
24
25
26
27
28
29
30
31
32
33
34
35
36
37
38
39
40
41
42
43
44
45
46
47
48
49
50
51
52
53
54
55
56
57
58
59
60
61
62
63
64
65
66
67
68
69
70
71
72
73
74
75
76
77
78
79
80
81
82
83
84
85
86
87
88
89
90
91
92
93
94
95
96
a!localVariables(
  local!chartDataSubset: a!queryRecordType(
    recordType: recordType!Employee,
    /* Grouping on department then counting the total ids in that group
    for the pie chart to size. This returns an array of departments
    with the total number of employees in that department. It looks
    like this: { {department:Engineering, id: 6}...} */
    fields: a!aggregationFields(
      groupings: a!grouping(
        field: recordType!Employee.fields.department,
        alias: "department"
      ),
      measures: a!measure(
        field: recordType!Employee.fields.id,
        function: "COUNT",
        alias: "id_measure"
      )
    ),
    pagingInfo: a!pagingInfo(
      startIndex: 1,
      batchSize: 5000,
      sort: a!sortInfo(
        field: "department",
        ascending: true
      )
    )
  ),
  /* local!selectedDepartment holds the name of the selected pie chart section. */
  local!selectedDepartment,
  a!sectionLayout(
    contents: {
      a!pieChartField(
        series: a!forEach(
          items: local!chartDataSubset.data,
          expression: a!chartSeries(
            label: fv!item.department,
            data: fv!item.id,
            links: a!dynamicLink(
              /* The dynamic link stores the department value into local!selectedDepartment. */
              value: fv!item.department,
              saveInto: local!selectedDepartment
            )
          )
        ),
        colorScheme: "MIDNIGHT"
      ),
      a!linkField(
        labelPosition: "COLLAPSED",
        links: a!dynamicLink(
          label: "Show all employees",
          value: null,
          saveInto: { local!selectedDepartment }
        ),
        showWhen: not(isnull(local!selectedDepartment))
      ),
      a!gridField(
        label: if(
          isnull(local!selectedDepartment),
          "All Employees",
          "Employees in " & local!selectedDepartment
        ),
        emptyGridMessage: "No employees meet this criteria",
        data: a!recordData(
          recordType: recordType!Employee,
          /* Filter the department column based on the value of local!selectedDepartment. */
          filters: a!queryLogicalExpression(
            operator: "AND",
            filters: a!queryFilter(
              field: recordType!Employee.fields.department,
              operator: "=",
              value: local!selectedDepartment
            ),
            ignorefilterswithemptyvalues: true
          )
        ),
        columns: {
          a!gridColumn(
            label: "First Name",
            sortField: recordType!Employee.fields.firstName,
            value: fv!row[recordType!Employee.fields.firstName]
          ),
          a!gridColumn(
            label: "Last Name",
            sortField: recordType!Employee.fields.lastName,
            value: fv!row[recordType!Employee.fields.lastName]
          ),
          a!gridColumn(
            label: "Title",
            sortField: recordType!Employee.fields.title,
            value: fv!row[recordType!Employee.fields.title]
          )
        }
      )
    }
  )
)
Copy
Test it outCopy link to clipboard
- Click a slice of the chart. The grid below the chart will be filtered to display only employees for that department.
- Click the "Show all employees" link. The grid will display all employees.
Notable implementation detailsCopy link to clipboard
- Notice that when the grid is filtered, we are not querying the department field. This allows us to only query the data that we plan on displaying in the grid.