| The capabilities described on this page are included in Appian's standard capability tier. Usage limits may apply. |
Even the simplest robotic tasks need to be tested and updated before deploying to production. There are multiple ways to ensure that your Appian RPA robotic tasks behave as you expect. If you're new to robotic task development and debugging, Appian RPA's native debugging tool helps you test and confirm individual actions in the robotic task definition so you can focus your efforts on fixing what might be going wrong.
This page describes how to debug a robotic task. This page also contains instructions on how to troubleshoot some common issues that developers may encounter when coding, configuring, and testing a robotic task. Read on to learn how to fix these problems.
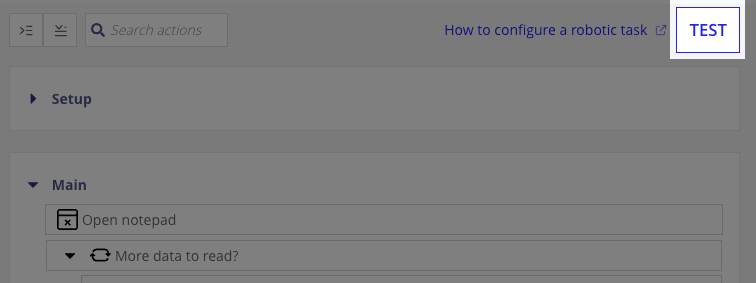
Use the debugging tool to go through the robotic task definition action-by-action and isolate where issues might arise. To use the tool, you'll select Debugging? when you manually execute the robotic task.

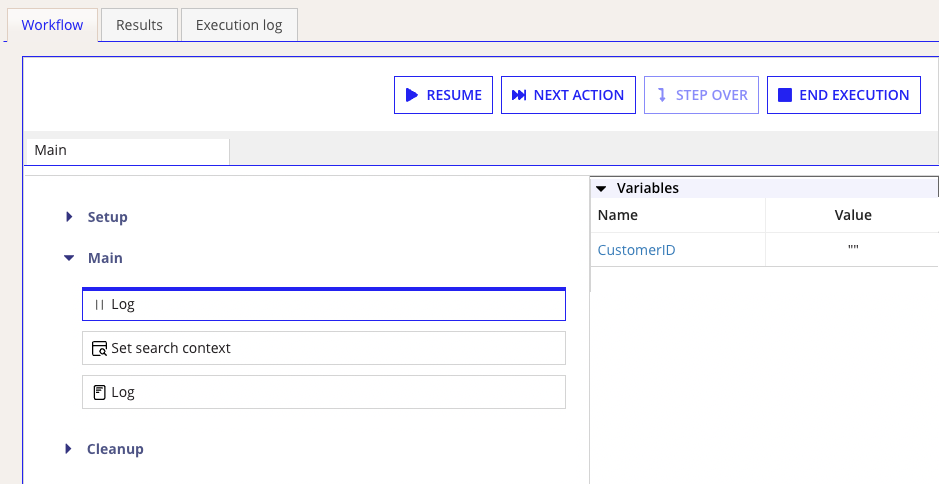
You can access debugging options and information in the Execution Preview by starting an execution and navigating to the Workflow tab. On the Workflow tab, you can
 ,
, ,
, ,
,Breakpoints are points in the robotic task where you want the execution to pause. The execution pauses just before the action or action group where you've added the breakpoint. When you continue, the robotic task will continue executing from the action where it's paused, going to the next action or action group. Breakpoints help you assess the robotic task at different points of the execution. You can add breakpoints to individual actions or action groups. For example, you can add a breakpoint at an action where you want to check that a variable was properly captured.
Once a you've added a breakpoint, a Breakpoint icon  displays beside the action. Click this icon to remove the breakpoint.
Disabled actions are skipped during the debugging execution. If you're confident that piece of the robotic task is working properly, or you want to otherwise ignore it as you debug, you can disable it.
You may want to run the robotic task from a specific action to isolate parts of the robotic task. Isolating actions is helpful to determine if they're configured properly and working as expected. This option can be useful if you're debugging a simple action later on in the robotic task, without having to run through more complex pieces of the robotic task first. You can only run from actions in the currently active section (Setup, Main, or Cleanup). This option isn't available for actions within a subtask or loop.
Tip: If you use the Run from action option, the robotic task may not have the information necessary to complete subsequent actions successfully. For example, variables may not be populated correctly or a browser may not be opened if these actions precede the action you're running from. Additionally, you can't run from an action that is inside a loop unless you are already paused at an action within the loop.
You have the option to open a subtask in its own tab and easily track all of its execution steps, just like you do with a parent robotic task. While the parent robotic task remains available in the Main tab, each subtask you open displays in its own tab. Remember, the subtask tabs won't open on their own, but you can simply click Open subtask to view them.
Here are some key points to keep in mind when you're viewing subtasks:
The iterative development and testing cycle of robotic tasks can be time-consuming, but you can save time by modifying variable values during debugging without impacting the saved data.
Here are some key points to keep in mind when you're changing variable values:
To edit a variable's value, click on the variable value link in the Variables grid. The Edit Variable window displays and you can change the value.
Options at the top of the page let you choose how to proceed with the debugging execution:
As the execution proceeds, variables are shown within the Variables pane. You can also find more detailed information in the Execution log tab. Switch to this tab whenever the execution is paused to see if the robotic task is proceeding as you expect.
If an action causes an error during debugging, the Error icon displays on both the action and the group that contains it. As shown in the following example, the action also displays with a red outline. The robotic task pauses on that action and you will need to disable the action or select Run from action to continue.

When you debug a robotic task, remember the following points:
You can view details for every execution of a robotic task. To get started:
You're brought to a page with three tabs containing all the information regarding an execution:
You can also select icons in the toolbar to perform actions:
| Icon | Action | Description |
|---|---|---|
 |
Go to host machine | Learn more about the host machine where the execution occurred. |
 |
Re-execute | Launch the specific execution again with the same input configuration as the original execution. |
 |
Go to robotic task definition | Open the robotic task definition. This can be useful to modify or check certain characteristics of the robotic task during development and testing. |
On this tab, you can find the path the robotic task followed for the selected execution. Though the robotic task definition may have been changed later, you will always see the version of the robotic task definition here as it was at the time the execution was performed.

During a robotic task execution, the current action is highlighted. As the robotic task continues, the rest of the action is highlighted accordingly.
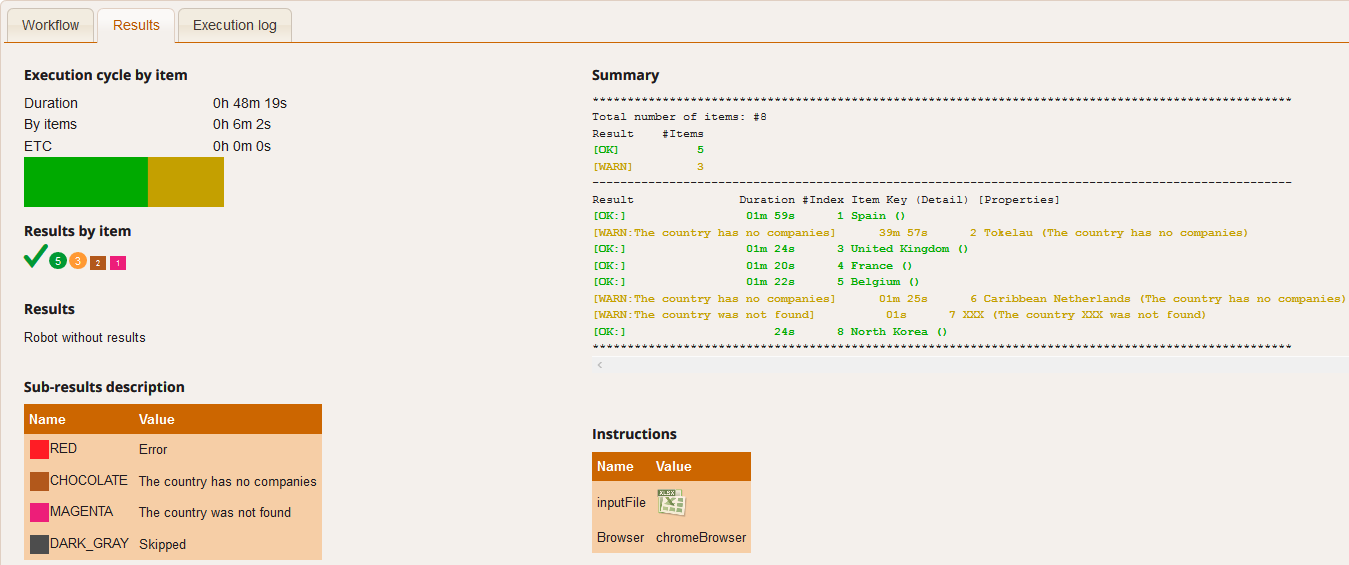
On this tab, you will find all the information related to the results of the selected execution.

The information available here is as follows:
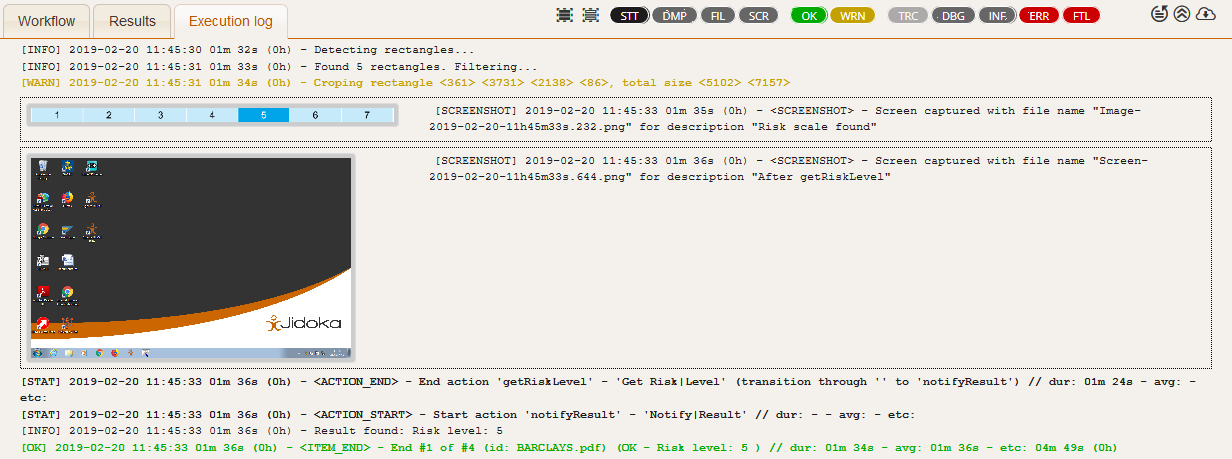
The Execution log tab shows the execution trace in detail. It is very useful information for both users and development teams when debugging a robotic task.
With the execution log, you can follow the robotic task's progress through its robotic task definition. The log shows its activity, informational messages, exceptions, and errors. Developers can code robotic tasks so they display information in the execution log at certain points in the execution.
Tip: Logging custom messages can be helpful, but be mindful of including potentially sensitive information. Appian RPA users with access to the robotic task will also be able to see execution logs. Never log personally identifiable information (PII), decrypted values, or passwords as plain text. More on securing data in robotic tasks.
Execution log benefits include:
Whether you're debugging or running a standard execution of the robotic task, your first step when troubleshooting should be to check the execution log.
Common errors that might appear in the execution log include:
When in doubt, open a support case with Appian Support and attach the execution log.
Results of processed items are color-coded in the execution log. At the top of this tab, you can see several types of log. Click an icon to toggle whether that log type is displayed.

| Icon | Log type |
|---|---|
 |
Statistics |
 |
Dump contribution |
 |
File |
 |
Screenshots |
 |
OK |
 |
Warnings |
 |
Trace |
 |
Debug |
 |
Info |
 |
Error |
 |
Fatal |
You'll also notice the following icons at the top of the execution log:
| Icon | Option |
|---|---|
 |
See the full trace |
 |
Go to the beginning of the log trace |
 |
Download the full trace |
 |
Pause or resume scrolling during an execution |
 |
If video recording was enabled, access the video player and view the execution recording. |
 |
If video recording was enabled, download the video |
For longer execution logs, click View full trace to view more information.
View a summary of information about the agent, both at the beginning and the end of an execution, including:
Here's how this information is shown at the beginning of the execution:

The same information appears at the end of the execution, where the platform also shows the difference in the memory and disk usage after the robotic task ends:

In this example, after the robotic task ends, there is about 34MB more free memory, 16MB more reserved memory, and about 24MB less available disk space.
To help keep you on track, the task recorder may display messages to show you when it's unable to do something.
| Message type | Reason | Guidance |
|---|---|---|
| Error opening browser | This message appears if the task recorder was unable to open the browser you selected. | Ensure no other browsers are open and try again. |
| Error opening application | This message appears if the task recorder was unable to open the application you selected. | Open the application on your desktop, return to the task recorder, and use the Select Application menu to try again. |
| Error connecting to application | This message appears if the task recorder was unable to locate the application you selected, even if it is open. | If the application is not yet open: open the application on your desktop, return to the task recorder, and use the Select Application menu to try again. If the application is open: restart the application on your desktop, return to the task recorder, and use the Select Application menu to try again. |
| Unreliable connection | This message appears if you navigate to a site that violates your network's content security policy. While actions can still be recorded on the page, some steps may not be recorded correctly. | To reliably record actions in Edge (IE) mode browsers, install the user certificate. If issues persist, you may need to contact your network administrator. To reliably record actions in other browsers, you may need to contact your network administrator to adapt security configurations. |
Troubleshoot Appian RPA