Free cookie consent management tool by TermsFeed Area Chart Configuration (a!areaChartConfig)
Area Chart Configuration

Function

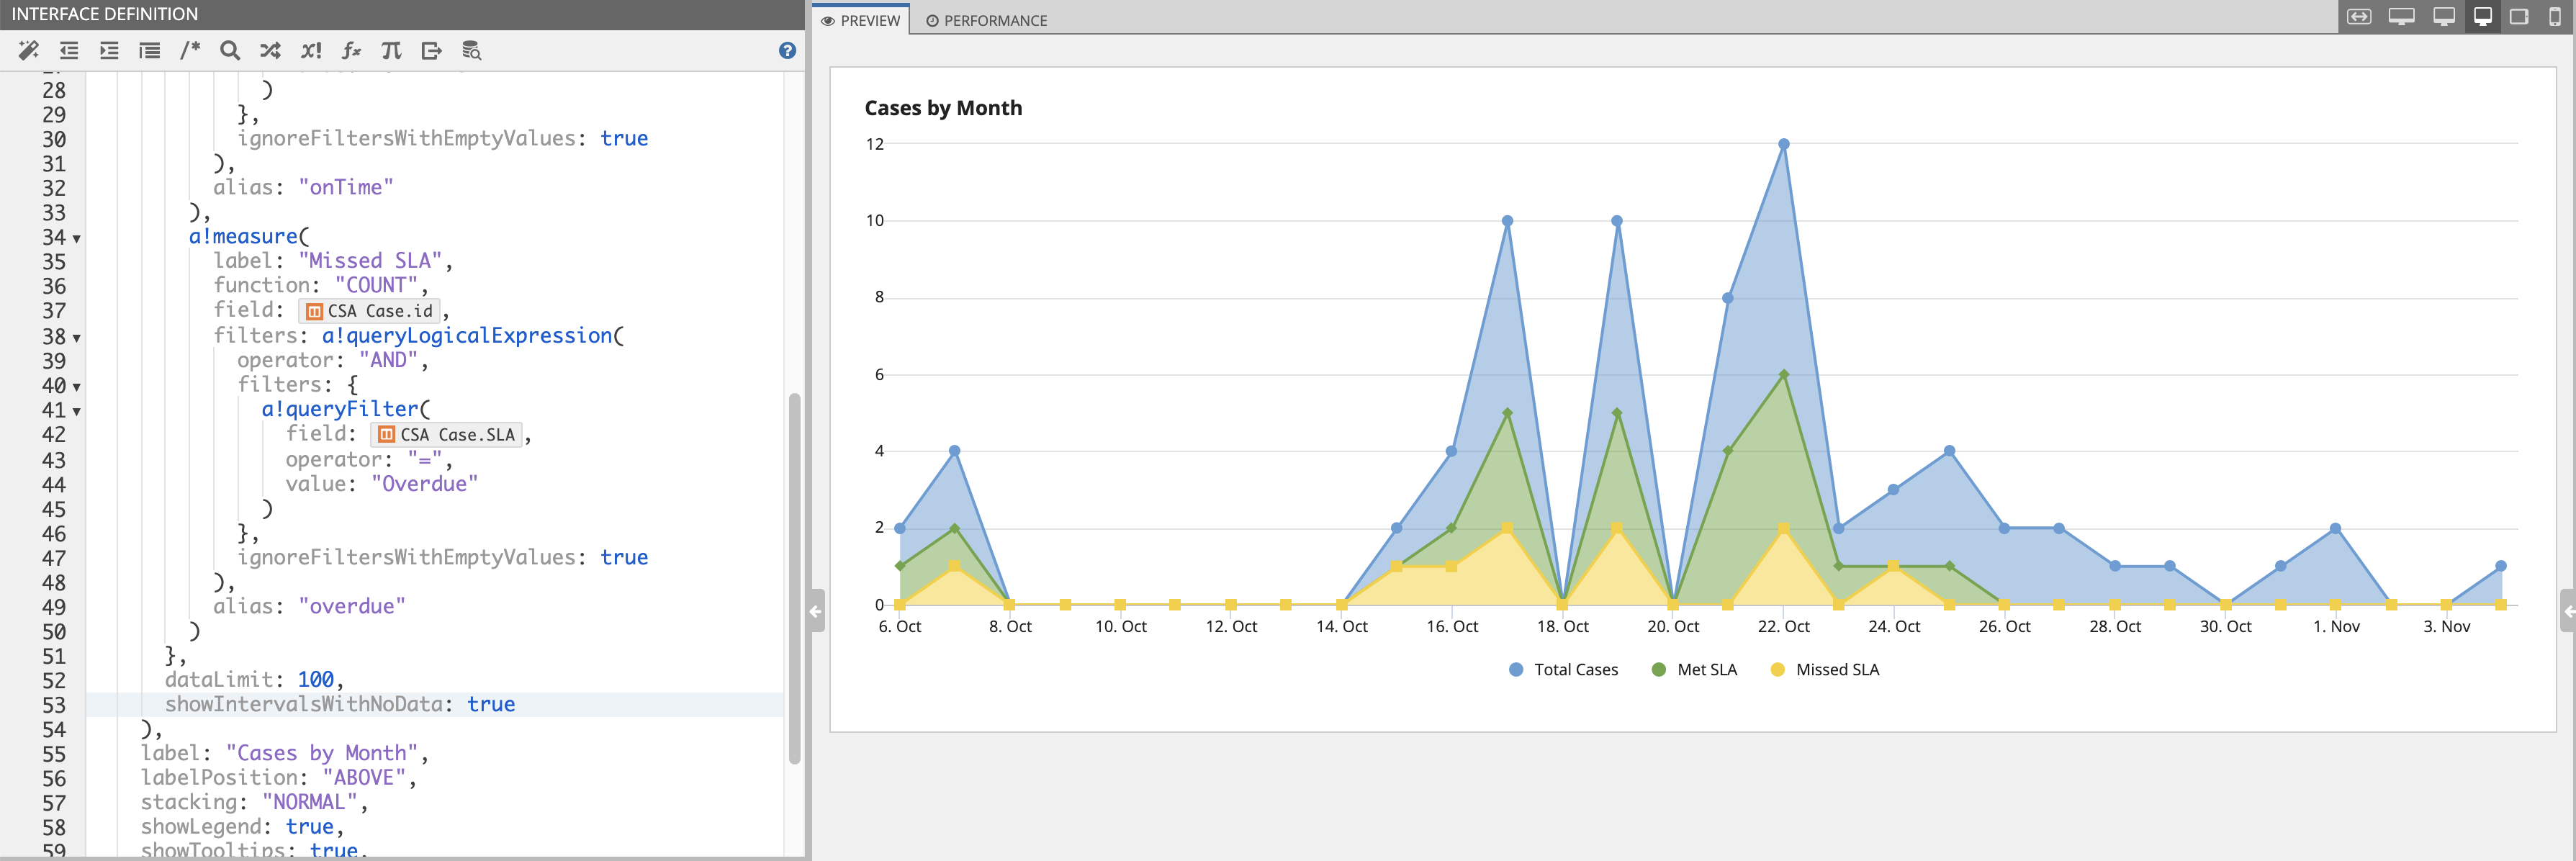
a!areaChartConfig(primaryGrouping, secondaryGrouping, measures, sort, dataLimit, link, showIntervalsWithNoData)

Contains configuration for how to display data in an area chart. See the Area Chart Component page for examples on using this configuration supporting function.

See also:

Parameters

Name Keyword Types Description

Primary Grouping

primaryGrouping

Grouping

Defines the field labels to display on the axis in the chart, configured using a!grouping().

Secondary Grouping

secondaryGrouping

Grouping

Defines the field labels to display in the series of stacked or overlapping data points in the chart, configured using a!grouping().

Measures

measures

List of Measure

Defines the numerical calculations for data in the chart, configured using a!measure(). If no measure is provided, a count of records shows as the measurement in the chart.

Sort

sort

List of SortInfo

Use a!sortInfo() to define a sort in ascending or descending order. Use the alias of any groupings or measures to sort by the values in the chart. Use a record field or related record field reference to sort by data that is not referenced in the chart.

Data Limit

dataLimit

Number (Integer)

Maximum number of data points to display on the chart. Default: 100. Valid values: 1-5000.

Link

link

Any Type

Link to execute when a user selects a data point on the chart. Use fv!selection to pass context from the selection made on the chart to the link. Create a link using a!dynamicLink().

Show time intervals with no data

showIntervalsWithNoData

Boolean

Determines whether the axis in the chart displays date or time values that do not have a value associated with them. For example, show January, February, and March, even if February has no data. This parameter is only available when a Date, Time, or Date and Time field is used as the primary grouping. Default: false.

Usage considerations

Using a!areaChartConfig()

  • a!areaChartConfig() is always used within an area chart component.
  • This configuration is used when a record type is defined as the data source for an area chart.
  • If no measure is provided, the chart displays a count of records and the label displays as Count of <primary key field name>.

Using groups and data limits

  • The primaryGrouping is required to display data on the chart. The data values returned from the grouping display on the horizontal axis.
  • The secondaryGrouping is optional; if this parameter is provided, multiple lines are shown for each unique value in the grouping and the label will display in the legend and/or tooltips if they are enabled.
  • The dataLimit determines the total number of data points displayed in the chart. When both a primary and secondary grouping are provided, there is a data point for each unique combination of values: with 3 values in your primary grouping and 4 values in your secondary grouping, you will have 12 values on your chart.
  • When a dynamic link is added to the link parameter, the current selected data is available using fv!selection. This variable returns a map that contains each of the field aliases as the key and the unformatted value as the value. Since the alias is used for the key, aliases are required for each grouping and measure when using a link. See Chart Configuration Using Records for an example of how to configure a link.

Using the sort parameter

  • You can sort by the alias of any groupings or measures, or by any fields that are not directly referenced in the chart as long as they are of type Number (Integer), Number (Decimal), Date, Date and Time, Time, or Boolean. See Chart Configuration Using Records for an example of sorting by a field not referenced in the chart.
  • When configuring sort in Design Mode, you must use the alias of any groupings or measures to sort by the fields in the chart. In Expression Mode, you can use the alias or the field name if the alias is not provided.

Using the showIntervalsWithNoData parameter

  • To use the showIntervalsWithNoData parameter, the primaryGrouping must be a Date, Time, or Date and Time field, and have a time interval set to a value other than "AUTO". For example:

  • When you configure your chart in Design Mode, the showIntervalsWithNoData parameter will automatically be set to true when you select a time interval for your primary grouping.
  • When showIntervalsWithNoData is true, the sort must be on the primaryGrouping field.
  • The dataLimit applies to this parameter, so any dates without data will be counted in the total number of data points that can be displayed in the chart.

The following patterns include usage of the Area Chart Configuration.

Open in Github Built: Fri, Mar 22, 2024 (05:03:50 PM)

Area Chart Configuration

FEEDBACK